
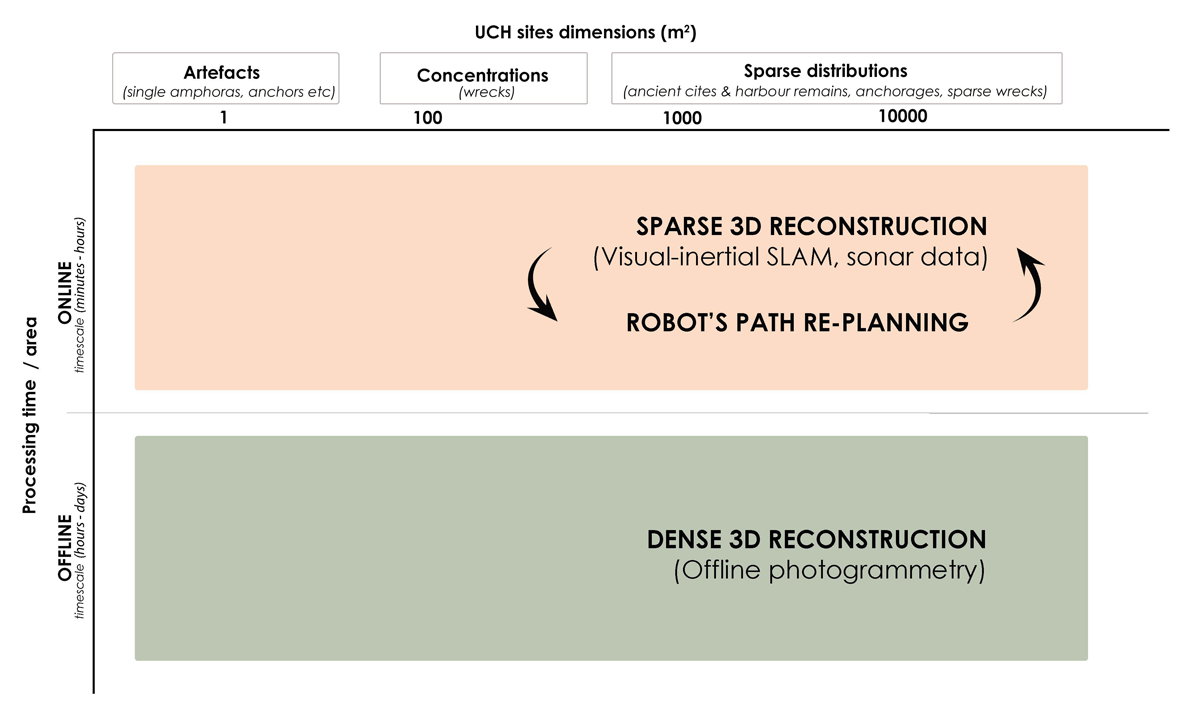
Figure 1
Spatiotemporal graph of the 3D documentation and mapping of underwater archaeological sites of diverse scales and structural complexities via marine robotic operations. (SLAM: Simultaneous localization and mapping).
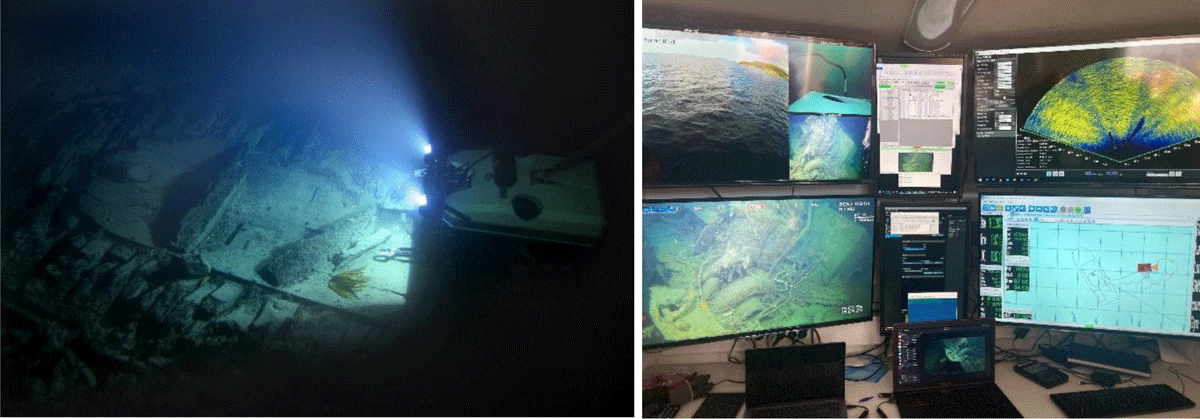
Figure 2
ROV operations in shipwreck environments. Left: ROV Minerva surveying the 18th ct. wreck at Ormen Lange, Norway, 170 m deep (Courtesy of Vitenskapsmuseet, NTNU). Right: ROV control room (Courtesy of AUR-lab, NTNU).
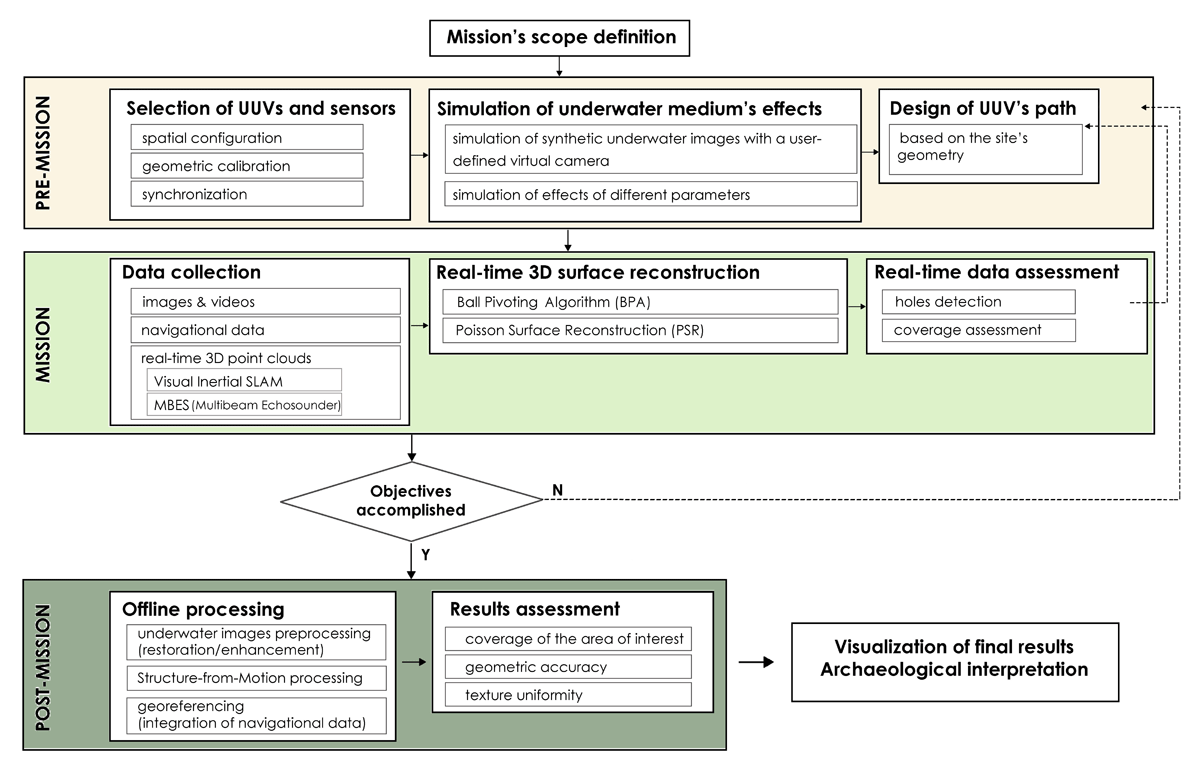
Figure 3
Flowchart of the proposed method: The three phases of an underwater robotic operation for the documentation of UCH sites.
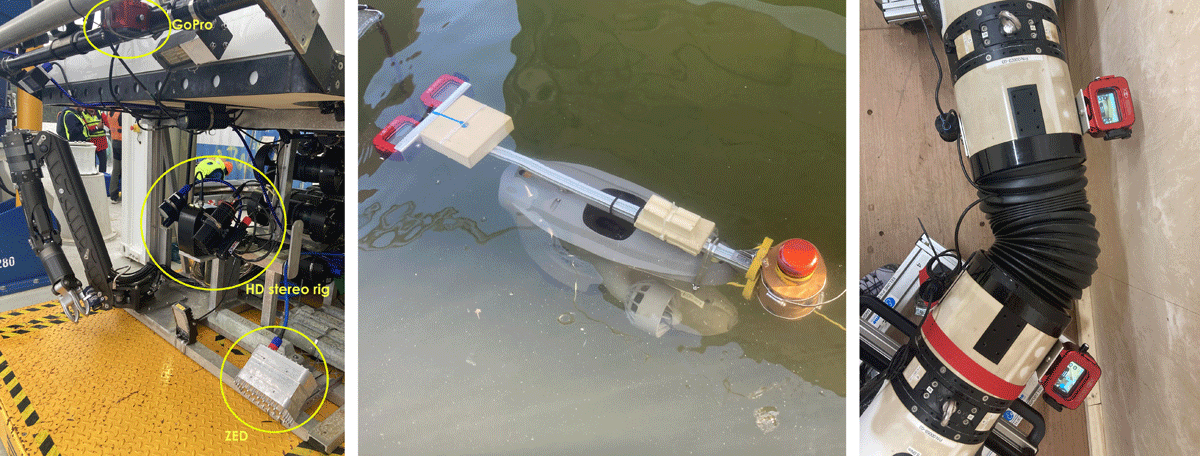
Figure 4
Left: A ZED stereo camera, a stereo rig of HD cameras and a GoPro camera mounted on SUB-Fighter 30K ROV. Middle: A down-looking stereo rig of GoPros mounted on a Blueye ROV. Right: Four GoPros mounted along the snake robot.
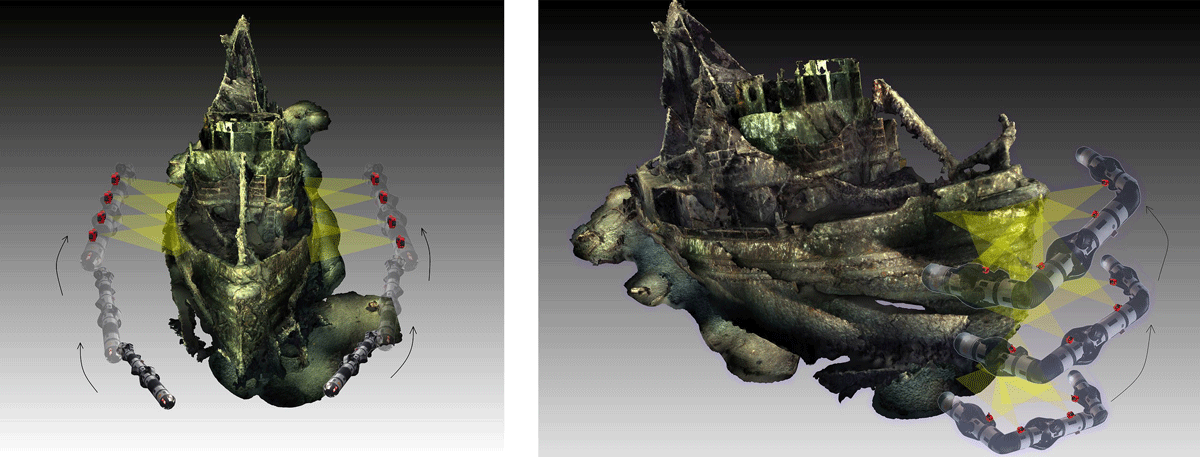
Figure 5
Left: Eelume snake robot scanning the hull of M/S Herkules wreck in a straight pose. Right: Eelume snake robot scanning the bow of M/S Herkules wreck in a U-shape.
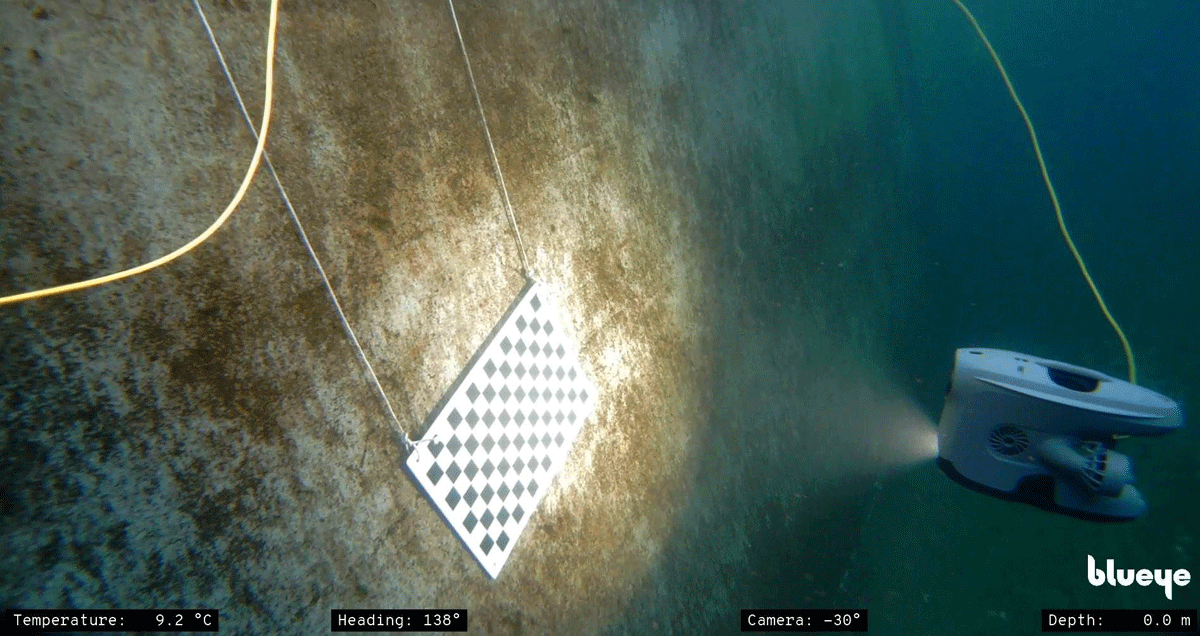
Figure 6
Calibration of the Blueye’s ROV integrated camera.
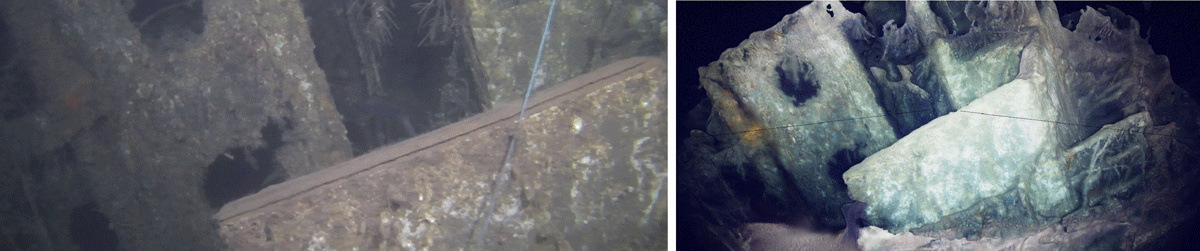
Figure 7
The 3D model was imported into Blender, and the Principled Volume node was used for mimicking volumetric scattering. The parameters were set as follows: scattering color to RGB (0.008, 0.012, 0.264); absorption color to RGB (0.628, 0.628, 0.628); density to 0.1, and anisotropy to 0.9. Left: Real Herkules image sequence serves as the reference image. Right: The 3D model of the wreck is utilized in Blender to simulate underwater images.
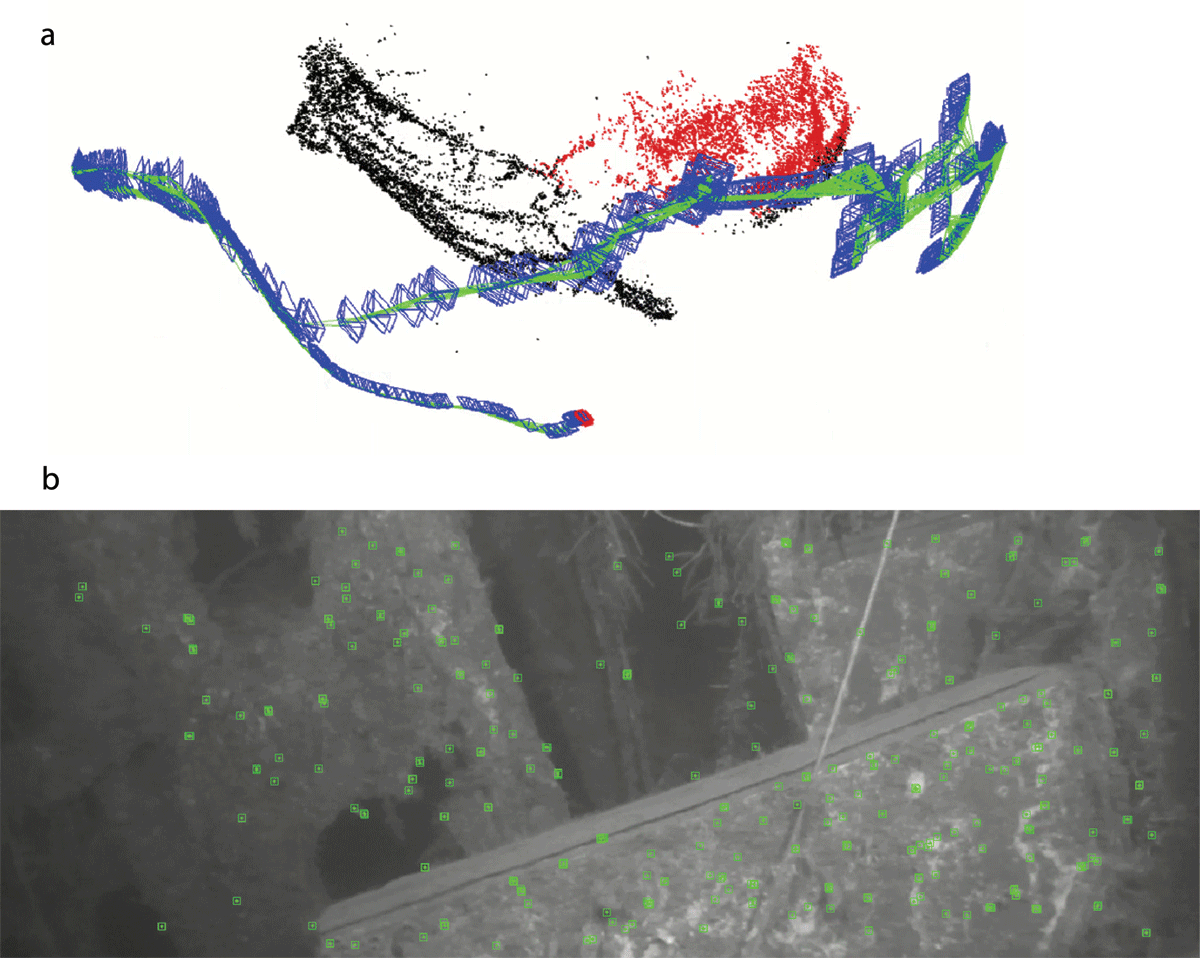
Figure 8
Applying ORB-SLAM3 to real underwater footage of the Herkules wreck without IMU. a. The frequently updated point cloud and trajectory of the monocular camera. b. The green boxes are feature point regions recognized by ORB-SLAM3. Those are used to estimate camera’s location and orientation.
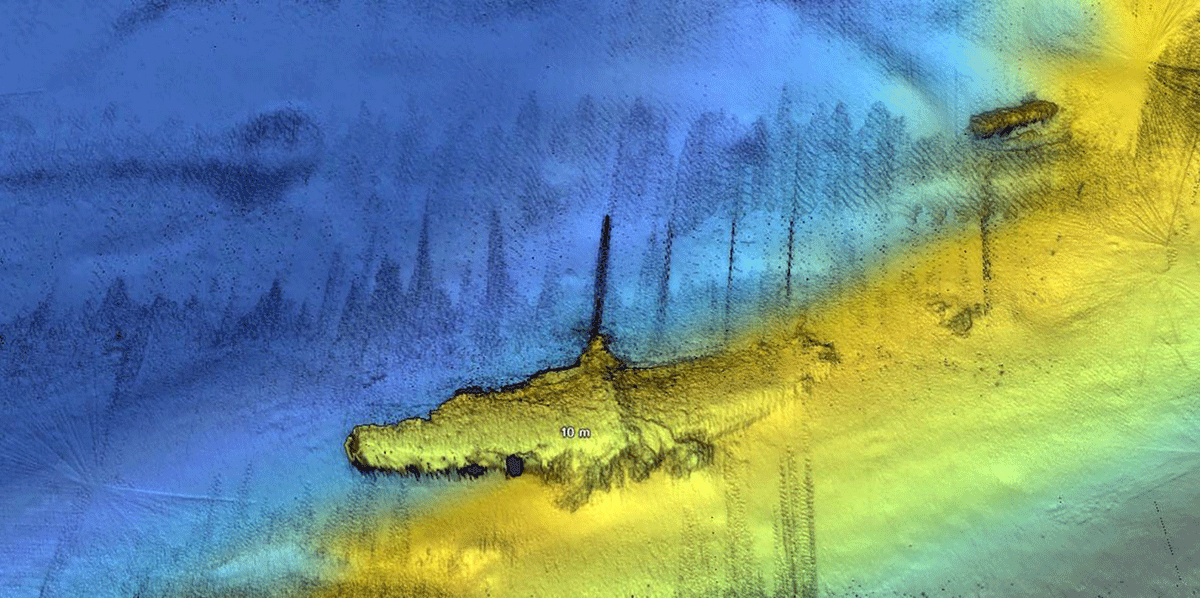
Figure 9
Digital Terrain Model (DTM) built from a point cloud of the WWII airplane wreck obtained by a multibeam echosounder sensor on the Eelume snake robot (Courtesy of Eelume AS).
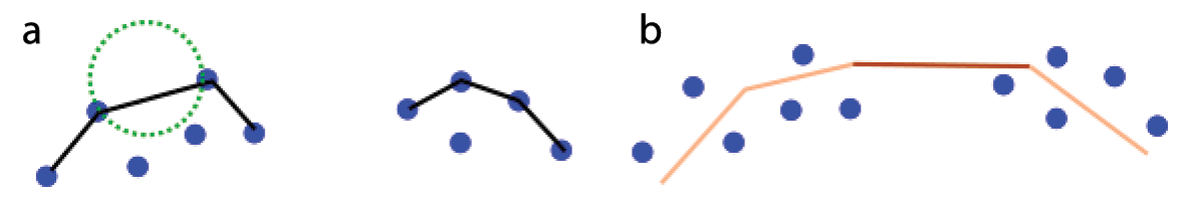
Figure 10
Demonstration of the intuition of BPA and PSR methods. a. BPA: The black lines represent the surface in 3D. The green circle is a ‘2D ball’ used for reconstructing the surface. Notice that there is no line in between because the gap is too big compared to the diameter of the ball. b. PSR: The lines represent the surface in 3D. The light orange line indicates good support from its neighbor points; the dark orange line indicates bad support from its neighbor points. Points do not lie on the surface in general.
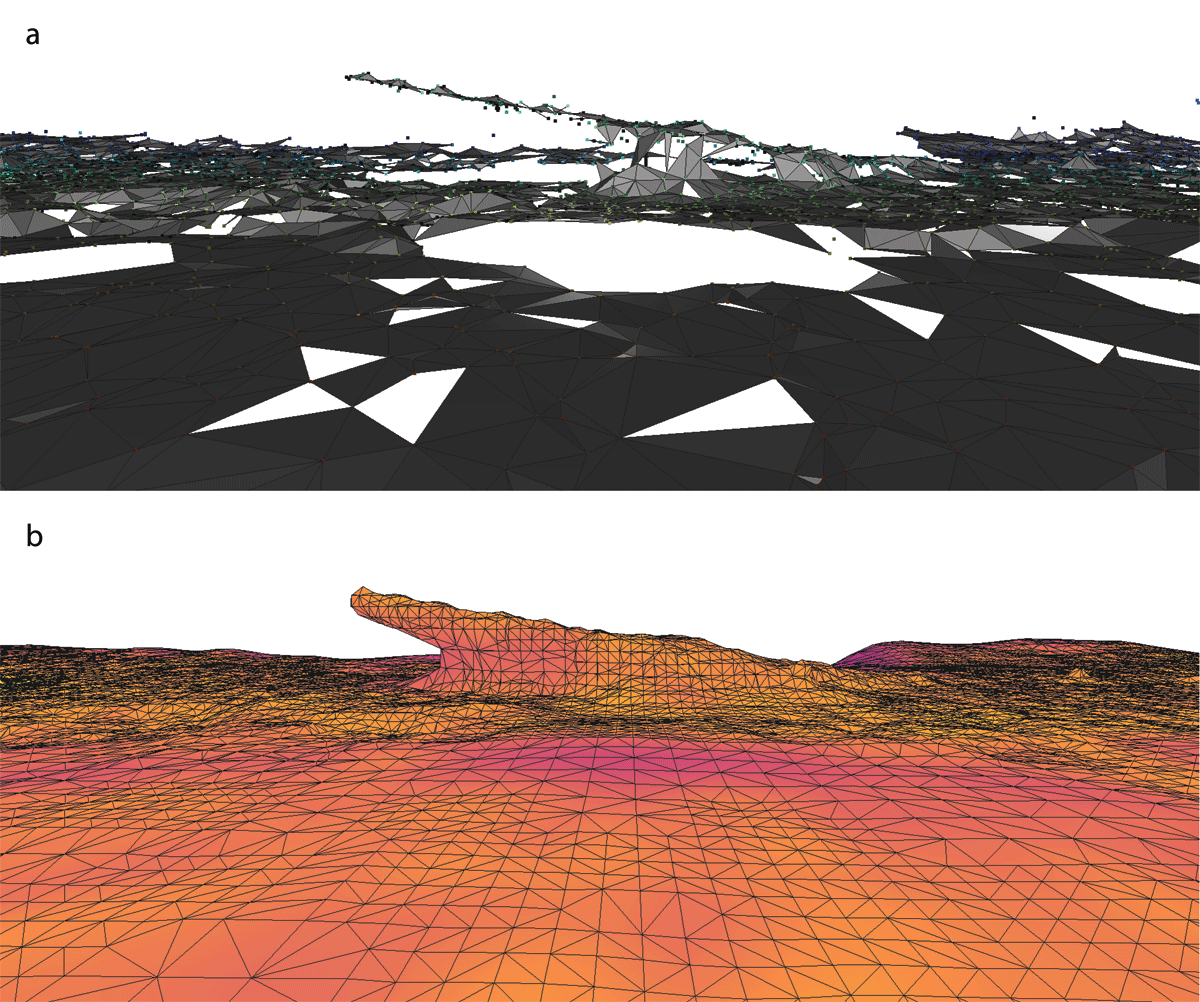
Figure 11
There are 2,159,476 points from the seaplane wreck (Figure 9). 10,000 points were extracted from it. The BPA and the PSR method from Open3D were applied to the extracted point cloud (Zhou et al. 2018). a. Ball Pivoting Algorithm with balls radii 0.5, 0.7, 1.0 meters. All holes indicate lack of information. b. Poisson Surface Reconstruction with the level of detail 9. The reconstruction surface’s colors indicate the lack of information from violet to yellow. Violet indicates the least supported surface patch; yellow indicates the most supported surface patch. We use the plasma color scale from matplotlib (Hunter 2007).
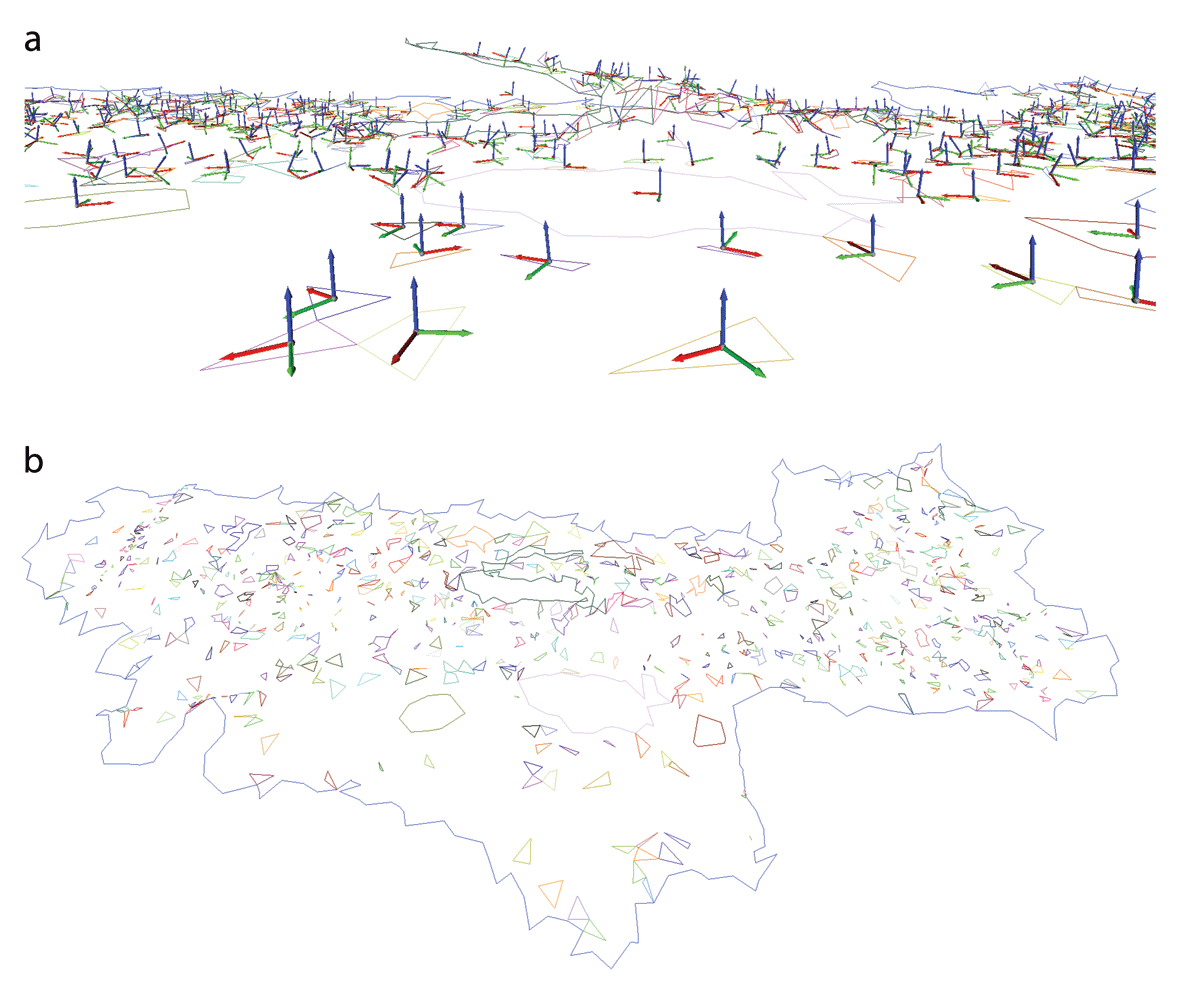
Figure 12
Holes extracted from 11a. a. Holes with mean locations and orientations. b. Overview of all holes and the model boundary.
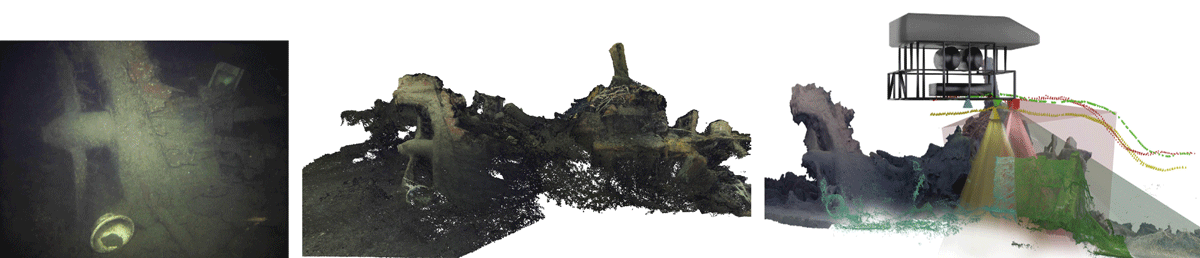
Figure 13
Photogrammetric reconstruction of M/S Helma wreck. Left: Original underwater image. Middle: 3D point cloud. Right: Simulated trajectory of 30K ROV and multi-camera system recording the wreck in Blender.
Table 1
Strengths and weaknesses of the presented 3-phase workflow.
| Strengths: |
|
| Weaknesses: |
|