
1. Introduction
By definition, Underwater Cultural Heritage (UCH) is inaccessible to archaeologists and the public without the application of technological help of some kind. Diving gear can allow human presence on the seabed for a limited time and in shallow waters, and has facilitated the development of marine archaeology as a sub-discipline in that capacity. In areas that are too deep, or otherwise prohibits diving, the use of robots is often the only realistic option available for detecting, investigating, and experiencing underwater cultural heritage.
Although robots do not have the physiological limitations that humans have for being underwater for long durations, in practice time is still an important factor in terms of energy consumption (batteries) or operational costs (expensive surface vessels). Effectiveness is an important benchmark for methodological choices. The increasing capabilities of payload sensors for a variety of platform options, from Remote Operated Vehicles (ROVs) to fully autonomous ones like Autonomous Surface Vehicles (ASVs) and Autonomous Underwater Vehicles (AUVs), smoothen the path for the maritime archaeologist to pick the right tools for the right venture (Ludvigsen & Sørensen 2016; Ødegård et al. 2016a).
For surveying, mapping and investigation of UCH sites, acoustic sensors can provide large area coverage underwater, but lag behind optical sensors in resolution and photorealistic capabilities, two keystones when it comes to archaeological interpretations of a site (Ødegård et al. 2016b). Multiple underwater imaging systems mounted on Unmanned Underwater Vehicles (UUVs), as well as innovative computer vision approaches, offer significant potential in high-resolution data acquisition and mapping outcomes respectively for sites of high spatial and structural diversity (Figure 1).
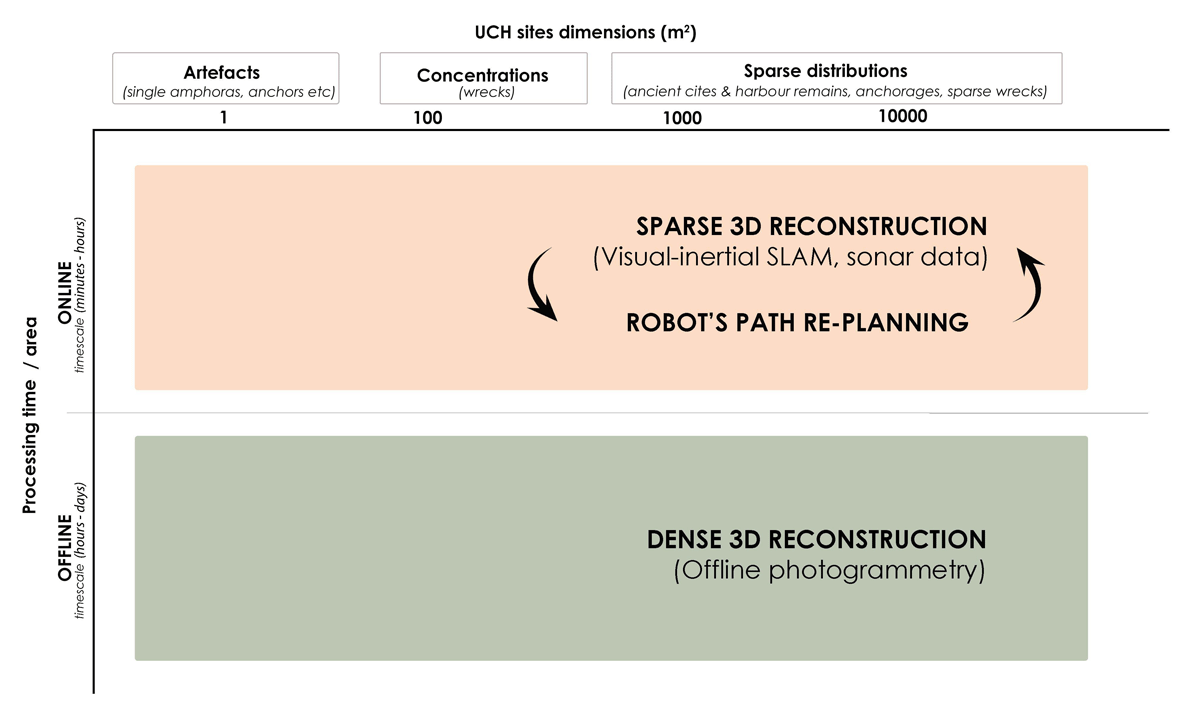
Figure 1
Spatiotemporal graph of the 3D documentation and mapping of underwater archaeological sites of diverse scales and structural complexities via marine robotic operations. (SLAM: Simultaneous localization and mapping).
The effective range of cameras for providing high quality images is limited by the inherent optical properties of the water column (total suspended matter, colored dissolved organic matter and phytoplankton) causing color absorption and backscatter. These limitations can be mitigated by navigating the instrument-carrying platforms close to the objects or areas of interest but would normally require detailed a priori knowledge of the area of operations. Recent literature (Karapetyan et al. 2021; Leonardi et al. 2017; Palomeras et al. 2018; Sheinin & Schechner 2016; Wu et al. 2019) presents promising steps towards intelligent path planning approaches for optimal collection and online assessment of visual data, collision avoidance and operational cost effectiveness in underwater environments.
For remote intervention or even excavation with robots, the operator must have sufficient information for making appropriate decisions for operations. Sensor data, on the other hand, must provide a situational awareness that is sufficient for both scientific and navigational decision making. Maneuvering and operation of a robotic platform must be sufficiently precise and tactile to perform visual scanning in sites of delicate and fragile objects or in cases of high structural complexity like wreck sites.
The main goals of a non-intrusive mission of a wreck site documentation are threefold: to acquire high quality data, to reduce or even eliminate relevant risks for both the vehicle and the site, and to do so through the most cost-effective way. The scientific contribution of the proposed methodology is to address all these three main goals. Given a basic amount of existing a priori knowledge of a site’s environment, our method proposes the first runs of an underwater mapping mission within a simulation environment. Developing and working with synthetic datasets exceeds the cost-effectiveness of real-world missions, as (nearly) all salient parameters of the site’s geometry and prevailing conditions can be parameterized and controlled (Zwilgmeyer et al. 2021). The vehicle’s trajectories, the sensor’s distances, and viewpoints (sensors poses), the desired spatial resolution as well as the environmental conditions (visibility and illumination) can be pre-estimated and simulated precisely (Hodne et al. 2022).
The current work proposes a workflow for the three main phases of an underwater robotic mapping operation on a wreck site: the pre-mission phase, the main mission time and the post-mission phase (Figure 3). Mission planning, real-time evaluation of data acquisition, photogrammetric mapping and interpretation of UCH sites are investigated and implemented through vision-sensing technologies, online and offline. First, the paper provides an overview of the state-of-the-art of marine technologies and algorithmic solutions for underwater archaeological documentation. Next, we present our method through samples of our ongoing research on visual-based mapping of underwater cultural heritage, in both simulation and real-world operations. The main contribution of this paper is the investigation of techniques that optimize photogrammetric data acquisition during a robotic mission at an underwater archaeological or historical site. The branches of this main contribution are:
the emphasis on the importance of simulations before a robotic operation. Multiple sensor configurations (with a focus on optical sensors), the underwater medium’s effects and the robot’s path are first estimated and tuned into a simulation environment, thus significantly reducing the time on site, while increasing operational efficiency and collected data quality.
the real-time evaluation of data, through real-time surface reconstruction and holes detection that ensures full coverage and prevents the need to revisit the site in case of gaps in the data quality.
the investigation of the potential of breakthrough marine technology like the snake robot Eelume for marine archaeological research.
the validation of the proposed three-phase workflow for UCH photogrammetric mapping in real-world experiments.
2. State of the Art in Marine Archaeology
The photogrammetric documentation of underwater archaeological sites via submersibles dates back to the 1960s, when the Yassi Ada Byzantine wreck was surveyed without the necessity for human divers despite its non-restrictive depth of 35 meters (Bass & Rosencrantz 1972). Throughout the late 1980s, Unmanned Underwater Vehicles (UUVs) began to be systematically deployed for the digital recording of marine archaeological sites in the Mediterranean (Ballard et al. 2000; Bingham et al. 2010). Remote Operated Vehicles (ROVs) have exhibited their increased effectiveness in surveying multiple wreck site scenarios the last decades. Their umbilical provides extended, if not unlimited, power supply and seamless data transfer, thus facilitating deep-water surveys and real-time mapping results. Work class ROVs, mainly developed and utilized in offshore industry, are proficiently adopted by the field of marine archaeology, thanks to their high sensors payload capacity. The discovery and surveying of 65 wreck sites in a depth range from 40 to 2,200 meters during the Black Sea MAP project (Pacheco-Ruiz et al. 2019), the surveying of the 170 meters deep 18th century wreck at Ormen Lange in Norway (Soreide & Jasinski 2005, Figure 2) and the photogrammetric mapping of the 330 meters deep Roman shipwreck Cap Benat 4 during the “The ROV 3D” project (Drap et al. 2015) are three indicative examples of the successful use of such advanced offshore technology.
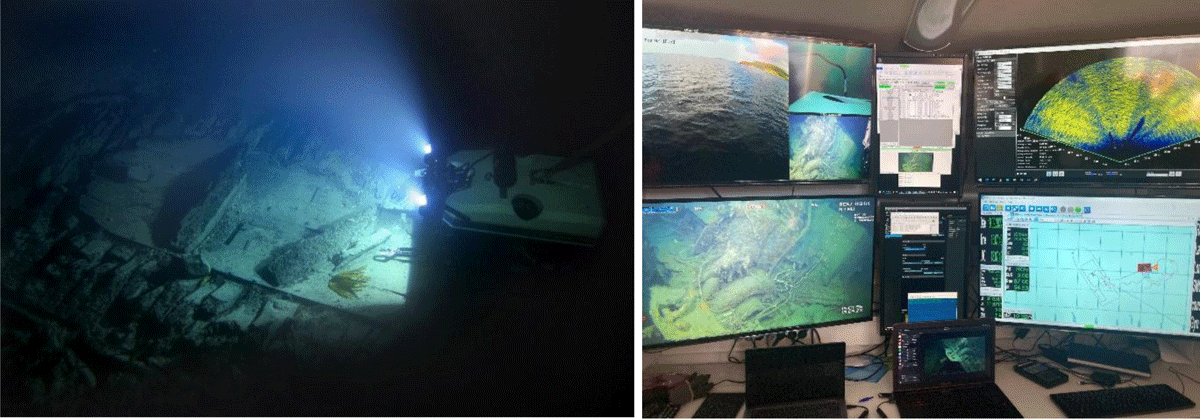
Figure 2
ROV operations in shipwreck environments. Left: ROV Minerva surveying the 18th ct. wreck at Ormen Lange, Norway, 170 m deep (Courtesy of Vitenskapsmuseet, NTNU). Right: ROV control room (Courtesy of AUR-lab, NTNU).
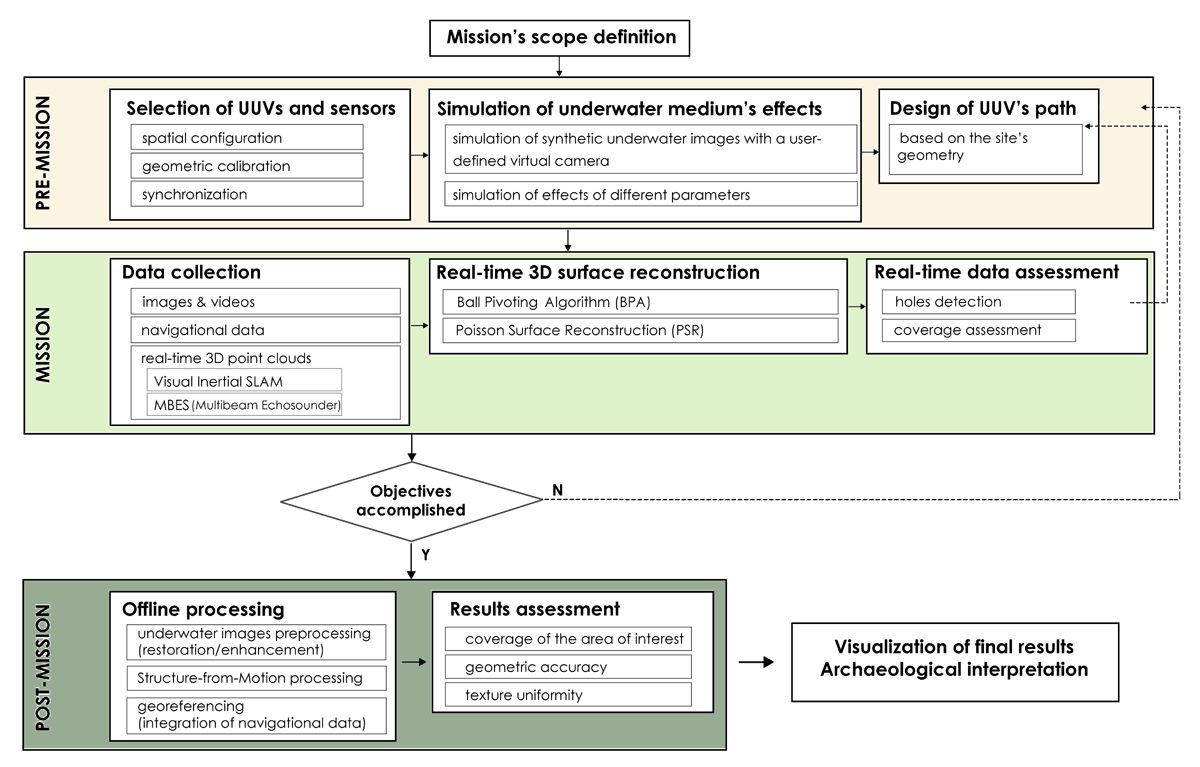
Figure 3
Flowchart of the proposed method: The three phases of an underwater robotic operation for the documentation of UCH sites.
Work class ROVs can be challenging for maneuvering in tight spaces and gives less freedom to bring the instruments and sensors close to objects or areas of interest without risk to both vehicle and UCH. Mini-ROVs (drones) are increasingly demonstrating the same capabilities when it comes to precision in positioning and navigation, and with adequate payload capabilities to carry selected sensors bespoke to purpose.
Recent advances in research on autonomous robotic operations has benefited underwater archaeological projects as well. AUVs, typically underactuated and torpedo-shaped, have been effectively employed for the mapping of diverse sites, like the shallow-waters Bronze Age city of Pavlopetri in Greece (Johnson-Roberson et al. 2017) and the 90 meters deep 17th century shipwreck La Lune in France (Gracias et al. 2013). Due to the absence of direct GPS signal and data transfer, deploying AUVs for optical underwater surveying requires a delicate mission planning for the area of interest, which involves high accuracy navigation and positioning aids. AUVs normally use a combination of acoustic positioning and dead reckoning, using Doppler Velocity Logs (DVL) and Inertial Measurement Units (IMU) for estimating speed and orientation respectively, while in some cases Simultaneous Localization and Mapping (SLAM) techniques are applied (Leonardi et al. 2023). Research in the field of autonomous operations is focused on optimizing visual-based navigation through Visual SLAM (VSLAM) and Visual Odometry (VO) techniques (Williams et al. 2016) and intelligent path planning methods that ensure full coverage of the surveying area (Karapetyan et al. 2021) and collision-free trajectories (Ochoa et al. 2022), even for scenarios of sites without any a priori knowledge of their environment. For shallow waters or coastal UCH sites, ASVs are demonstrated as suitable platforms for documentation and mapping purposes (Vasilijevic et al. 2015).
In the last decade, articulated marine robots with increased kinematic degrees of freedom have been introduced to marine archaeology. The humanoid UUV Ocean One has been deployed on the La Lune wreck (Khatib et al. 2016), while the Eelume snake robot, with its high payload capabilities including multiple optical and acoustical sensors as well as a high accuracy positioning system, exhibits promising potential for its utilization in shipwreck mapping (Liljebäck & Mills 2017).
Underwater LiDAR has started to become popular in recent years. In the work of Akkaynak et al. (2022), they use underwater LiDAR to obtain the depth of the camera scene to restore the color of the underwater scene. This has much potential in obtaining incremental point clouds with high density and accuracy.
In parallel with the marine robotic platforms, significant progress has been showcased on underwater optical sensors. The triptych of a complete underwater imaging system consists of three main components: the camera sensor, the housing interface, and the additional artificial source of illumination. Song et al. (2022) list comprehensively the state of the art in subsea imaging systems with respect to parameters like the depth rating, the port type, and the diagonal field of view (FoV). As underwater photography is progressing, so does the possibility for high-resolution photogrammetric mapping of submerged archaeology. Even low-cost commercial action cameras with embedded Inertial Measurement Units (IMU) offer capabilities for detailed 3D reconstructions through the recording of high-definition videos with synchronized IMU measurements. The port types of housing interfaces are divided into two main categories: the flat ports and the dome ports. Although flat ports are cheaper construction-wise, dome ports’ main concept is to compensate for the refractive geometry of the system “camera-housing” and restore the basic principle of the pinhole camera. The thickness of the housing, especially in cases of housings made for deep waters that tolerate high pressure, needs to be taken into account (Song et al. 2022). Finally, for unbiased 3D measurements, the complicated refractive geometry of an underwater imaging system has to go through an accurate geometric calibration process.
In the following sections of this paper, we use selected case studies of shipwrecks in the Trondheimsfjord, Norway, to demonstrate steps in our proposed method. The cases are from the ongoing multidisciplinary research at NTNU’s Applied Underwater Robotics Laboratory (AUR-Lab):
Tugboat M/S Herkules, which sank in 1957 outside Trondheim’s harbour, laying 50–60 meters deep, of limited archaeological interest, but serves well as a case study for exploring the challenges associated with navigation and mapping of modern and structurally intricate shipwrecks. The medium sized ROV SUB-Fighter 30K (Figure 4) was used for data acquisition in real conditions (Nornes et al. 2015), while the snake robot Eelume was included in a simulation scenario of the photogrammetric scanning of the wreck (Figure 5).
Schooner M/S Helma, which burned down and sank in 1927 off the Skogn coast in the northern part of Trondheimsfjord is a semi-disintegrated wreck site, that lays 55 meters deep. Its wooden parts have been mostly burned away, while parts like the boiler and the engine are better preserved. This wreck also demonstrates a list of challenges in mission planning for a complete photogrammetric documentation, like protruding objects as obstacles or very fine elements for a 3D reconstruction (Diamanti et al. 2021). The medium sized ROV SUB-Fighter 30K (Figure 4) was used for data acquisition in real conditions, while supplementary data were collected by the underwater drone Blueye (Figures 4 and 6).
Seaplane Heinkel He 115 wreck, which sank after an allied air attack in July, 1943, in Ilsvika area, south of the Trondheimsfjord, in a depth range of 35–45 meters, is an easily approachable site with considerable dimensions – 17×22×6 meters- for 3D mapping experiments (Dykking 2023). The snake robot Eelume was deployed for the collection of videos and multibeam data (Figure 9).
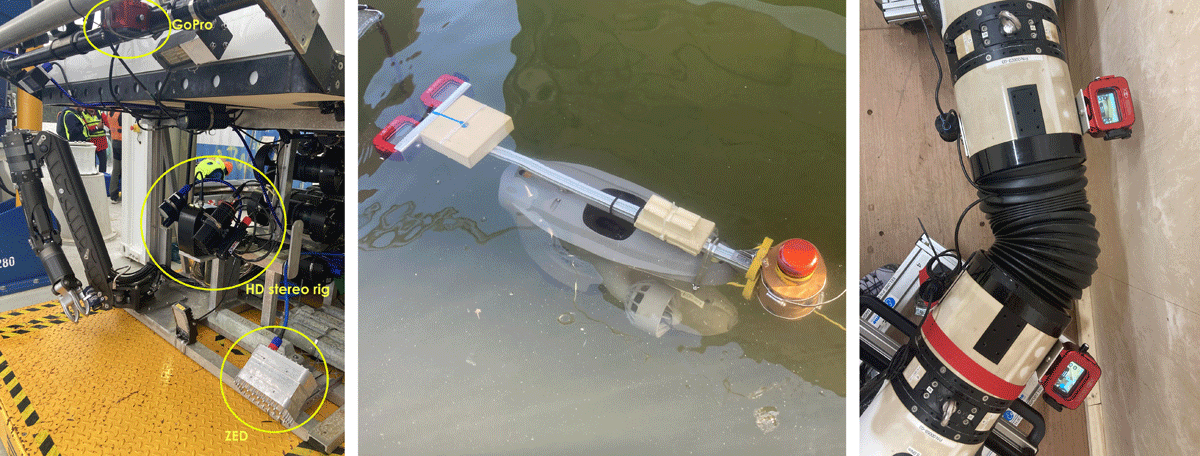
Figure 4
Left: A ZED stereo camera, a stereo rig of HD cameras and a GoPro camera mounted on SUB-Fighter 30K ROV. Middle: A down-looking stereo rig of GoPros mounted on a Blueye ROV. Right: Four GoPros mounted along the snake robot.
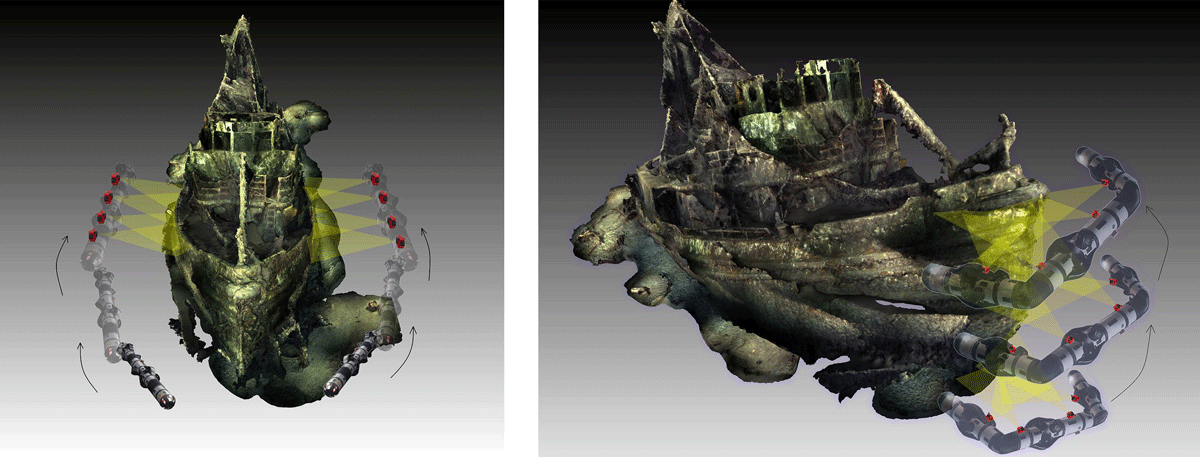
Figure 5
Left: Eelume snake robot scanning the hull of M/S Herkules wreck in a straight pose. Right: Eelume snake robot scanning the bow of M/S Herkules wreck in a U-shape.
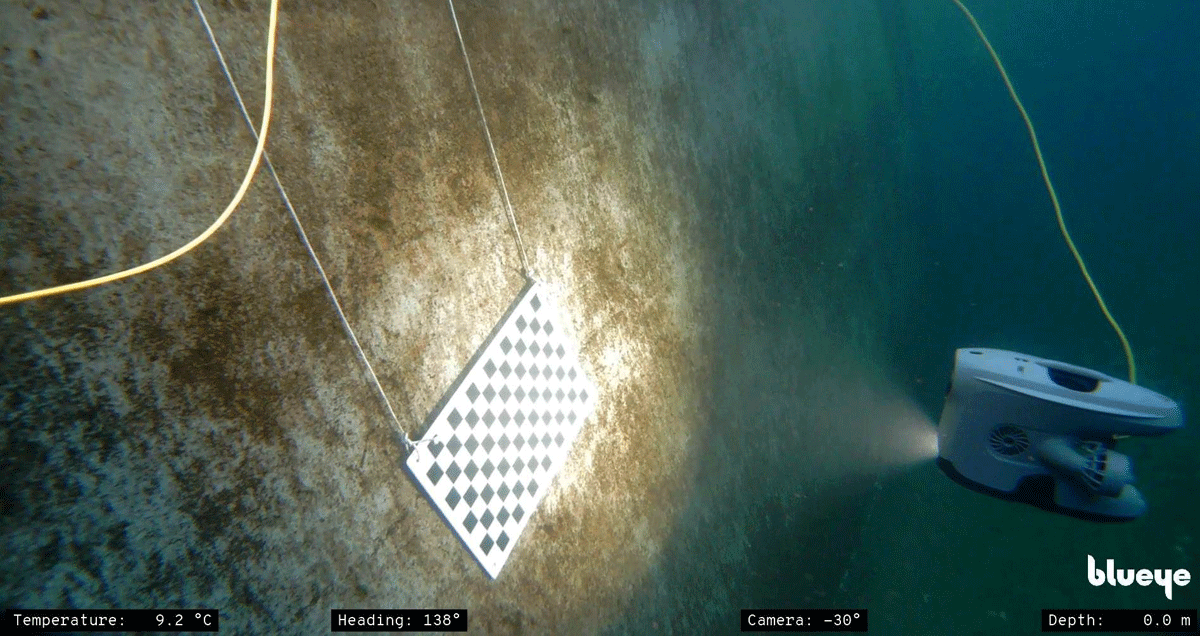
Figure 6
Calibration of the Blueye’s ROV integrated camera.
3. The Proposed Method
The proposed method introduces a mission timeline (Figure 3) that is structured as follows:
First, the planning phase involves:
the definition of the mission’s scope and required results,
the gathering of all a priori knowledge (if any) for the site,
the selection of the most suitable UUVs and sensors,
the configuration and calibration of all sensors,
and the design and tuning of the mission within a simulation environment, where the effects of the inherent optical properties of the water column as well as the robot’s trajectories are simulated.
Second, the mission-time phase involves:
the pre-planned real-world operation,
the real-time data visualization and assessment,
and the real-time readjustment of the path, based on data quality, resolution, and coverage criteria.
Third, the post-mission phase involves:
the post-processing of the collected data, including image preprocessing (image enhancement/ restoration), Structure from Motion processing, scaling and georeferencing,
results evaluation in terms of geometric accuracy and texturing uniformity, based on objective and subjective criteria respectively,
and the visualization and interpretation of the final outcomes.
3.1 Planning a Mission
3.1.1 Defining sensor configurations
For the simulated and real-world experiments of this work, multiple imaging systems were considered for three different sensor-carrying platforms: the light work class ROV SUB-Fighter 30K, which has the highest payload capacity among the three UUVs, the compact Blueye underwater drone and the articulated snake robot Eelume. Three scenarios of multi-camera configurations for visual mapping, one for each vehicle, are presented (Figure 4):
A 45°-down-looking stereo rig of two Allied Vision GC1380C cameras, a 45°-forward-looking ZED depth stereocamera and a down-looking GoPro camera, mounted on the 30K ROV.
A down-looking stereo rig of two GoPros and an integrated HD wide lens camera in the Blueye ROV.
Four GoPro cameras distributed along the modules of the Eelume ROV and two integrated cameras in the snake robot, one forward looking and one down-looking in the middle module.
The concept behind the implementation of multi-camera systems, or multi-vision, facilitates all the basic needs of an underwater mapping mission. First, the extension of the Field of View offers higher potential for full coverage of the site, while it reduces the required movements and maneuvers, and respectively the dive time of the vehicle. Another advantage of the extended viewing frustum is the detection of obstacles to decrease the risk for collisions. Finally, in photogrammetric terms, a network of cameras of known relative locations and orientations, can provide scale to the 3D reconstruction. On the other hand, multi-vision systems, especially underwater, require a lot of planning in the setup of the additional lights, so that a consistency in illumination and color can be achieved. This planning is feasible within a simulation environment, as it is described in the proposed system of the following section. Moreover, the synchronization of all optical sensors within the same system is not always straightforward, referring especially to the sensors which are not connected to the control system of the vehicle, like the action cameras in our case. An example of a multi-camera photogrammetric mission at M/S Herkules wreck is depicted in Figure 5, where two recording scenarios are simulated: on the left, a vertical-sway path with the vehicle in a straight pose and in a 90 degrees roll so that cameras are capturing the hull sides of the ship, and on the right, a vertical-sway path, keeping the 90 degrees roll configuration, but with the vehicle in a U-shape, following the bow’s geometry.
In cases of lack of synchronization, there are a few actions that can be taken so that footage from all sensors can be post-synchronized. One way is flashing the lights in a pattern and the measurement of the median intensity values for high frequency frames for each dataset, while another way can be based on the alignment of the vehicle’s trajectories for each dataset. The second, geometrical way of synchronization, can only be achieved in the first two multi-camera scenarios, where all cameras move as a rigid body in 3D space. For the snake robot scenario, cameras are synchronized roughly by their internal clocks and more accurately by light intensity measurements.
Camera calibration is also an important component of the mission planning (Pre-Mission phase in Figure 3). The cameras’ housings and their customized viewports cause refraction in the light beams and cancel the standard pinhole camera model. For offline photogrammetry, calibration data acquisition is not necessarily required before the main mission, but in cases of accurate real-time reconstructions, the camera intrinsic parameters need to be pre-estimated. For the estimation of each camera’s intrinsic parameters, we follow the typical checkerboard data acquisition (Zhang 2000, Figure 6).
3.1.2 Simulating the underwater medium’s effects
Ocean optics involves a range of complex physical processes. One of the main challenges for realistic imaging is accurately simulating the propagation of light in the underwater environment. This pertains primarily to the effect of volumetric scattering of light, the effect of reflected light from surrounding objects, as well as camera settings. This can be accomplished using 3D modeling and rendering software such as Blender™ (blender.org), which allows for editing input data through nodes. A node in Blender is a collection of data and is used for tuning input data by different parameters to get desired outputs (Zwilgmeyer et al. 2021). This includes nodes with parameters that can be tuned for the simulation of volumetric light scattering. Zwilgmeyer et al. (2021) have created an underwater environment in Blender. This setup was used for simulating underwater conditions for the existing 3D model of the Herkules wreck from Nornes et al. (2015). A real underwater image was also used as a reference to tune the nodes’ parameters of the simulated underwater environment. There are mainly four parameters to tune:
Volume density: Indicates how many particles are in a volume to mimic volumetric scattering.
Scattering direction (anisotropy): Represents the main scattering direction.
Scattering color: Represents the color of the light scattered by the water medium.
Absorption color: Represents the color of the light passing through the water medium.
The 3D model of the Herkules and its reference image was used as an example (Figure 7). The 3D model was imported into Blender, and the Principled Volume node in Blender was used for mimicking volumetric scattering. The Principled Volume node in Blender is commonly used to simulate fog and smoke. The parameters of the node were intentionally tuned in order to make the synthetic image resemble the reference image as closely as possible. Since the Principled Volume node only alters the model’s surroundings to simulate the water medium, it should not have an impact on the 3D model itself. This implies that the tuned node’s parameters should be applicable to the rest of the reference images, even with a different camera location and orientation.
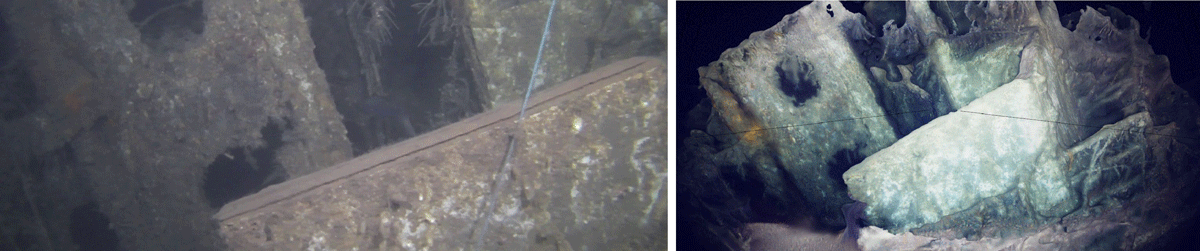
Figure 7
The 3D model was imported into Blender, and the Principled Volume node was used for mimicking volumetric scattering. The parameters were set as follows: scattering color to RGB (0.008, 0.012, 0.264); absorption color to RGB (0.628, 0.628, 0.628); density to 0.1, and anisotropy to 0.9. Left: Real Herkules image sequence serves as the reference image. Right: The 3D model of the wreck is utilized in Blender to simulate underwater images.
Once the simulated image is close enough to the reference image, one can define the whole path of the virtual camera in the simulation software (Pre-mission phase in Figure 3). This will generate a sequence of images with and without the underwater medium’s effect, depth map image, and ground truth of camera location and orientation. This data can be used for verifying path planning algorithms or visual-SLAM algorithms.
3.2 Running a Mission
3.2.1 Real-time 3D point cloud data acquisition
Exploring the possibility of obtaining 3D point clouds incrementally enables qualitative evaluation during robot operation (Mission phase in Figure 3). In addition, several surface reconstruction methods can be applied to 3D point clouds to obtain a surface model.
This section discusses two possible sensor setups to obtain incremental 3D point clouds underwater:
(Stereo-) camera(s) + Artificial light(s) + IMU
Multibeam Echosounder (MBES)
(Stereo) images from (stereo-)camera(s) can be used with/without IMU for performing Visual-inertial SLAM (VISLAM). A VISLAM system processes a sequence of (stereo-)images in real time. It produces a camera trajectory (location and orientation) and a 3D point cloud. The point cloud and camera trajectory are frequently updated during the real-time process. Data association between the images is utilized to compute a new camera location and orientation. The process repeats to build the camera trajectory and point cloud incrementally. IMU data will further increase the robustness of VISLAM. A state-of-the-art VISLAM system, ORB-SLAM3 (Campos et al. 2021), was applied to the underwater sequence of the Herkules wreck (Figure 8b) without available IMU data. This experiment was performed offline, not during a mission; however, ORB-SLAM3 is able to perform real-time processing given a frame rate of 24 frames per second (fps). The ORB-SLAM3 system was able to track the camera trajectory and constantly updated the point cloud during tracking. The system lost tracking after ten minutes in a scene containing mainly vast blue darkness with no distinct features. Dynamic objects, like fish, were mostly ignored by the ORB-SLAM3 system. Figure 8a shows the camera trajectory and point cloud at a given time during tracking. The 3D model of the Herkules shipwreck is shown in Figure 10.
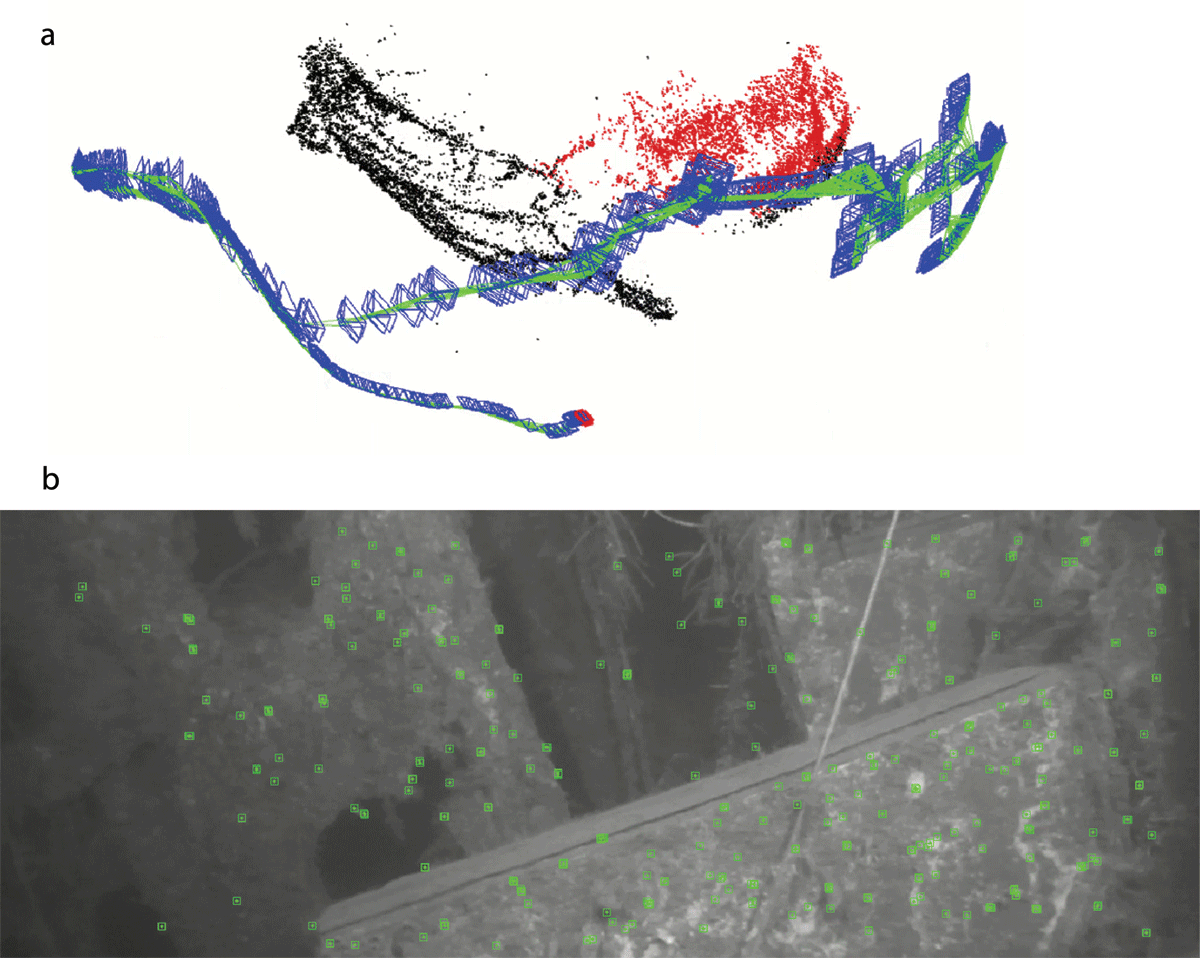
Figure 8
Applying ORB-SLAM3 to real underwater footage of the Herkules wreck without IMU. a. The frequently updated point cloud and trajectory of the monocular camera. b. The green boxes are feature point regions recognized by ORB-SLAM3. Those are used to estimate camera’s location and orientation.
Another way of obtaining a real-time 3D reconstruction that aids the path re-planning is the use of sonar data, like 3D bathymetry data from a multibeam echosounder. This acoustic sensor detects the distance between the sonar sensor and the object by the reflection of acoustic waves. The transmitter sends multiple acoustic waves across a surface per time instance, and the receiver receives the rebound signals. With the navigation data, the point cloud can be georeferenced for each time instance. Figure 9 shows a 3D point cloud of the WWII Heinkel He 115 seaplane wreck generated by MBES. MBES generally generates a much denser point cloud than most Visual SLAM methods in underwater environments.
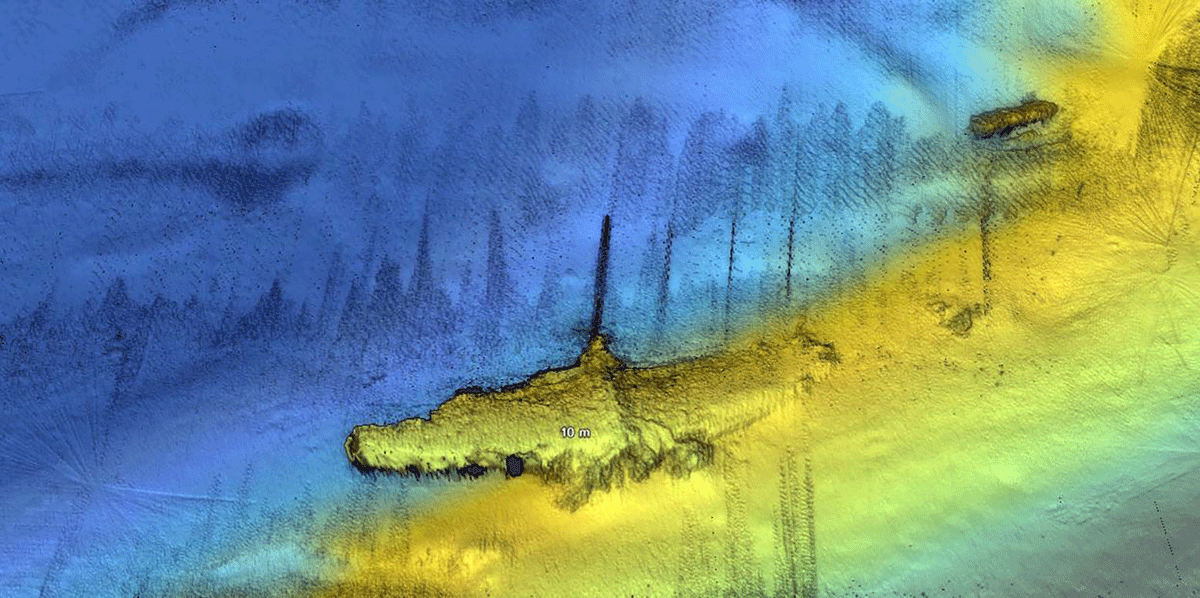
Figure 9
Digital Terrain Model (DTM) built from a point cloud of the WWII airplane wreck obtained by a multibeam echosounder sensor on the Eelume snake robot (Courtesy of Eelume AS).
3.2.2 Real-time surface reconstruction and data assessment
Surface reconstruction methods can be applied during mission time when real-time incremental 3D point cloud data is available (Mission phase in Figure 3). In the field of computer graphics, there are established surface reconstruction methods such as the Poisson Surface Reconstruction (PSR) (Kazhdan et al. 2006) method and the Ball Pivoting Algorithm (BPA) (Bernardini et al. 1999).
PSR reconstructs a watertight surface from the point cloud data. Regions with few or even no points will be reconstructed by interpolation and extrapolation and may therefore not represent the real-world model. This means it can fill holes even in the absence of point cloud data. Points around the local surface can be used for estimating the lacking information. The region of missing information is represented by a darker color; see Figures 10b and 11. In addition, the 3D points do not lie on the surface of the PSR exactly. One can consider the surface as an approximation of the ‘mean’ surface of the point cloud. This property suits well for very noisy data, but not outlier data. In contrast, BPA generates from the point cloud data a surface with missing surface information (holes). These holes can be detected and directly indicate lack of information. Not all points are used for the reconstruction. Points that contribute to the surface lie precisely on the surface itself, as depicted in Figure 10a. This implies that noisy data will have a more significant influence on the surface reconstruction compared to the PSR method.
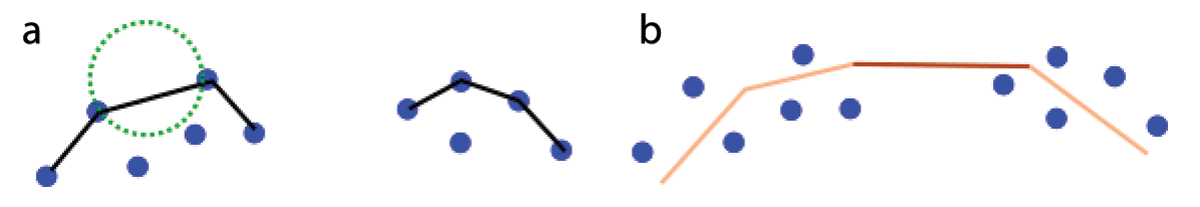
Figure 10
Demonstration of the intuition of BPA and PSR methods. a. BPA: The black lines represent the surface in 3D. The green circle is a ‘2D ball’ used for reconstructing the surface. Notice that there is no line in between because the gap is too big compared to the diameter of the ball. b. PSR: The lines represent the surface in 3D. The light orange line indicates good support from its neighbor points; the dark orange line indicates bad support from its neighbor points. Points do not lie on the surface in general.
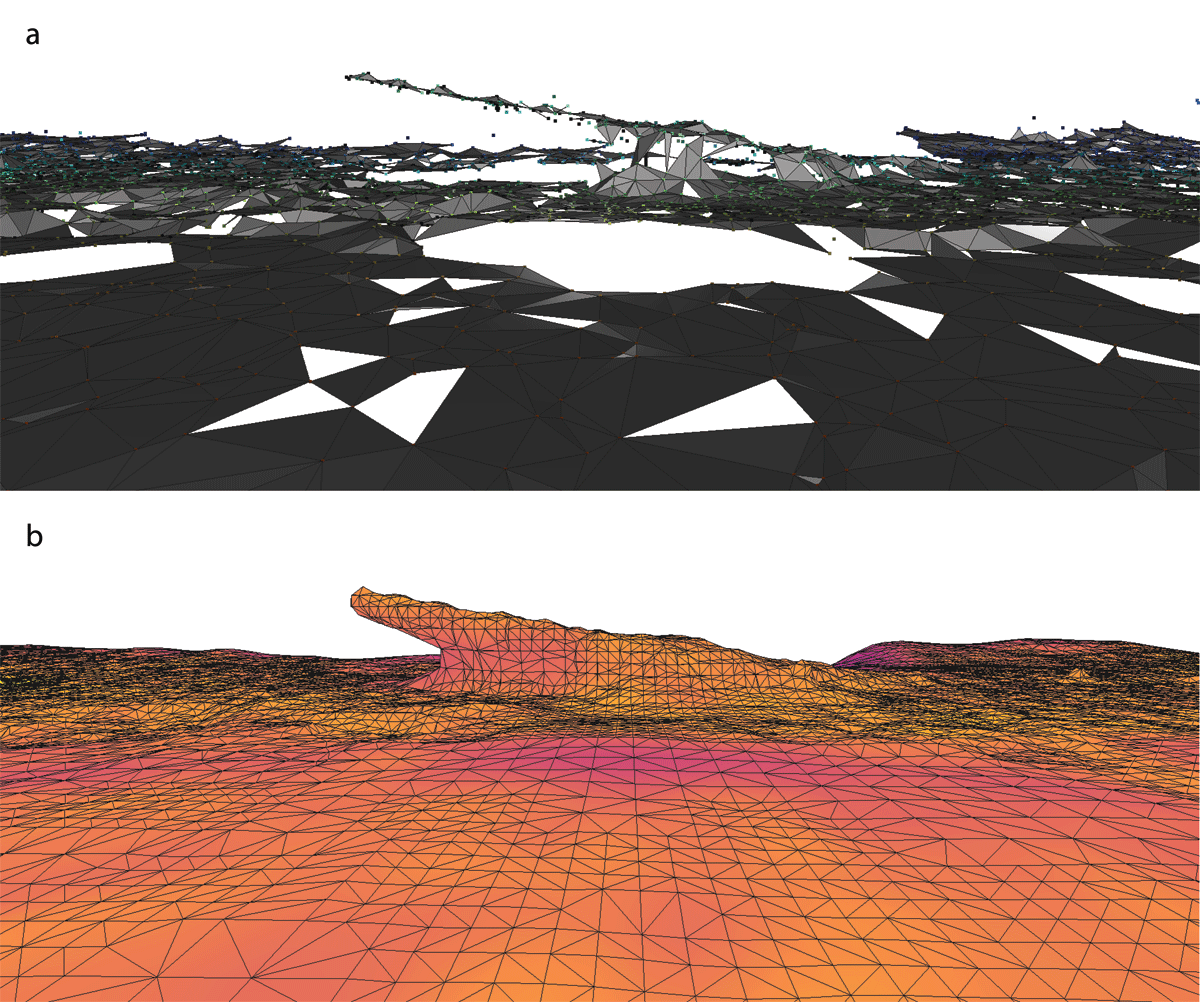
Figure 11
There are 2,159,476 points from the seaplane wreck (Figure 9). 10,000 points were extracted from it. The BPA and the PSR method from Open3D were applied to the extracted point cloud (Zhou et al. 2018). a. Ball Pivoting Algorithm with balls radii 0.5, 0.7, 1.0 meters. All holes indicate lack of information. b. Poisson Surface Reconstruction with the level of detail 9. The reconstruction surface’s colors indicate the lack of information from violet to yellow. Violet indicates the least supported surface patch; yellow indicates the most supported surface patch. We use the plasma color scale from matplotlib (Hunter 2007).
BPA is a conceptually incremental surface reconstruction method. In contrast, Poisson Surface Reconstruction cannot handle incremental point cloud data since the surface is an isocurve of a solution to a Poisson equation. However, it seems PSR can be further developed in an incremental manner, shown by Yu et al. (2019). Both BPA and PSR require normal vectors of the point cloud as input. A normal vector of a point represents the infinitesimal surface orientation near the point. Usually, it is not simple to measure the normal vector of the detected point. However, there is a way to approximate it.
First, calculate the line-of-sight vector from the detected point to the simultaneous sensor. A line-of-sight vector represents the direction from the detected 3D point to the sensor discovering it.
Second, the line-of-sight vectors can be refined by incorporating the information from neighboring points to improve the estimation of normal vectors. Open3D (Zhou, Park & Koltun 2018) provides such functionality.
Based on our experiments, the normal vector estimation gave satisfactory qualitative results due to the initial input of the line-of-sight vector. The estimated normal vectors were good enough to be used by the BPA and the PSR method.
An experiment was performed to apply the BPA and the PSR method to MBES point cloud data; see Figure 11. 10,000 points were randomly selected. BPA generated holes, and PSR generated no holes but different colors of triangle vertices to indicate lack of information. Figure 11a shows holes generated by BPA. Using PSR, regions of missing information (no point cloud data information) in the same region of interest are filled by interpolation and represented by a darker color.
With BPA, all holes can be extracted; Figure 12b shows all the holes extracted from Figure 11. Principal Component Analysis (PCA) can be utilized to determine the hole’s position and dominant orientation. This is presented in Figure 12a with the red, green, and blue arrows with coordinates corresponding to X, Y, and Z, respectively. Since it is possible to obtain the position orientation of holes in real time, the robot can, in theory, autonomously target the hole and gather more information.
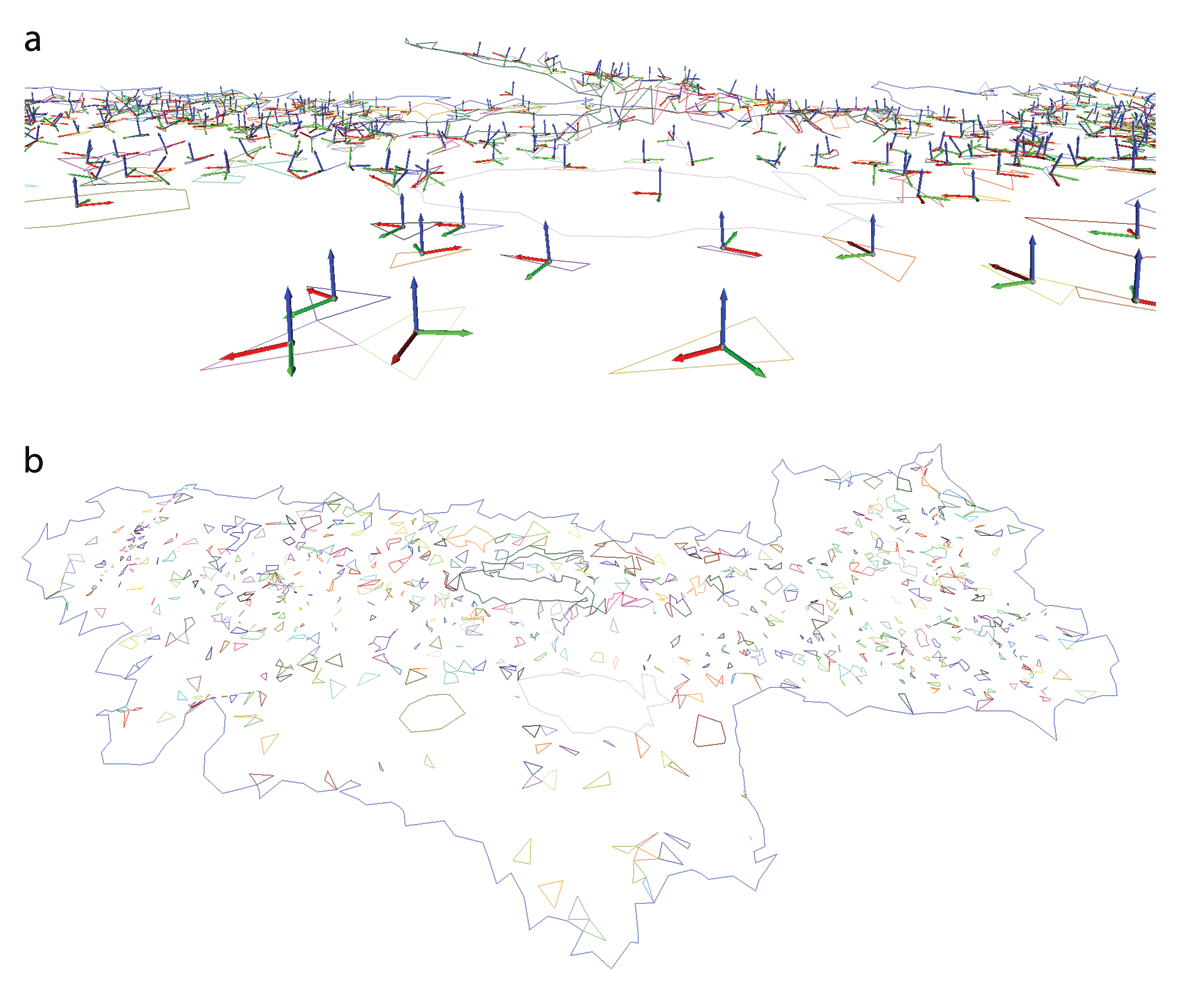
Figure 12
Holes extracted from 11a. a. Holes with mean locations and orientations. b. Overview of all holes and the model boundary.
The PSR method processes two million points in 2.5 seconds. However, when the point cloud accumulates over time during a large-scale mission, PSR will take too much computational time as it processes the entire point cloud at once, whereas BPA considers the local point cloud as it could, in theory, process the point cloud data incrementally. Our main goal here is to show the possibility of performing real-time 3D surface reconstruction and detection of missing surface data (holes) during an online mission. Currently, this approach was tested using simulated data, and it shows promising results. We will transfer it to a real experiment in the future. For the time being, PSR is preferable since we can execute PSR on the research vessel immediately after the first scanning. As illustrated in Figure 11b, this procedure enables us to evaluate the integrity of the triangular mesh generated by PSR. Consequently, it helps identify specific sections of the shipwreck that might need more detailed data collection before the research mission concludes. Regrettably, the ORB-SLAM3 system does not offer an API (Application Programming Interface) for accessing the point cloud, preventing us from conducting BPA and PSR.
3.3 Processing a Mission
3.3.1 Structure from Motion
Once the mission has been completed with respect to the initial documentation’s requirements and real-time evaluation of the quality of the data, offline processing begins (Post-mission phase in Figure 3). Before the initialization of a typical Structure from Motion (SfM) workflow all gathered data need to be filtered for their adequateness for 3D reconstruction. Visual data formats are still images and videos. Videos are pre-programmed to record in a standard frame rate for all cameras (usually at 30 fps), and video frames are extracted through the open-source software ffmpeg (Tomar 2006). Poor quality images (due to backscattering, overexposure, lack of features, etc.) are selected manually and removed. After the synchronization – if needed in the post-processing phase – all imagery data are named after the sequence “operation-platform-sensor-timestamp”.
To ascertain whether image preprocessing is necessary, data are evaluated during the visual inspection process. This assessment is based on both objective and subjective criteria. Typical effects on underwater images like light and color absorption, suspended particles and turbidity are removed or corrected through two main categories of image processing algorithms: the image restoration ones, which refer to the objective criteria and assist the performance of the feature detection and matching algorithms, and the image enhancement ones, for reaching the subjective criteria, improving the visual appearance of the results, and facilitating finally the archaeological interpretation. Comprehensive surveys on underwater image restoration and enhancement techniques can be found in (Song et al. 2022; Yang et al. 2019). Additional effects that are present in underwater archaeological sites are caustics and fish, which are effectively addressed in literature through deep learning approaches and convolutional neural networks, usually as a classification, masking, and removal problem (Forbes et al. 2018; He et al. 2017). For the purposes of our work, we have mainly applied the Contrast Limited Adaptive Histogram Equalization (CLAHE) (Reza 2004) algorithm, an image enhancement technique that is popular for its successful results on underwater data.
Next, the synchronized navigational data are used for the corresponding images as reference data, so that the first alignment of images can be speeded up. The computed intrinsic parameters, namely the perspective projection (focal length fx,fy, the principal point cx,cy and the distortion coefficients), are given for each camera. Concerning SfM software, we use either the open-source COLMAP (Schönberger & Frahm 2016) or the commercial Agisoft Metashape. The first scene graph is created by the extraction and matching of homologous features among overlapping images. This first sparse 3D point cloud is optimized through a global bundle adjustment, taking into account the camera parameters and the precision weights of the navigational measurements.
When the reprojection error of matches reaches the accuracy standards (optimally sub-pixel), a Multi-View Stereo (MVS) algorithm is implemented for the densification of the first point cloud using the computed camera poses as input. The dense 3D reconstruction is then triangulated for the creation of a 3D surface, while the last step is the texturing of the surface by the oriented images, resulting in the final photorealistic 3D model (Figure 13). The open-source MeshLab (Cignoni et al. 2008) is then used for potential further editing of the 3D point cloud and model (noise removal, holes filling, disconnected components removal, etc.) as well as for visualization and measuring purposes.
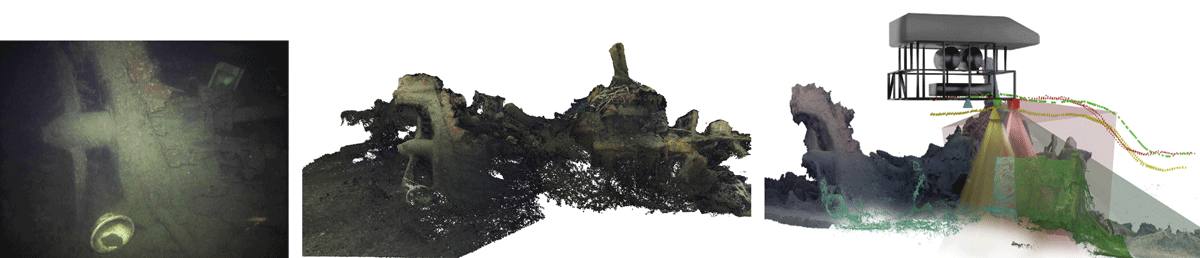
Figure 13
Photogrammetric reconstruction of M/S Helma wreck. Left: Original underwater image. Middle: 3D point cloud. Right: Simulated trajectory of 30K ROV and multi-camera system recording the wreck in Blender.
3.3.2 Accuracy and texturing assessment
One major issue related to the objective accuracy assessment of underwater datasets is the lack of ground truth. In land applications of archaeological 3D documentations, prior to the collection of images for photogrammetry, it is typical to establish a network of control points and then measure it with a Total Station. The accuracy of the surveyed control points then can be 1-2 centimeters and the integration of the land measurements within the global bundle adjustment can yield equally accurate photogrammetric products. Alternatively, it is common to extract control points from models obtained by terrestrial 3D scanners or LiDAR systems with equally high reliability. Underwater, the sources of ground truth are the navigational data, where the accuracy depends on the performance of the underwater positioning system or sonar data, where a post-processing step is also needed in order to define the accuracy of the measurements. Therefore, the reliability of a proposed methodology or imaging system for an underwater application is usually tested in controlled environments like a test tank or a previously well 3D-documented space.
Given that the accuracy of the navigational data is known and correct, it is important to integrate this weighted accuracy in the final bundle adjustment. Pure computer vision SfM software like COLMAP does not offer this option, so we prefer more topographical solutions, like Metashape, for this step of the final global bundle adjustment. Moreover, the impact of refraction on the geometric accuracy of the final reconstruction is apparent in the absence of an accurate camera calibration. Although modern photogrammetric SfM software have built-in parameters for optimizing the lens distortions, the importance of importing a calibrated camera within the processing for accurate reconstruction results remains high. Finally, photometric invariances are usually addressed through the image pre-processing stage, so that seamlines on mosaics and 3D models can be avoided.
Discussion & Future Work
Surveying extended geographic areas for the potential detection and classification of sites of UCH interest via autonomous robotic missions requires a lot of input data from the maritime archaeologist during the initialization phase. Once the mission is launched, a great challenge is to make the underwater vehicle’s visual perception able to re-evaluate the overall assessment process and classification libraries based on new, growing data in mission time.
An early goal for the pioneers in the field was to achieve the same scientific standards for fieldwork underwater as on dry land. Perhaps it is only natural then, that we regard the required technology as tools for doing the same job underwater as we do on land – namely archaeology. However, doing archaeology underwater is different not only regarding tools and methodology in a technical sense. Being underwater, the ability to ponder over an enigmatic structure or discuss a particular feature with colleagues is constrained by limited time and communication bandwidth. The ability to consult notes or literature while on the site is also significantly restricted. Jonathan Adams has reflected on the primacy of the visual, that is characteristic for the practice (Adams 2003). Even our visual perception is distinctly different, as optical properties such as attenuation and turbidity affect the spectral perception and limits our field of view. We can therefore argue that archaeological fieldwork underwater is characterized by a focus on solving tasks through applying methods that are predefined and accepted as best practice, and largely decoupled from analysis and interpretation that are integrated elements in archaeological workflows on land. Not only are the tools different, but our way of doing fieldwork – iterations of reflection and action – is different.
By resolving an archaeological surveying mission into three phases and subsequent steps or processes as shown in Figure 3, we accentuate the operational and very task-based logic that is typical for the robotic domain but also arguably lends itself well to the praxis of underwater archaeology. As the human is gradually removed from the loop, it becomes necessary to define purposes, goals and actions that are perhaps tacit or heuristic for a diving archaeologist into explicit tasks that are executable by machines. In the method proposed in this paper we have adopted a very technical and challenge/solution-oriented view of underwater archaeological fieldwork. While this has helped to showcase our results and demonstrate the potential of the method, we acknowledge that it also entails oversimplifications and sometimes reductive representations of archaeological knowledge production. Table 1 summarizes the strengths and weaknesses of the presented three-phases workflow. The current technological development represents a huge potential for archaeological applications but should be complemented by more attention to theoretical issues that can bridge these new tools and methods to relevant discourses in archaeological research.
Table 1
Strengths and weaknesses of the presented 3-phase workflow.
| Strengths: |
|
| Weaknesses: |
|
The future directions of our research move towards addressing the listed challenges (Table 1) as well as investigating and integrating more vision-aided methods to our system, so that the requirements for active human perception will be decreased and autonomy levels could be increased. We are also exploring the potentialities of multi-imaging configurations on the snake robot Eelume and its implementation in marine archaeological surveys. High degrees of freedom in maneuverability and vision are demonstrated as promising features for efficient photogrammetric reconstructions of UCH sites, while the sensor payload capacity of this robot yield advanced capabilities in multi-sensors (combination of acoustical with optical data, underwater hyperspectral imaging, etc.) mapping and data fusion. Decisions on the survey’s boundaries as well as relevance and levels of importance of detected targets will be potentially made exclusively by robots, pushing notably autonomy limits. The up-to-today fiction idea of surveying, detecting, and documenting an UCH site in the same dive is now highly considered.
5. Conclusions
This paper presents a methodological framework for the visual-based 3D documentation of underwater archaeological sites via marine robotic operations. The proposed techniques deal with the three main phases of an underwater robotic mission, namely the planning phase, the mission-time phase, and the offline processing one. First, we demonstrate how multi-vision sensors configurations and underwater effects on images can be pre-estimated for a mission within a simulation environment. Next, emphasis is given on the real-time assessment of the acquired data, targeting the maximization of the in-situ information gain. According to the proposed method, hole detection on the incremental 3D reconstruction is feasible in mission time, thereby allowing for the online re-planning of the robot’s path, while ensuring full coverage of the site. The method has been developed and tested in a simulation environment and the next step is to validate it in real-world experiments. Finally, an offline photogrammetric workflow is discussed in terms of geometric accuracy and visual appearance of the results.
Acknowledgements
The authors wish to thank the engineers and researchers of NTNU AUR-Lab for their help during marine operations, Eelume AS company for providing the MBES data of the WWII seaplane wreck, MSc architect Georgios Farazis for his contribution in Blender simulations of M/S Helma wreck, and Thea Christophersen for linguistic feedback.
Funding Information
The Research Council of Norway (RCN) is acknowledged as the main sponsor of this work through the Autonomous Robots for Ocean Sustainability (AROS) project (RCN project number 304667) and the RCN-funded Center of Excellence, Autonomous Marine Operations and System (AMOS) (RCN project number 223254).
Competing Interests
The authors have no competing interests to declare.