
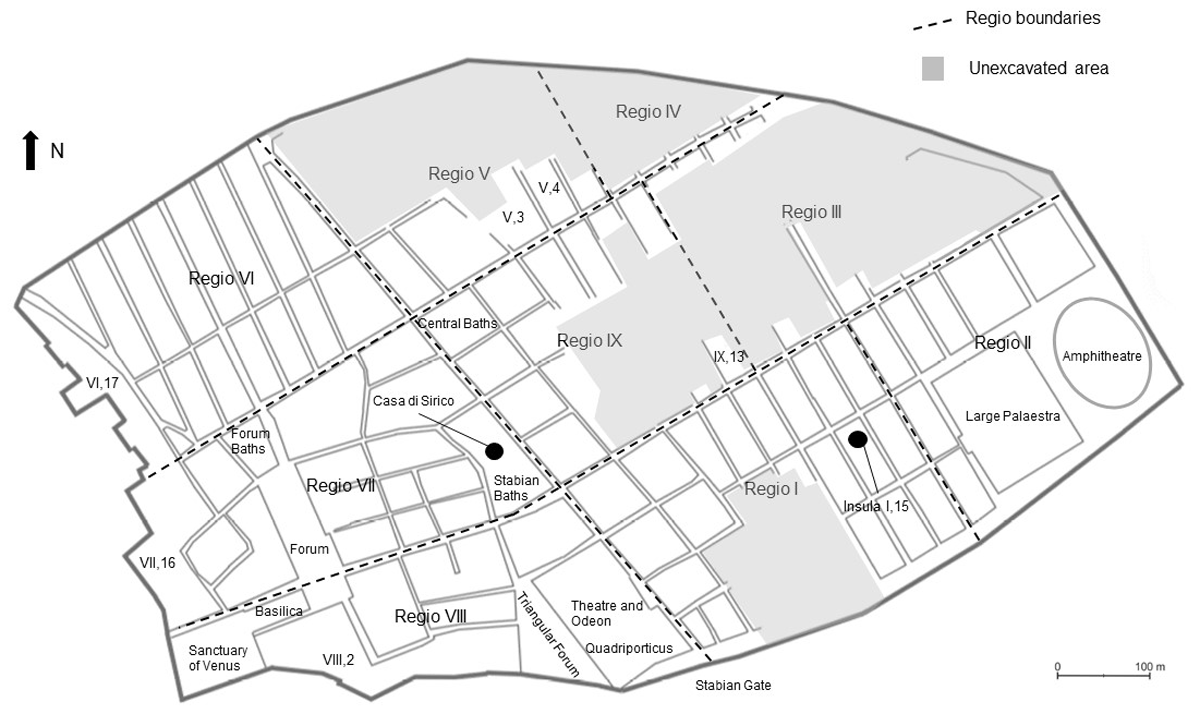
Figure 1
Map of Pompeii. The city is divided into nine Regiones. The city blocks are called insulae and are individually numbered. Each door in a block has its own number (or letter), and thus, for example, the address of the Casa di Sirico is VII,1,25/47 [Regio number, insula number, door number(s)]. The locations of the public buildings and fora are marked on the map. (The map was created by the author on the basis of a map created by Expeditio Pompeiana Universitatis Helsingiensis (EPUH)/Maija Holappa.)
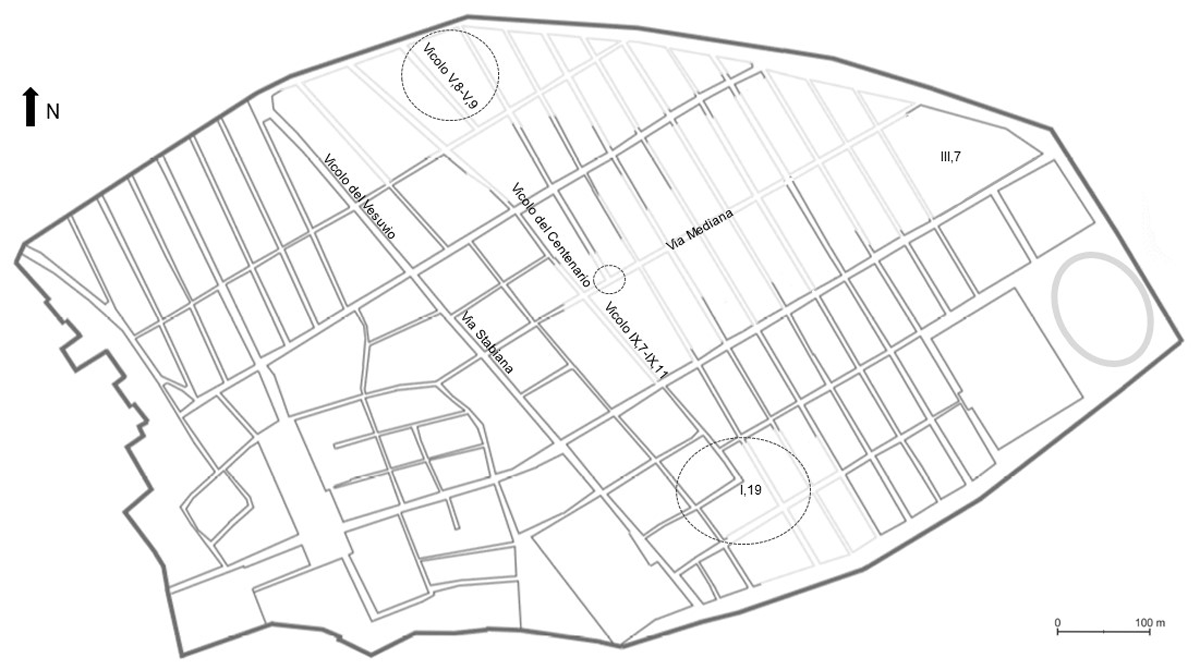
Figure 2
The interpretation of Pompeii’s street network used in this article. Projected streets with lighter grey. (The map was created by the author on the basis of a map created by EPUH/Maija Holappa).
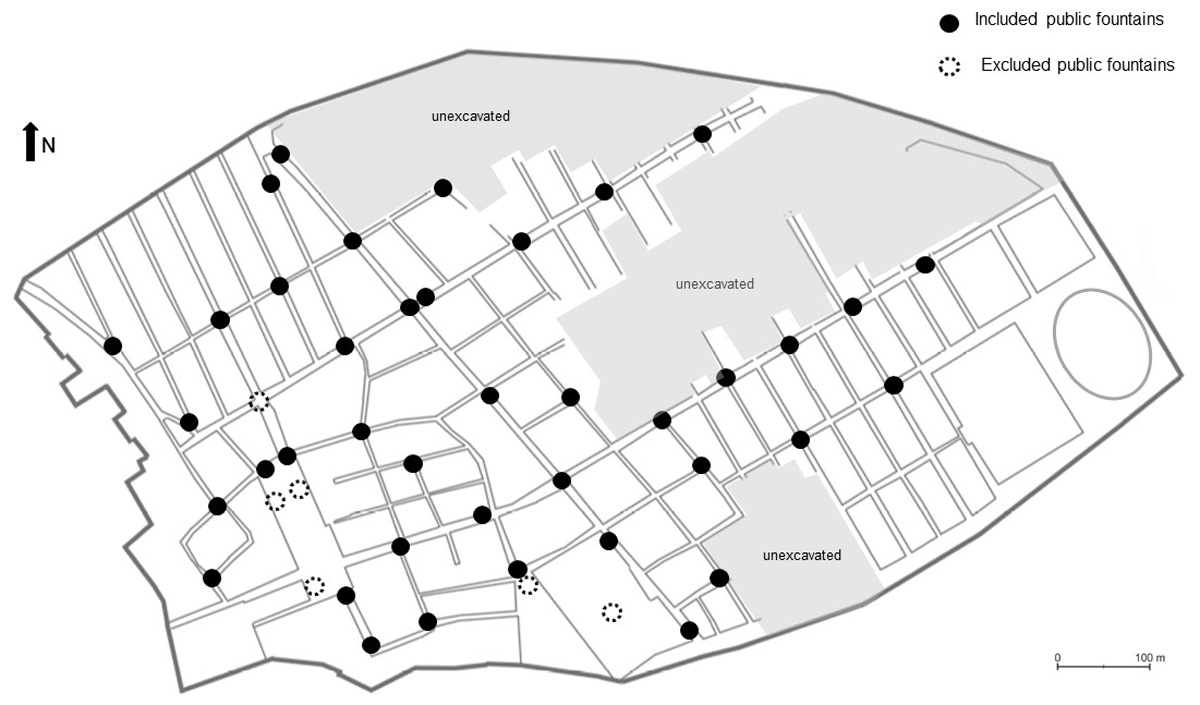
Figure 3
The thus far excavated public fountains of Pompeii according to Notarian (2023a: 88 Fig. 1). (The map was created by the author on the basis of a map created by EPUH/Maija Holappa).
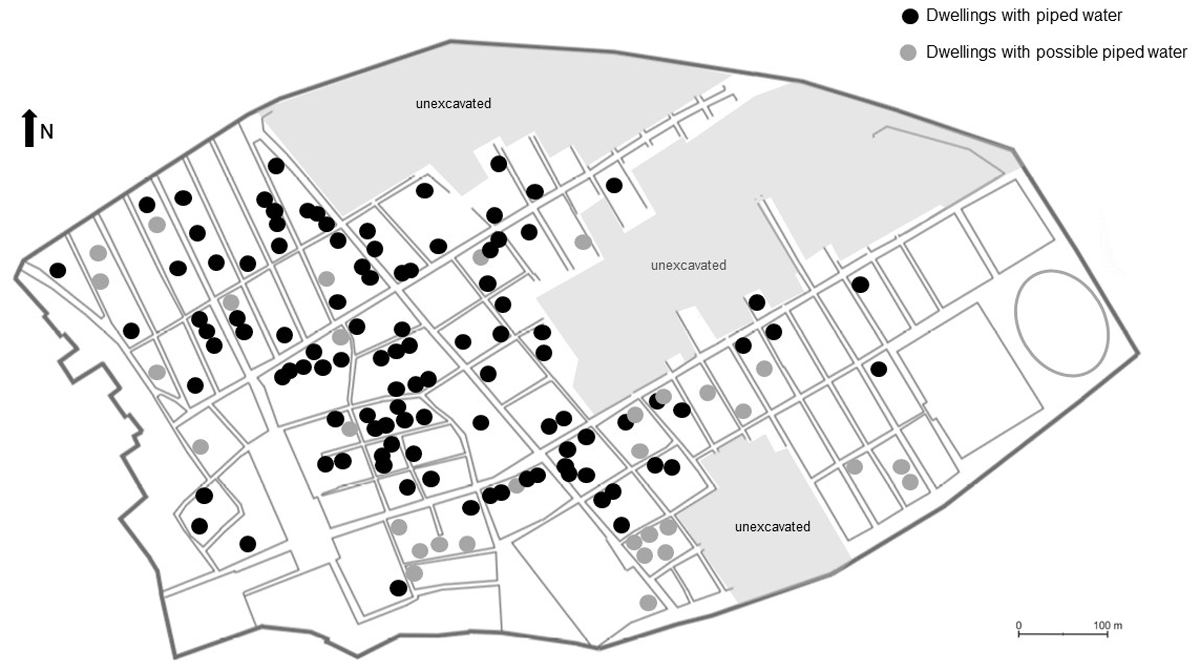
Figure 4
Locations of the houses connected to the piped water. (The map was created by the author on the basis of a map created by EPUH/Maija Holappa).
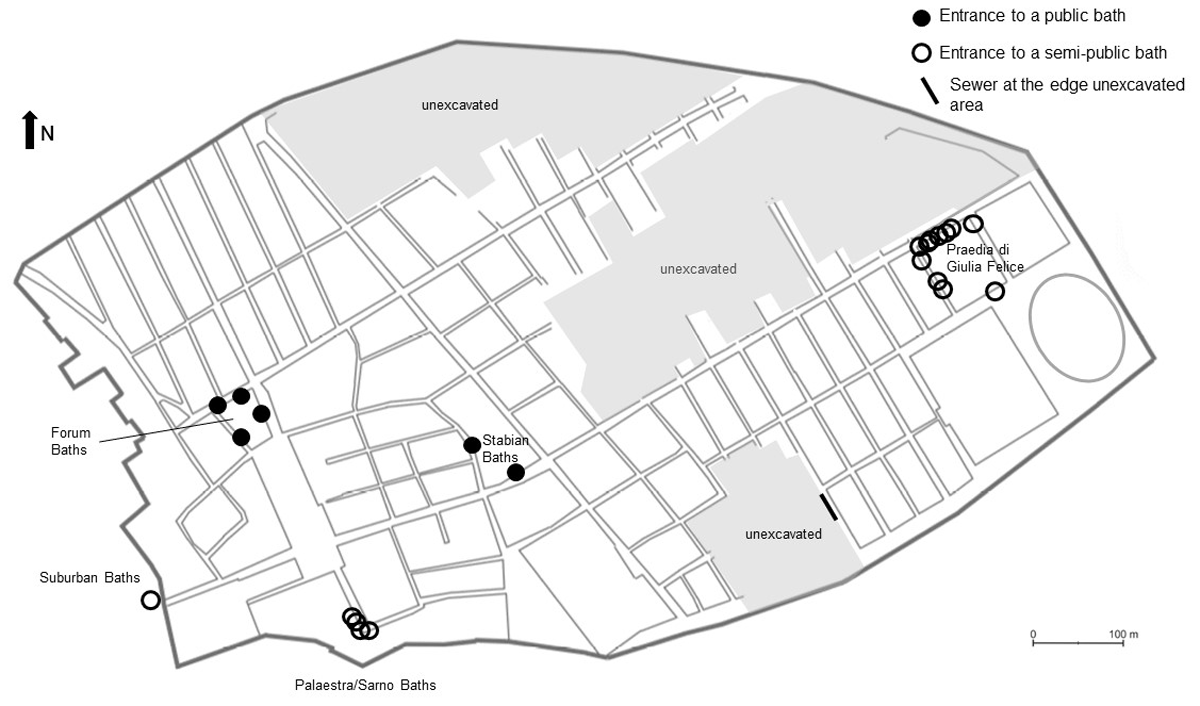
Figure 5
The map with entrances to the Pompeian public and semi-public baths used in this examination. The entrance to the Suburban baths was limited to one, as it is the closest to any dwelling inside the city walls. (The map was created by the author on the basis of a map created by EPUH/Maija Holappa).
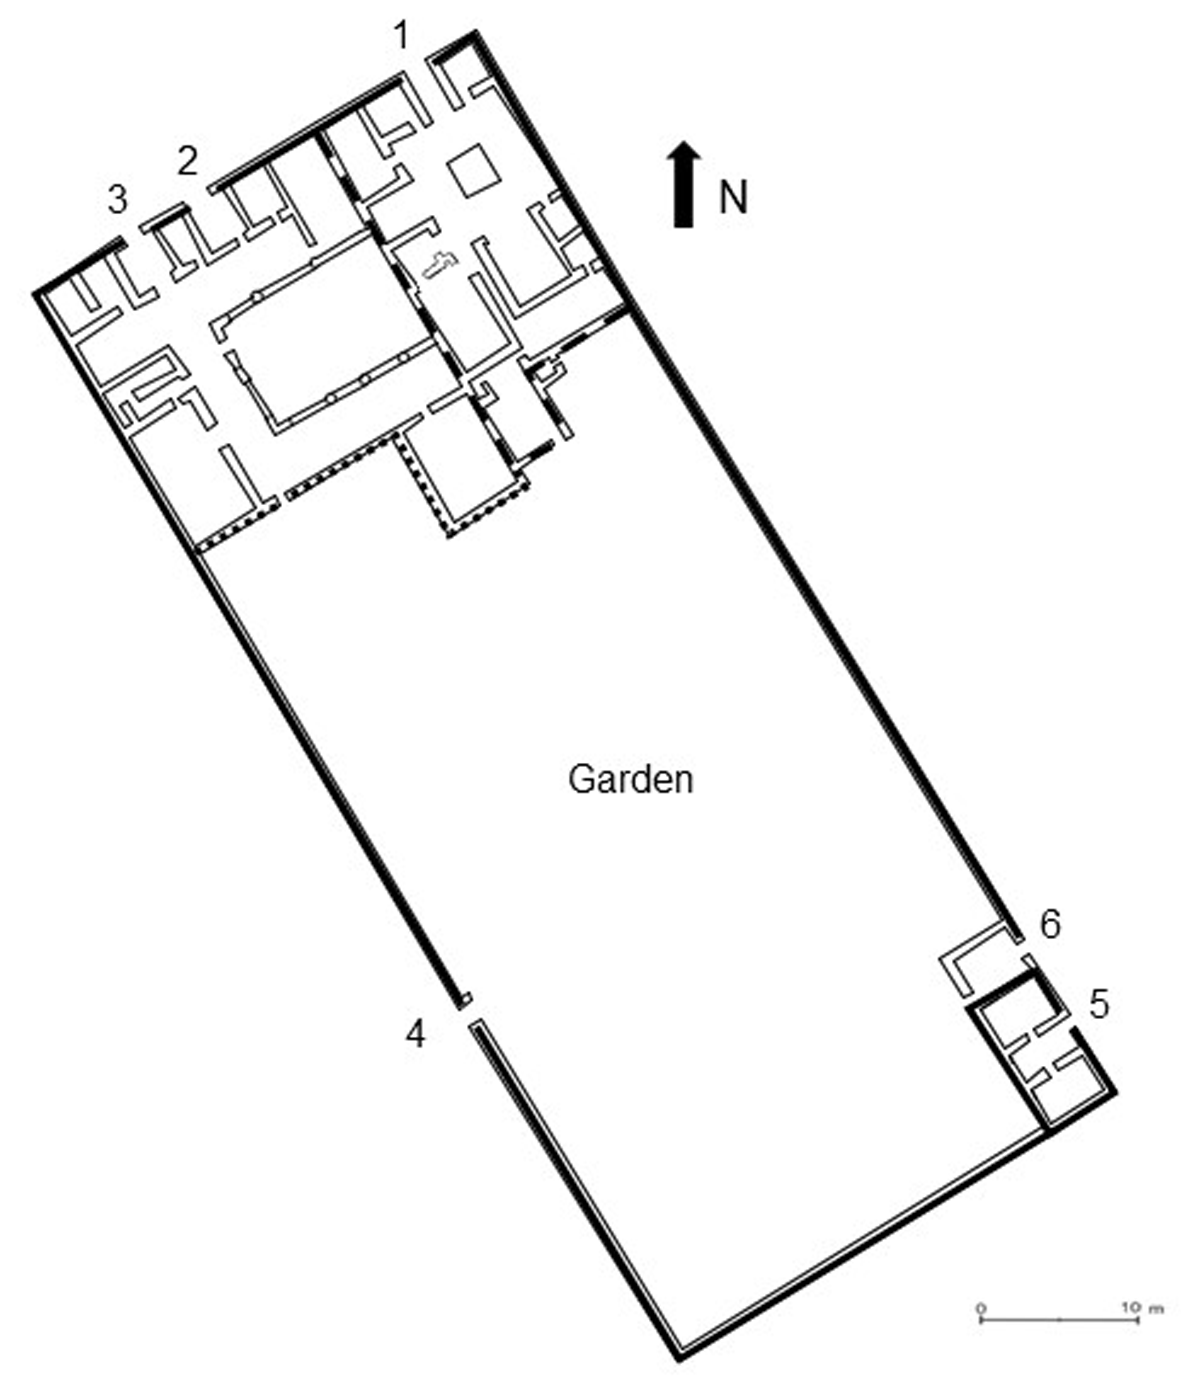
Figure 6
Insula I,15 (location in Figure 1) with several types of lines (solid, dashed, dots) indicating possible separate housing units, yet they can possibly form one large unit. (The plan was created by the author on the basis of a PBMP map, Poehler & Stepanov 2017).
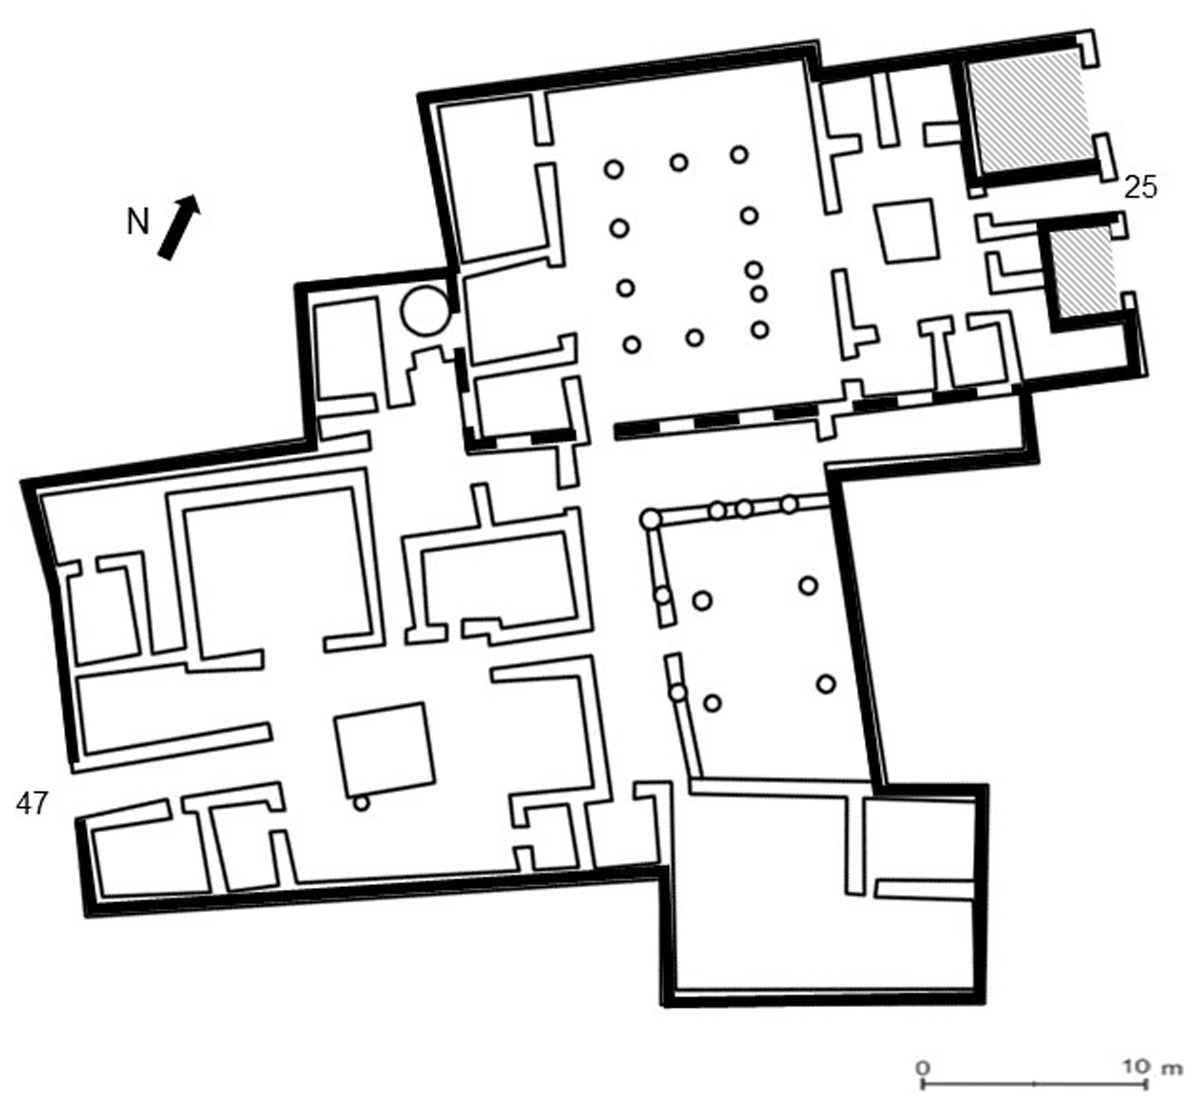
Figure 7
The Casa di Sirico (VII,1,25/47, location in Figure 1) and possible ways to divide it as separate units. The Casa di Sirico is divided into two domestic units (VII,1,25 and VII,1,47), but they can be considered to form only one house. (The plan was created by the author on the basis of a PBMP map, Poehler & Stepanov 2017).
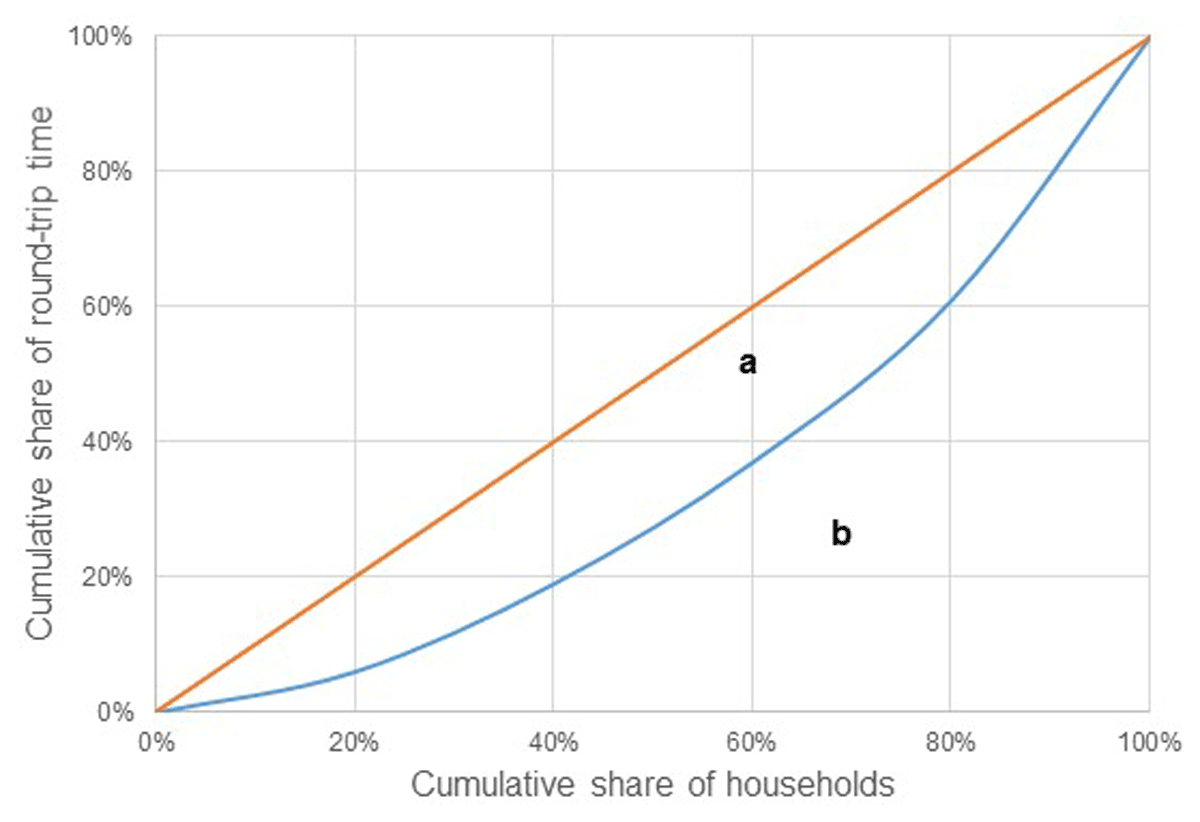
Figure 8
Lorenz curve of round-trip time to nearest fountain from the dwellings. The formula is: Gini = a/(a + b).
Table 1
Various inhabitant scenarios of Pompeii, and times to visit the baths according to these scenarios. (The population estimations are based on Flohr 2017, Osanna 2018 and Simelius 2022b).
| INHABITANTS: POMPEII | INHABITANTS: EXCAVATED AREA | TIMES TO VISIT BATHS PER INHABITANT (EXCAVATED AREA) | TIMES TO VISIT BATHS/INHABITANT (SIMULATED WITH ONE UNEXCAVATED PUBLIC BATH AND TWO SEMI-PUBLIC) |
|---|---|---|---|
| 7500 | 5500 | Once a week | Every 5–7 days |
| 13500 | 8900 | Every 9–12 days | Every 9–13 days |
| 16500 | 10900 | Every 11–15 days | Every 11–15 days |
| 30000 | 19800 | Every 20–27 days | Every 20–28 days |
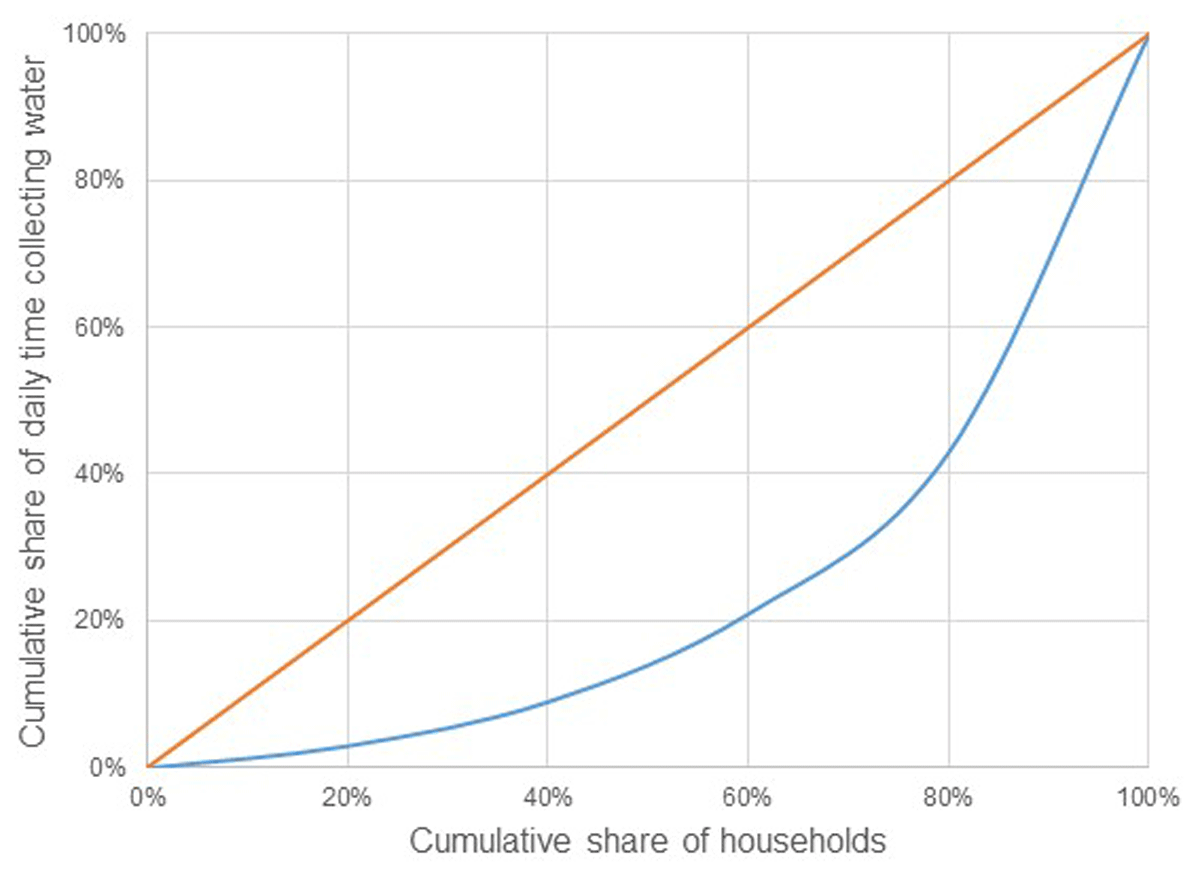
Figure 9
Lorenz curve of daily time collecting water per household, according to Notarian’s (2023b) maximum scenario, 13,500 inhabitants.
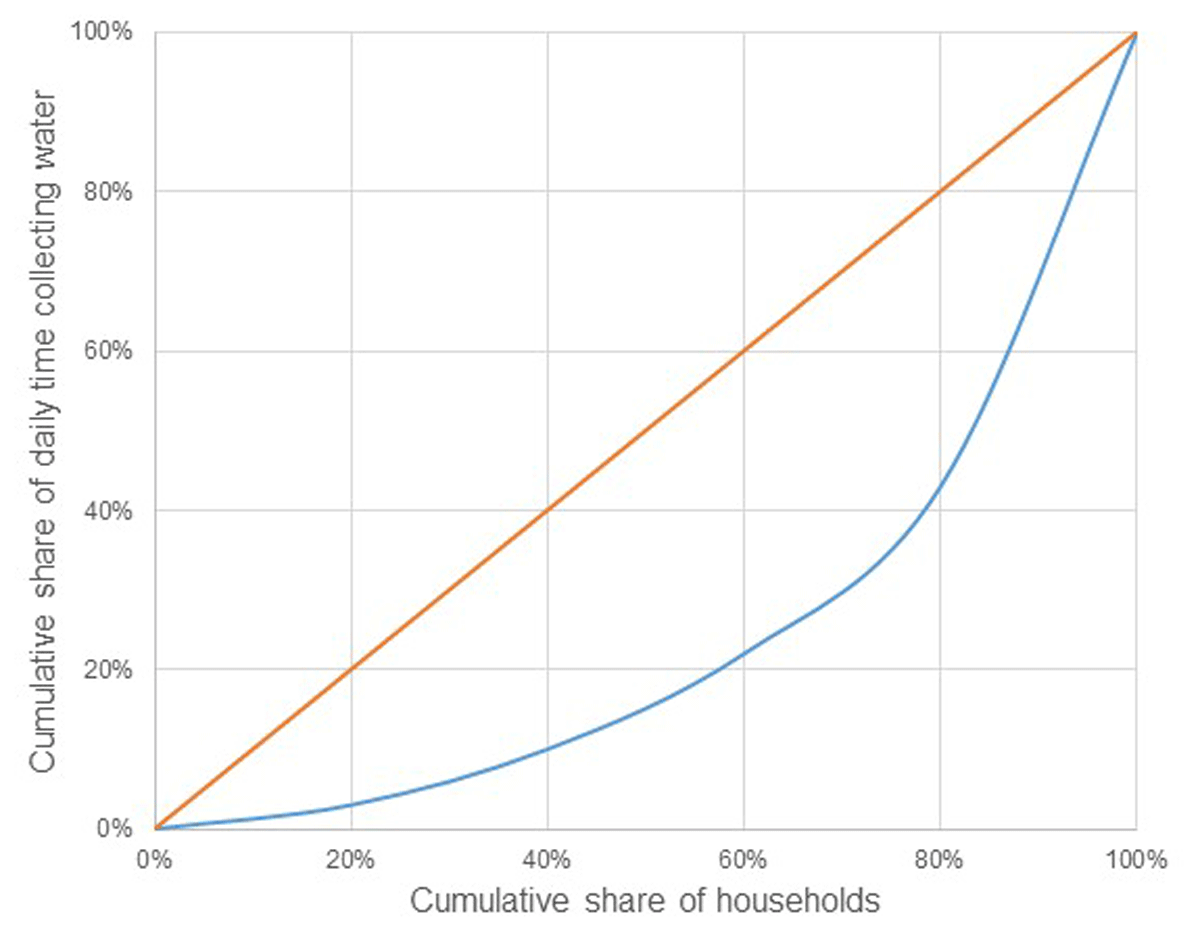
Figure 10
Lorenz curve of daily time collecting water per household, according to the scenario 16,500 inhabitants living in Pompeii.
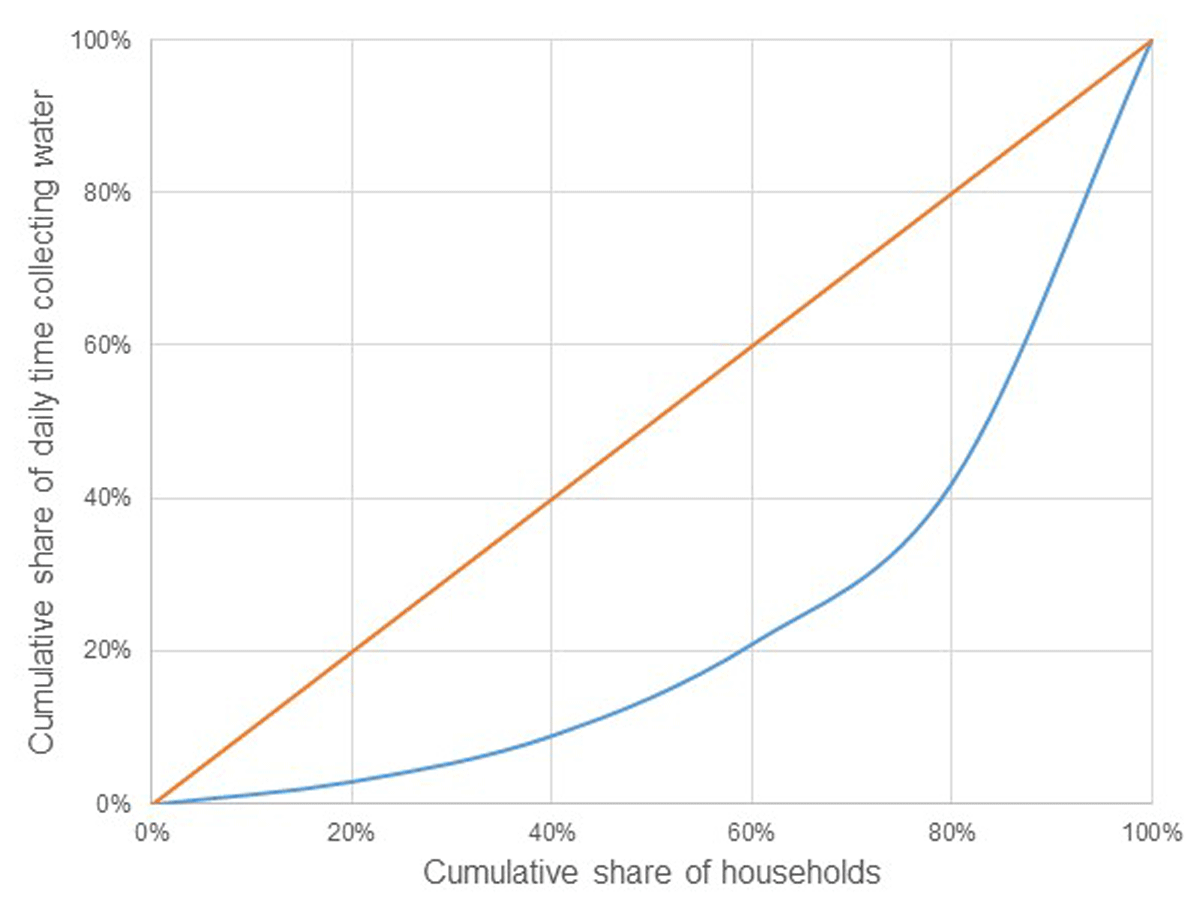
Figure 11
Lorenz curve of daily time collecting water per household, according to the scenario of 30,000 inhabitants living in Pompeii.
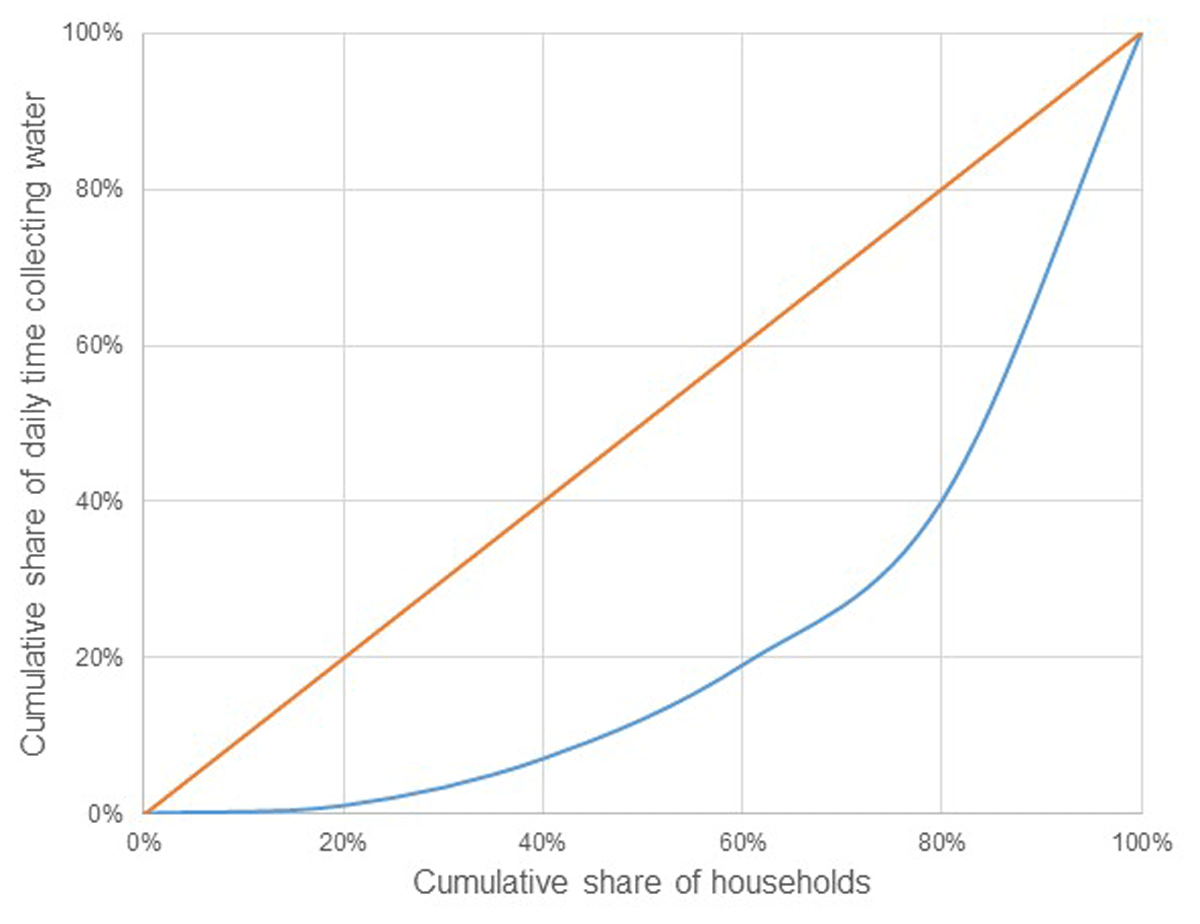
Figure 12
Lorenz curve of daily time collecting water per household, according to the scenario 30,000 inhabitants living in Pompeii and including the piped water network.
Table 2
Various scenarios of calculating time used for fetching water and their Gini coefficients.
| PUBLIC FOUNTAINS | PIPED WATER (MIN.) | PIPED WATER (MAX.) | |
|---|---|---|---|
| One trip Time | 0.331 | ||
| Daily time (Notarian min.) | 0.525 | 0.553 | 0.565 |
| Daily time (Notarian max.) | 0.538 | 0.568 | 0.580 |
| Daily time (16 000 inhabitants/large vessels) | 0.527 | 0.556 | 0.568 |
| Daily time (30 000 inhabitants/small vessel) | 0.538 | 0.566 | 0.578 |
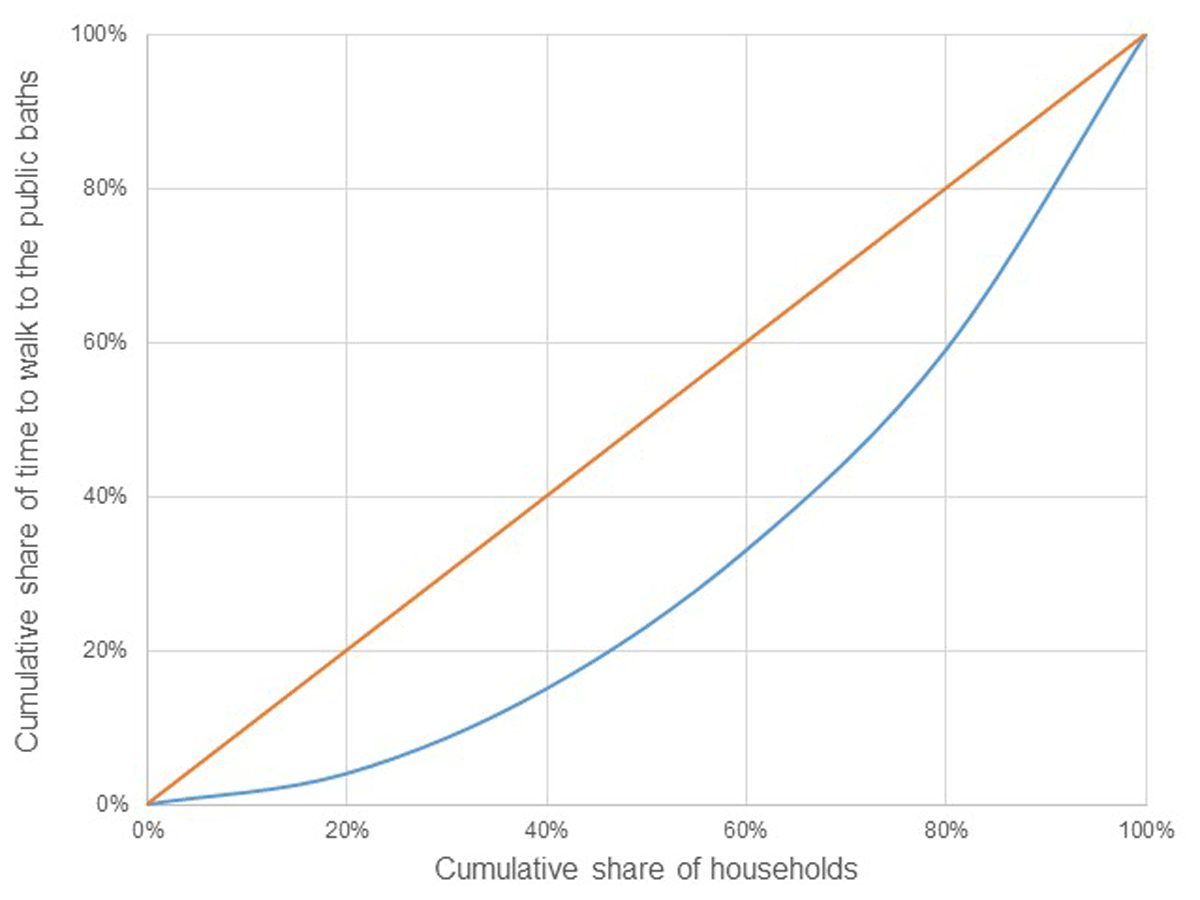
Figure 13
Lorenz curve of time to walk to the public baths per household.
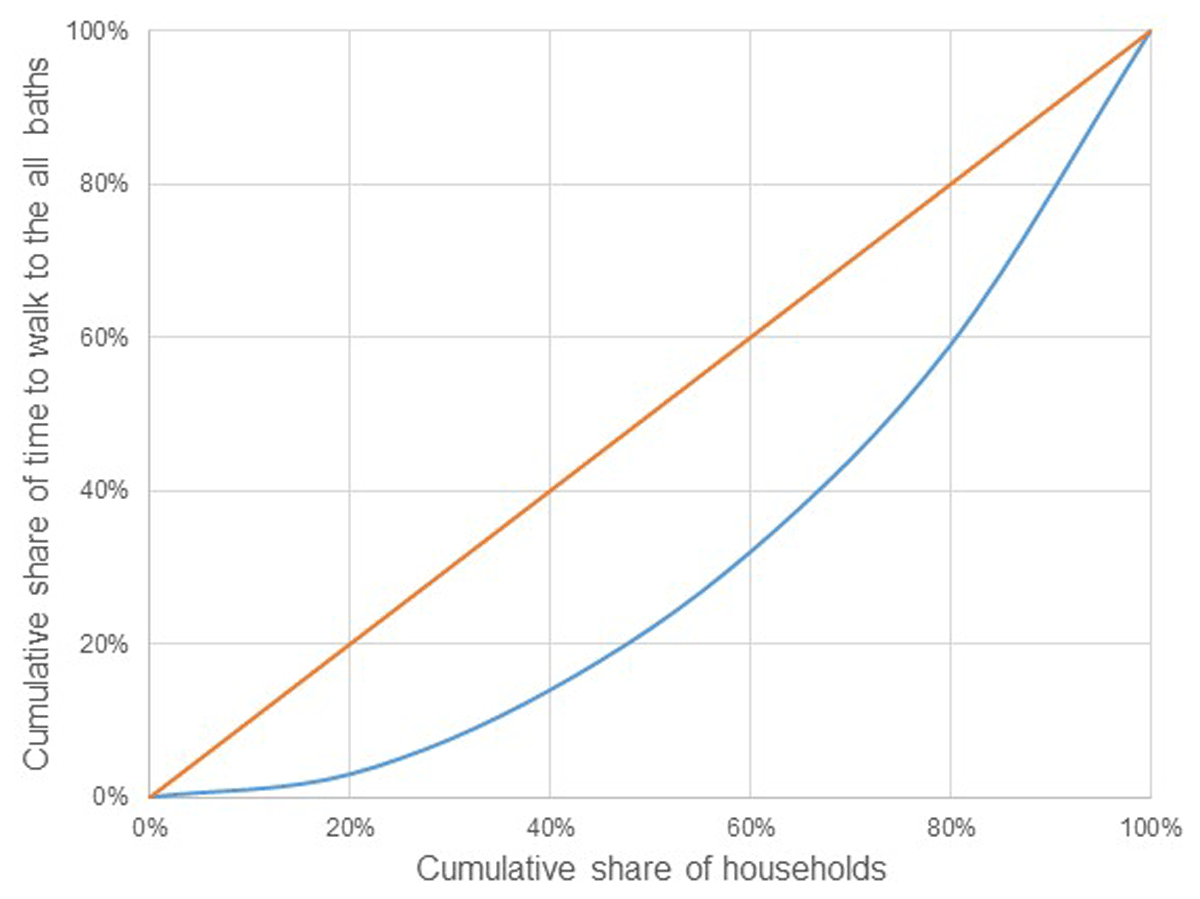
Figure 14
Lorenz curve of time to walk to the baths per household, including the private houses with baths.
Table 3
Various scenarios of calculating walking time from dwellings to the closest bath and their Gini coefficients.
| ONE TRIP TIME | |
|---|---|
| Including only public baths | 0.374 |
| Including also semi-public baths | 0.375 |
| Including also private baths | 0.392 |
| Including only public and private baths (excluding semi-private) | 0.392 |
| Including only public baths (only certain houses) | 0.362 |
| Possible public bath in Regio I (certain houses) | 0.351 |
| Including semi-public baths and a possible bath in Regio I (certain houses) | 0.368 |
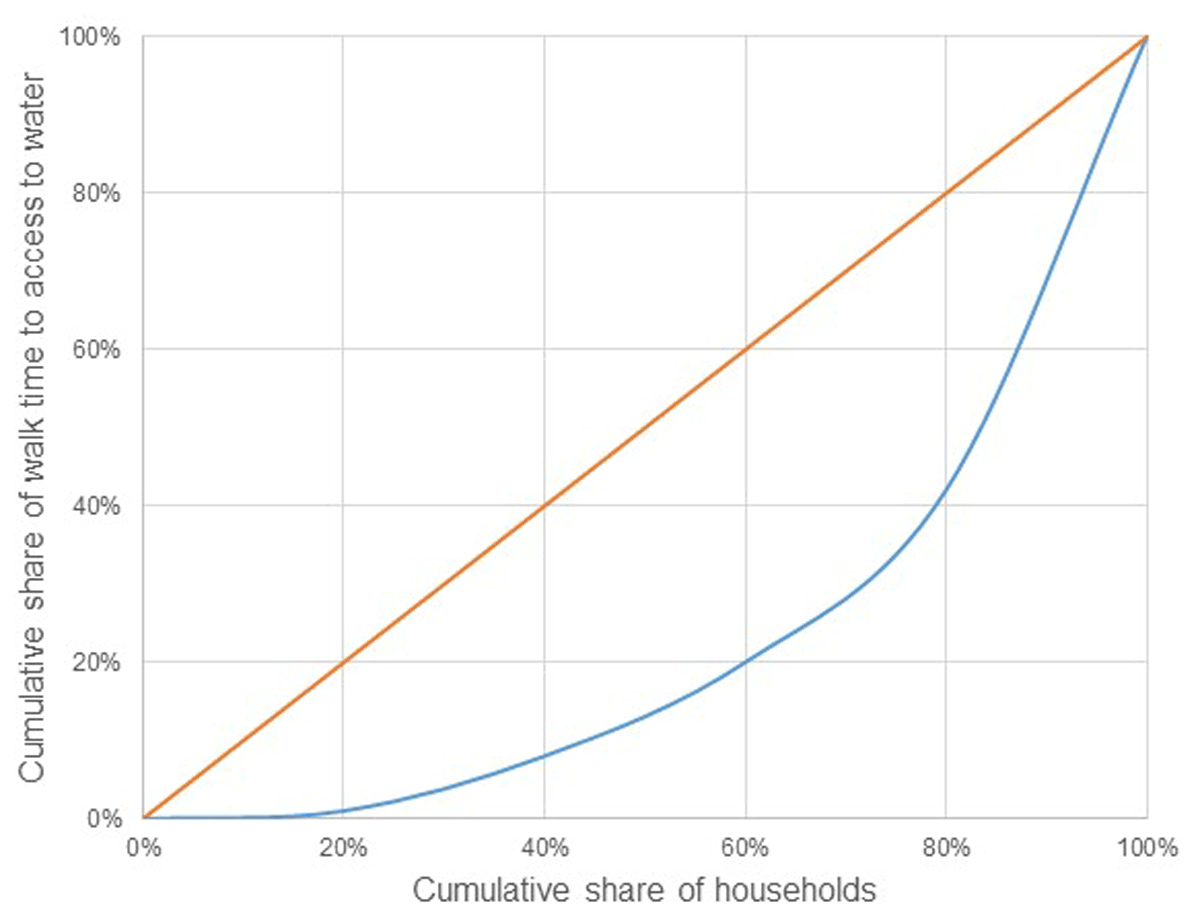
Figure 15
Lorenz curve of weekly walk time relating to access to water, according to the scenario of 16,500 inhabitants in Pompeii.