
1 Introduction
Research on inequality in past societies often focuses on two aspects: social status and wealth. Both are and were important for social stratification, but other factors influenced life as well. The quality of life beyond these two aspects is often neglected when estimating inequality of the past and the methodology to study it has rarely used computational tools. This article investigates how spatial network analysis can be used as a method for studying the inequality of the distribution of access to water, which can be considered to be a key element of the quality of life in the past and in the current day, as is stated in the United Nations’ Vancouver Declaration on Human Settlements (United Nations General Assembly 1976: United Nations Conference on Human Settlements – Habitat I, Vancouver, Canada, 31 May–11 June 1976). At the core of this examination is the water distribution network and the baths of Pompeii, and their spatial connection with private dwellings.
We can assume that all Pompeians had access to water, but to what degree? How difficult was it to gain access to it and how different were the households’ positions in regard to the access? These form the main research questions of this article. The distance to water plays an important role when answering these questions, although that alone perhaps does not provide an accurate estimation. Consequently, adding other variables, such as the estimated need for water per household, the capacity of the vessel used for carrying water, and the visitor capacity of baths, make available a better understanding of the nature of inequality for access to water—and are included in the estimations presented in this article.
Various computer-applied methods, such as using ArcGIS, can provide researchers with multiple data sets of past societies. For instance, counting the most efficient route in the settlements or urban settings has produced many studies about movement (e.g., Wernke 2012; Wernke, Kohut & Traslaviña 2017; Notarian 2023a). Nevertheless, there is a risk that the meaning of these lists of numbers, which often are outcomes of these studies, remain hard to grasp for the intended audiences. What does it mean if the distance between two locations in an ancient city, using the optimal route, was 150 meters or took two minutes? The aim of this article is to investigate if these sets of numbers produced by network analysis can be applied to calculate the Gini coefficient (see Gini 1912) —a statistical scattering within a group—to reveal the inequality in the use of water. This could give them further meaning and add to our understanding of the inequality in ancient societies.
In economics and economic history, income and wealth inequality is regularly calculated using the Gini coefficient. It has also been adopted in archaeology (see e.g., Kohler et al. 2018; Peterson & Drennan 2018; Smith, Kohler & Feinman 2018), in which house size is often used as a proxy for evaluating wealth inequality in past societies. In particular, researchers of the ancient Mediterranean and the pre-Columbian Americas have used it for estimating inequality (e.g. de Callataÿ 2012: 66–67, 72–74; Kron 2014: 128–129; Ober 2010: 258–259; Ober 2015: 89–90; Smith, Kohler & Feinman 2018: 26). The Gini coefficient has also been used to evaluate Pompeian wealth inequality, focusing on house size and architecture, by scholars such as Geoffrey Kron (2014: 129) and Miko Flohr (2017: 75–80). Usually, the Gini calculations have only included the group of people owning dwellings, and thus they excluded the people who did not own houses. Nonetheless, to represent the inequality within the entire society better, the people without a dwelling should be factored into the calculations (Simelius 2022b).
Although the Gini coefficient is most often used to understand economic inequality, it can also be used to measure the inequality of values that represent matters other than property or income. In this article, a key value to estimate inequality is the distance between two locations in Pompeii: from the house door to the fountain and back, or from the house to a bath. Nonetheless, also other values have been added to the calculation as mentioned above. Together they form an estimation to measure access to water.
The idea for this article was inspired by Matthew Notarian (2023) in his recently published article entitled “A Spatial Network Analysis of Water Distribution from Public Fountains in Pompeii” in the American Journal of Archaeology. It was the first substantial attempt to estimate the distribution of water in Pompeii, and it inspired me to think that the distance could be used in a similar way as the house size to estimate the health inequality in Pompeii. So far there has been no universal value that can make it possible to investigate and compare health inequality between different areas and eras. This article tests if the Gini coefficient of distance between a dwelling and water infrastructure—as one aspect among the other factors—could be such a value. In regards of the Pompeian baths, research of inequality has not been executed before, but the baths of Pompeii have generated much scholarly interest, and the work of the scholars such as Ann Koloski-Ostrow and Nathalie de Haan have created important background for this study. In addition to public infrastructure, I took into consideration the private baths and piped water leading to the houses, which were excluded by Notarian.
2 Sources and Methodology
2.1 Sources
The main source for this article is the archaeological site of Roman Pompeii. It has been extensively excavated: only about one quarter of the entire area inside the city walls still remains unexcavated (Figure 1, see also Simelius 2022a: 23–24). However, large areas outside the city walls are unexcavated. Lately, the importance of Roman and Pompeian suburbs has been reconsidered (Emmerson 2020; Zanella 2021), and they likely had an influence on the matter in hand, but the understanding of this area is still too scarce to be included, therefore the analysis has been restricted to the intramural area of the city. There are four important urban features to understand water inequality: the street network of the city, the distribution network of water, the baths, and the private dwellings.
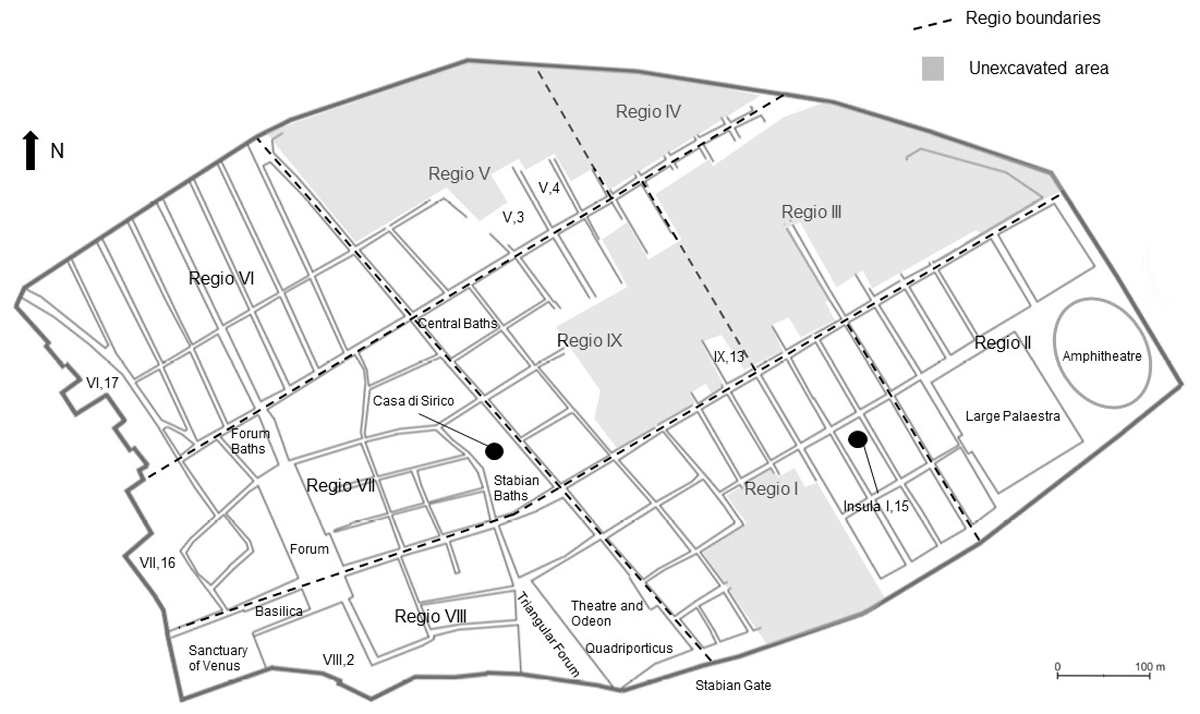
Figure 1
Map of Pompeii. The city is divided into nine Regiones. The city blocks are called insulae and are individually numbered. Each door in a block has its own number (or letter), and thus, for example, the address of the Casa di Sirico is VII,1,25/47 [Regio number, insula number, door number(s)]. The locations of the public buildings and fora are marked on the map. (The map was created by the author on the basis of a map created by Expeditio Pompeiana Universitatis Helsingiensis (EPUH)/Maija Holappa.)
2.1.1 Street network of Pompeii
Most of Pompeii’s street network is known. Nonetheless, in the unexcavated areas we must rely on deduction about what the streets were like in those areas. I generally followed Eric Poehler and his research teams’ understanding of Pompeii’s streets (Pompeii Bibliography and Mapping Project’s map is published online: Poehler & Stepanov 2017, see also Poehler 2017a: 181 Fig. 6.7; 2017b: 49–52, the project is referred as PBMP from now on). Their network is similar to other interpretations reconstructing the entire city in 79 C.E. (see e.g., Giglio 2017: 22; Weilguni 2011: 62–63). In general, the projection of unexcavated streets is based on the relative symmetry and rectangular shape of the insulae, and as Marina Weilguni (2011: 62) had stated, the assumption is that streets always continue as straight lines, unless there is evidence to contradict this. On the east side of the Via Stabiana-Vicolo del Vesuvio (Figure 2), thus far excavated streets and insulae mostly follow this pattern, and a few projections in parts of Regiones III and IX have been confirmed by ground penetrating radar research (Anniboletti, Befani & Boila 2009).
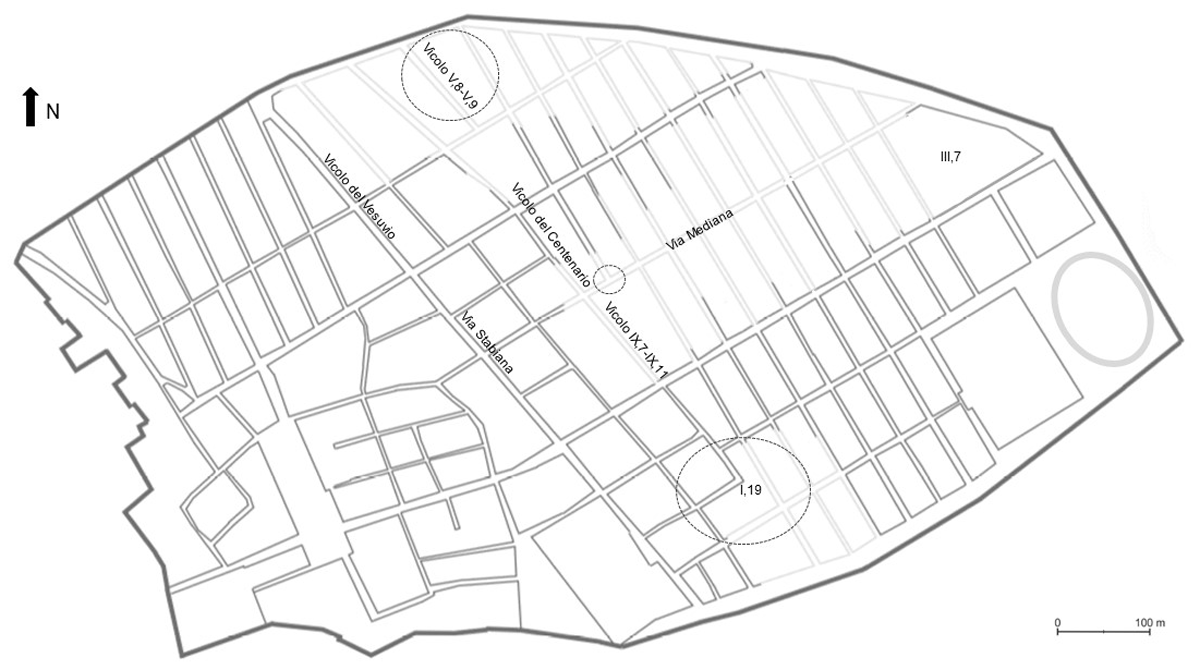
Figure 2
The interpretation of Pompeii’s street network used in this article. Projected streets with lighter grey. (The map was created by the author on the basis of a map created by EPUH/Maija Holappa).
However, some unearthed parts disturb the regularity (Figure 2 for their locations). For instance, it remains unclear if there was a street in the middle of insula III,7? The appearance of the south side of the insula does not indicate a street, and thus I decided to follow Poehler’s view that there was no street. Nonetheless, my interpretation of the Vicolo IX,7–IX,11 is that it continues more-or-less to the Vicolo del Centenario, similarly to Marco Giglio’s (2017: 22 Fig. 6) vision of the street, whereas Poehler sets it to meet the Via Mediana about nine meters east of the intersection (Simelius 2024: 132).
The projection of the street network pattern is connected to the hypothesis of how the city developed. The unexcavated areas are often considered to be one of the last unbuilt areas of Pompeii. Their planning and construction—occurring in several phases—is supposed to follow the grid plan, and the insulae are typically projected as rectangular (For the development of Pompeii, see Geertman 2007: 86–90; Giglio 2017: 21–34; Newsome 2009: 122–123; Poehler 2017b: 22–52). On the other hand, the deduction is interlinked with the shape. The shape of the insulae is one way to recognize the various construction periods of the city, and therefore if the unexcavated insulae are thought to be from the same period, they are projected to be of a similar shape. If future data indicates that the unexcavated street network had anomalies in its grid plan, it would be likely to change our understanding of Pompeii’s development (Simelius 2024: 132–133).
Nonetheless, the eastern edge of the currently excavated area raises some doubts about the even grid in the unexcavated parts. The shape of insula I,19 is not a rectangle, and the Vicolo di Lucrezio Frontone-Vicolo IX,8-IX,9 and the Vicolo V,8-V,9 end in insulae IX,11 and V,3 and do not continue further, although they hypothetically could (these locations are marked with dashed circles in Figure 2). The known streets around insula IX,11 support the current assumption, but it is possible to question the existence of the Vicolo V,8-V,9. Maija Holappa and Eeva-Maria Viitanen (2011: 182), and Giglio (2017: 21–26) have revealed that topographical factors also influenced the formation of the street network, and we cannot totally exclude that this is not the case in the unexcavated areas. Moreover, Poehler (2017b: 44–52) has proposed some changes that further break the symmetry of the street network in the eastern part of Pompeii during the last two centuries of the city, and questions whether the unexcavated grid is as symmetrical as previously thought. These matters create uncertainty for the suggested map and its logic, but any better knowledge can only be achieved after excavations or perhaps by using some non-invasive methods, such as ground penetrating radar. On the basis of current information the rectangular insulae are the most likely option (Simelius 2024: 133).
2.1.2 The public fountains of Pompeii
For the public fountains of Pompeii, I relied on Notarian’s (2023a; 2023b) latest detailed research and the supporting data. It included 46 public fountains, but Notarian has excluded the three basins in the forum and the fountain connected to the so-called arch of Caligula, because they were no longer in use in 79 CE. Additionally, he thinks that the three fountains lacking a basin were not used for collecting household water, and the fountains in the Triangular Forum and in the Quadricporticus might not have been accessible to the public—at least not all the time. Consequently, these fountains were excluded from Notarian’s examination. Therefore, 39 public fountains are considered to have been used for collecting household water (Figure 3).
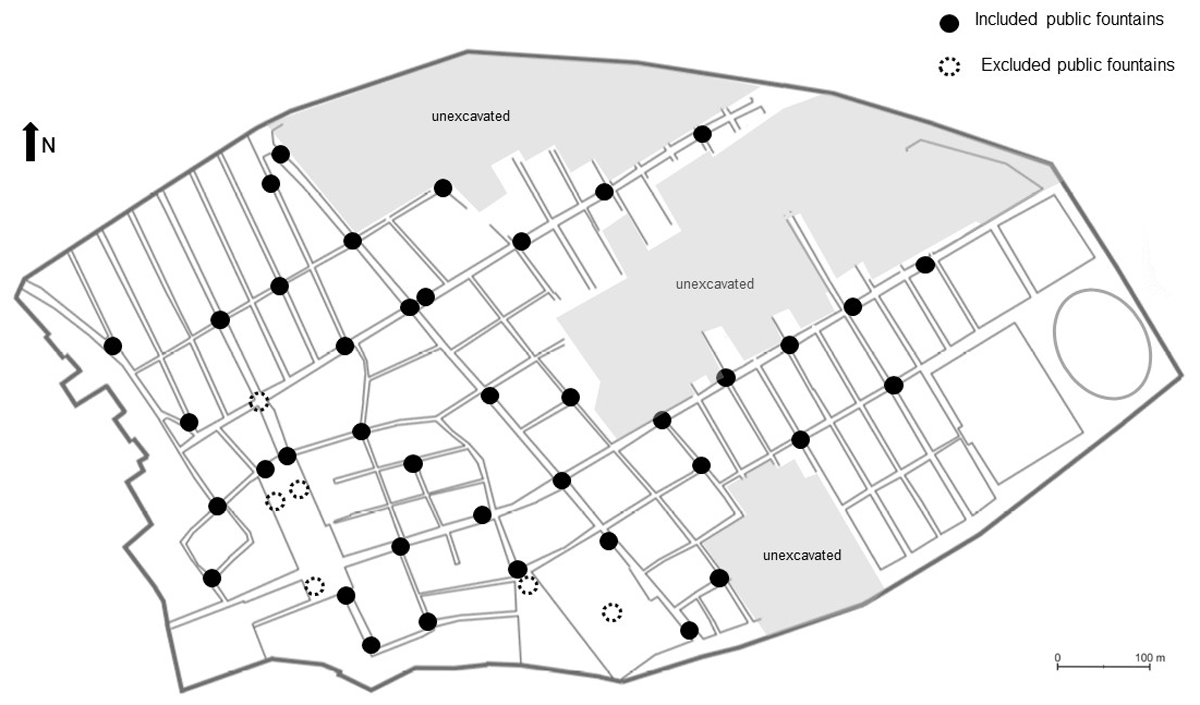
Figure 3
The thus far excavated public fountains of Pompeii according to Notarian (2023a: 88 Fig. 1). (The map was created by the author on the basis of a map created by EPUH/Maija Holappa).
There are likely to have been public fountains under the unexcavated areas. Nonetheless, for the purpose of this article, it is unlikely that they would change the situation significantly, as they would not affect the Gini coefficients much. A few distances between a dwelling and a fountain might be slightly shorter than those calculated by Notarian (2023b), if all the fountains are known. For example, some of the houses on the north side of Insulae V,3 and V,4 (see Figure 1) might have a closer fountain in the unexcavated parts, but even without this information, they are closer to a fountain than many of the houses in Regio VI, where all relevant fountains are known. Furthermore, compared to the number of houses included in the examination, the number of dwellings that could have had a closer fountain is quite small—they are less than 8% of excavated dwellings.
Furthermore, this article examines how the water pipes leading to some of the Pompeian houses may have contributed to inequality. There have been several studies discussing the houses linked to the water pipe network since 2000, but they all provide a relatively different list of dwellings. On the basis of work by Gemma Jansen (2002: 80 n. 204), Hélène Dessales (2013: 397–494) and Richard Olsson (2015: 104–105 Table 7., 105 Table 8.), I estimated the number of houses with water pipe connection. I made a minimum calculation of the dwellings connected to the piped water on the basis of Jansen’s and Olsson’s lists, as their methodology was always to confirm the connections between the house and the pipe network. There were at least 108 dwellings with piped water in Pompeii. Dessales occasionally only inferred the connection and did not confirm it. If her list of dwellings is added to the examination, the number of dwellings increases to 140, forming the maximum known number of houses with water pipe connection in Pompeii (Figure 4).
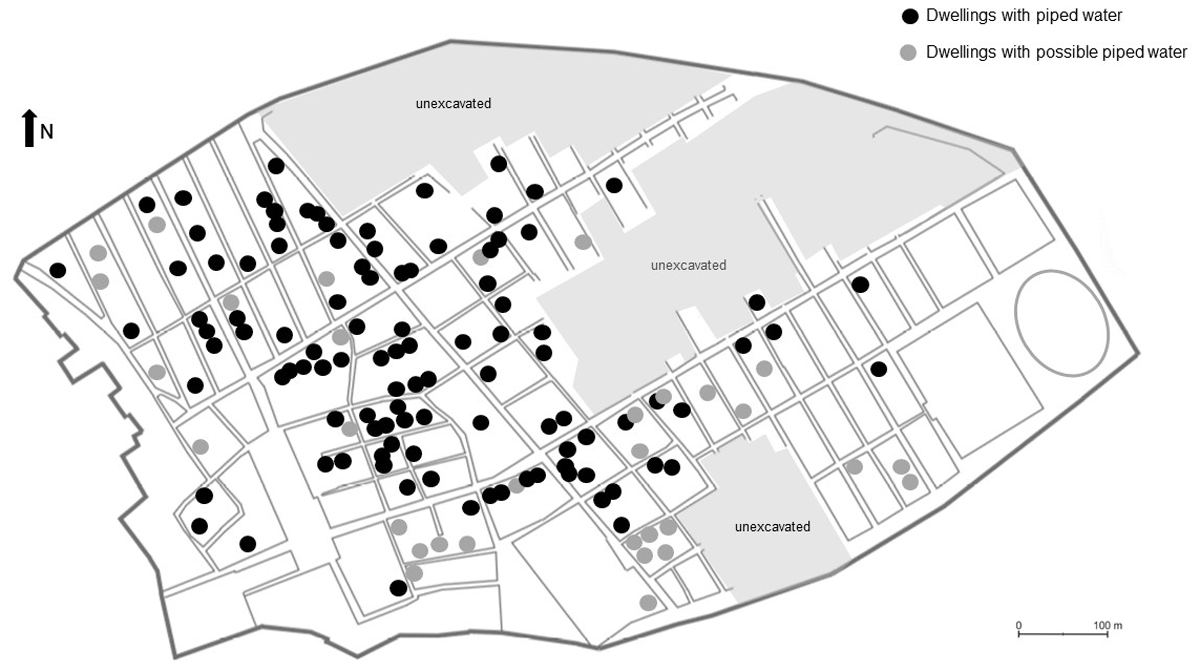
Figure 4
Locations of the houses connected to the piped water. (The map was created by the author on the basis of a map created by EPUH/Maija Holappa).
2.1.3 The baths of Pompeii
The Stabian Baths and the Forum Baths are usually considered to be the public baths of Pompeii in 79 C.E. Furthermore, there are three other baths that are interpreted as being semi-public in nature (Koloski-Ostrow 2007: 224). There are also 29 Pompeian houses with a private bath (de Haan 2001: 48 n. 3; de Haan 2010: 143–356), which I added to this investigation, as the inhabitants of these houses did not necessarily need to visit the public and semi-public baths.
There might still be two or three unexcavated baths that were accessible to the public, at least to some extent, as Koloski-Ostrow (2007: 224) has proposed. This might change our restitution of the public bath network. The main section of the segments of the Pompeian sewerage system are connected to the locations which used large amounts of water, such as the public baths and the Large palaestra, which was a multifunctional public building. In addition, there is one segment for draining the forum. (See Figure 1 for the locations public baths, Large palaestra and forum). Nonetheless, one portion of the system cannot be connected to any such building. It runs north-south just on the east side of the unexcavated southern part (Jansen 2002: 68 Fig. II.96; Koloski-Ostrow 2015: 76, 190 Fig. 91, see also Poehler 2012, see Figure 5 for the location). Consequently, it is possible that there is another public bath in that area, but it could be some other facility/building that needed drainage or perhaps a bath that was out of use, such as the Republican bath which was also connected to the sewerage system. The unexcavated areas to the north are not known to have been connected to the sewerage system—even though we cannot entirely rule out that possibility. Nonetheless, it is possible that there were one or two other semi-public baths in these unexcavated parts of the city, as they generally do not seem to be connected to this type of sewerage. The possible unexcavated semi-public baths could be located near the walls of the city, in analogy to the three known examples.
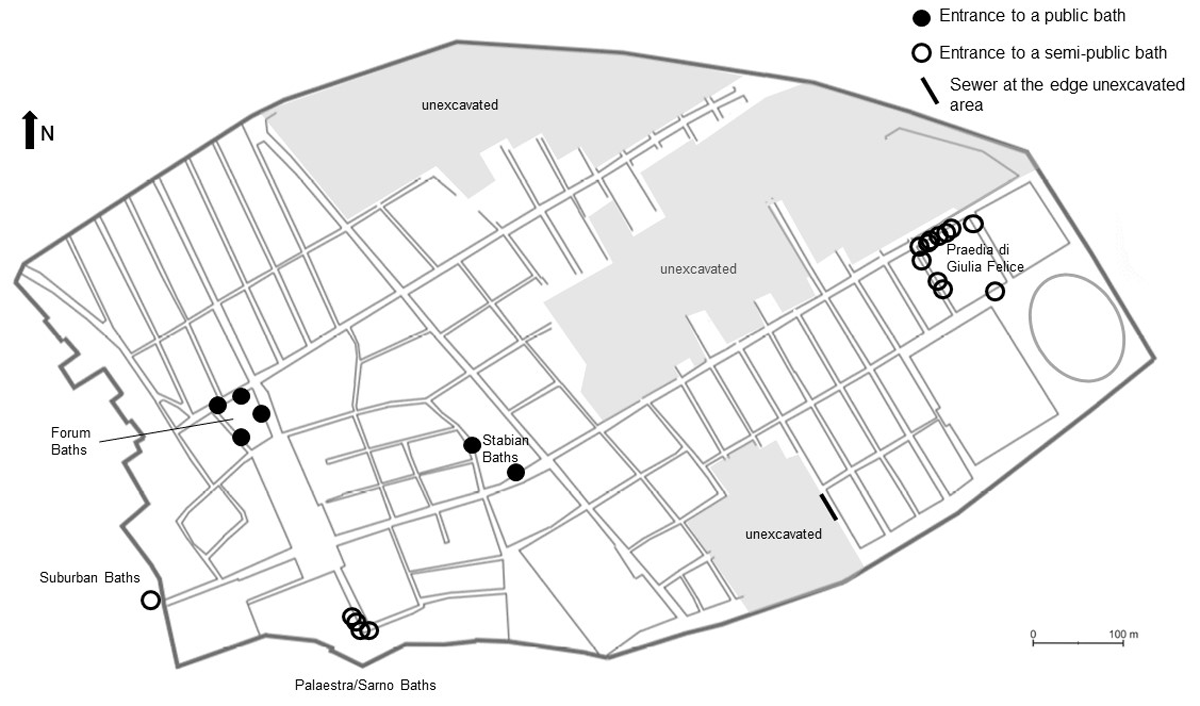
Figure 5
The map with entrances to the Pompeian public and semi-public baths used in this examination. The entrance to the Suburban baths was limited to one, as it is the closest to any dwelling inside the city walls. (The map was created by the author on the basis of a map created by EPUH/Maija Holappa).
2.1.4 Dwellings of Pompeii
Remains of many houses are preserved in Pompeii, yet available evidence is not without problems. It is occasionally debatable where one house ends and the next begins. Most of the houses are straightforward, as the walls create an easily distinguishable entity that forms one dwelling, but sometimes the housing units are less clear, and within a walled complex there could be several separate inhabited entities. (See Flohr 2017: 58–60; Simelius 2022b: 607, 609–610). Examples of this are insula I,15 and Casa di Sirico (VII,1,25/47) as demonstrated in Figures 6 and 7.
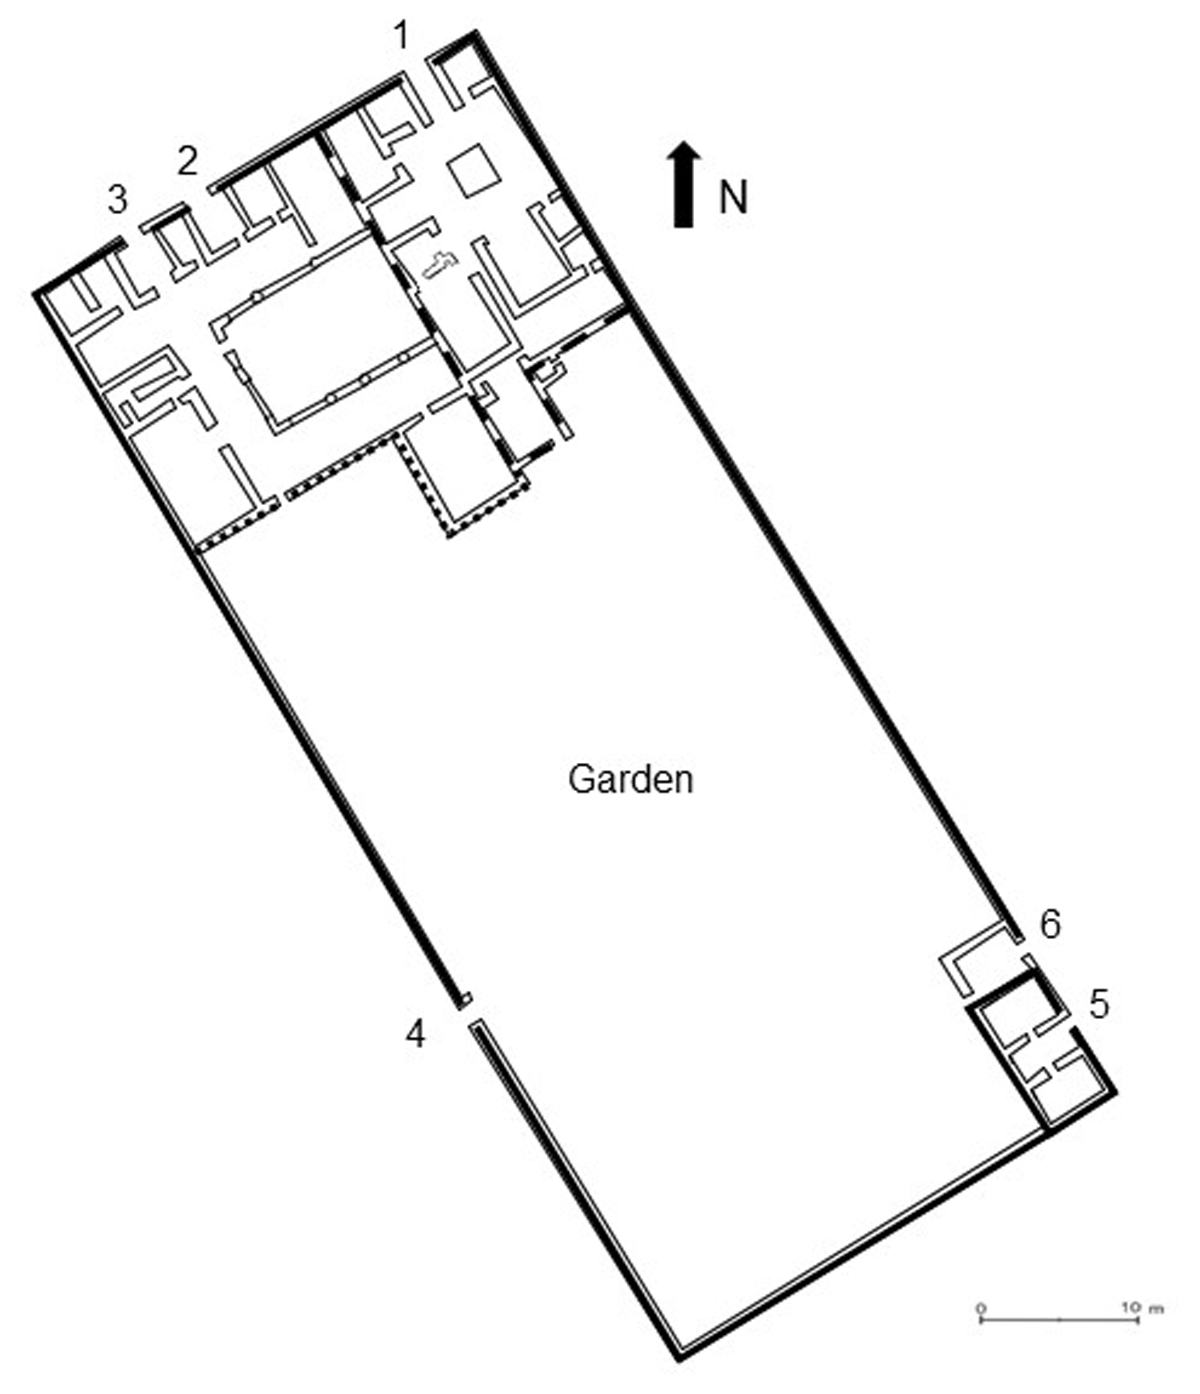
Figure 6
Insula I,15 (location in Figure 1) with several types of lines (solid, dashed, dots) indicating possible separate housing units, yet they can possibly form one large unit. (The plan was created by the author on the basis of a PBMP map, Poehler & Stepanov 2017).
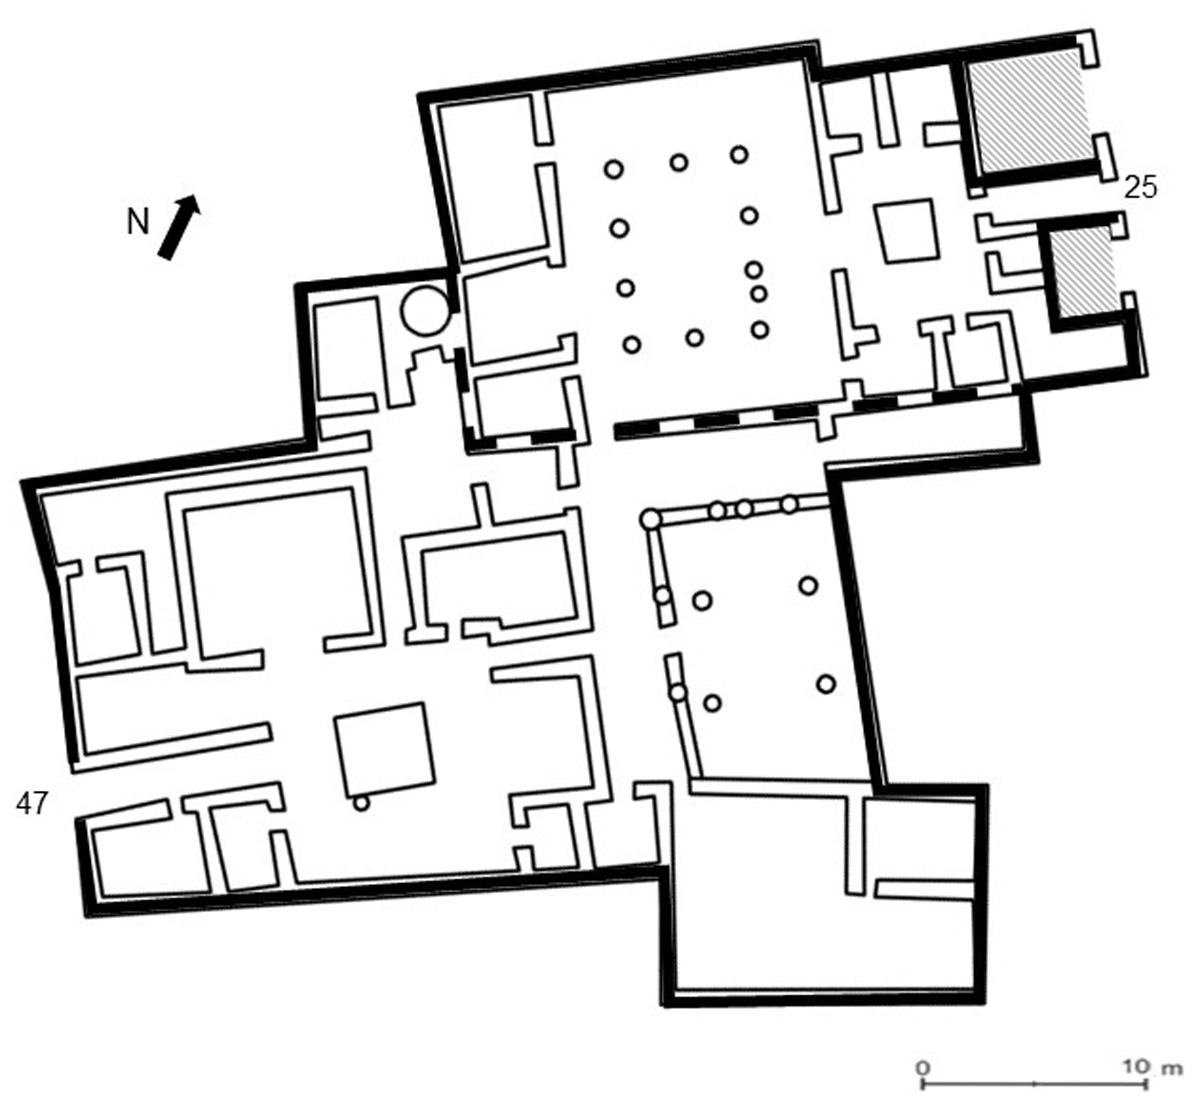
Figure 7
The Casa di Sirico (VII,1,25/47, location in Figure 1) and possible ways to divide it as separate units. The Casa di Sirico is divided into two domestic units (VII,1,25 and VII,1,47), but they can be considered to form only one house. (The plan was created by the author on the basis of a PBMP map, Poehler & Stepanov 2017).
In this article, I have decided to count the entire complex of rooms and spaces that are internally connected via doors as a dwelling. It is possible that there were several family units inside the same complex, but this does not mean that their members could not use the doors and spaces of the other units. Additionally, collecting water could have been done in co-operation with occupants of several units. I mostly followed Notarian’s (2023b) house division, although I have made some changes in connection with some of the separate units and I separated some others (Online appendix: Table 1, doi: 10.5281/zenodo.10079681). As a tool to help in the task to define which units are connected to which other through doors I have used the Pompeii in Pictures web page (https://pompeiiinpictures.com/pompeiiinpictures/index.htm) created by Jackie and Bob Dunn, Google satellite and the Open Pompeii (2022) Map of the Parco archeologico di Pompei.
For this investigation, I have excluded most of the buildings around the Forum, which are usually considered to be public. Additionally, I have not included dwellings that are not entirely excavated, as it is impossible to know the links between them. In total, 1125 private buildings have been considered in this study, from which I excluded 24 houses when estimating the household need of water, because their number of inhabitants could not be estimated on the basis of the number of rooms, as was estimated the other houses (see Flohr 2017: 60–68; Notarian 2023a: 103). These houses are in insulae VI,17, VII,16 and VIII,2 (see Figure 1 for the locations of the insulae) and reach over the city walls. They were severely destroyed in the eruption and their floor plan cannot be fully reconstructed, making it difficult, if not impossible, to estimate the number of rooms.
2.2 Methodology
The methodology used in the article was inspired by Amartya Sen’s (1980, see also Sen 2009) capability approach, which has been used in archaeology by Kimberley Bowes and Cam Grey’s The Roman Peasant Project, for which it was deemed appropriate for archaeological data (Bowes & Grey 2020: 630–631, see also Machado 2023; Rowan 2023). In this article, Pompeians’ capacity to use water-related infrastructure was studied by measuring the time spent by a household to access this infrastructure. The access was further compared to other households to estimate inequality.
The methodology combines three major components: measuring the distance, calculating the Gini coefficient and using various scenarios. For measuring distance, this article largely builds on the network analysis methodology developed by Notarian (2023a). He used an ArcGIS Spatial Network Analyst tool and particularly its Closest Facility function to calculate the fastest route to the public fountains. Following Notarian’s work, my aim was to calculate the time needed to collect water from public fountains and additionally walking from a house to a bath. The article applies the values produced by the Closest Facility tool and assesses how well they describe inequality if they are calculated as a Gini coefficient. Rather than house size, which is often used to calculate economic inequality, the value employed here is distance, measured in time, between the house and the fountain or the bath. To test the usability of the walking time, this article adds other variables to the calculation. These are the household size, the capacity of the vessel used for carrying water, the number of inhabitants of Pompeii and its excavated area and the visitor capacity of baths. These cannot be estimated very precisely, and thus various scenarios were used in the modelling of inequality relating to access to water infrastructure.
2.2.1 Estimating the distance
The methodology used for estimating distance in this article relies on Notarian’s (2023a: 99–100) way of calculating distances in Pompeii (on the methodology see also Wernke 2012; Wernke, Kohut & Traslaviña 2017). He developed an ArcGIS based system, which calculates the most economical route between dwellings and fountains, taking into consideration the natural topography of Pompeii. I have used this same Closest Facility method to calculate the distances in time between the private dwellings and the baths.
In the model, the streets are edges that connect the doors of the private dwellings and the entrances of the baths—and additionally the public fountains. I created several point layers that represent the entrances of the private dwellings (Online Appendix Figure 1), a point layer with all public fountains, and several point layers with the entrances to the public baths. I also created several point layers with the entrances of the semi-public baths. I did not consider all the entrances to the baths, as some of them were likely to have been for maintenance rather than for public access (see Figure 5). I relied on Koloski-Ostrow’s (2007: 227–233, 236–243) interpretation on this matter. A polyline layer was created for the street network (Online Appendix: Figure 2). My decision to create several point layers for the entrances was purely work economical: this way the same layers can be easily adopted for other analysis that does not require all these entrances. However, for the analysis executed here, all the entrances could only have been divided into three layers: one for dwellings, one for public baths and one for semi-public baths.
The ArcGIS ArcMap 10.8 Network Analyst and its Closest Facility function were used to connect the entrances of the private dwellings to the closest entrances of the baths. The analysis used was from one-to-many, meaning that the route was calculated from the house entrance to any of the many entrances to the baths (the number of possible final destinations varies according to if the semi-public baths are included or excluded in the analysis). The house entrances functioned as the incidents and the bath entrances as the facilities. This analysis was performed with all the private house entrances, but as one house can have several entrances, only the shortest route was examined in the final analysis. Similar analysis was made with the entrances of the private houses and the public fountains.
A digital elevation model (Notarian very helpfully and kindly sent me his model) was added to consider the slope gradients to calculate the walking pace using the 3D Network Toolbox (Notarian & Higgins 2023, for the original Toolbox, see Higgins 2019). Following Notarian’s example (2023a: 99 n. 133), the street network was divided into 3 meter pieces to evaluate their gradient. There were two speed simulations: high speed of 4.8 km/h on a slight downhill grade and it slows with a greater gradient in both directions (Márquez-Pérez, Vallejo-Villalta & Álvarez-Francoso 2017) and high speed of 3.5 km/h modelled similarly as the 4.8 km/h (Notarian 2023a: 100; Notarian & Higgins 2023, For a detailed illustration on the relationship between the walking speed and the slope, see Notarian 2023a: Supplementary Online Figures Figure 1 at https://doi.org/10.1086/722233). In the calculations of the access to public fountains and baths, I principally used the faster walking pace (4.8 km/h) as the measure. The slower is mainly for providing a range of various walking speeds to demonstrate the diversity of the walkers better. Nonetheless, when calculating the relative value of the walking paces—such as the Gini coefficient—it does not matter which speed, slower or faster, is used as their relative values should be more or less equal.
In addition, because it is possible that some public fountains, public and semi-public baths have not yet been excavated, I also created a point layer for every entrance (house or street) at the edge of the unexcavated area (Online Appendix Figure 1). This facilitates exclusion from the calculations of the dwellings which perhaps had a closer facility in the unearthed area, i.e., where the closest facility is the edge of the unexcavated area, not a bath or a fountain. The Gini coefficients based on the dwellings for which we certainly know their closest facility can be compared with the Gini coefficient of calculations of all the dwellings. If their difference is large, the calculation of all the dwellings might not be reliable.
2.2.2 Gini coefficient
The results—walking time—produced by the Closest Facility analysis were then used as the proxy values for access to water to calculate a Gini coefficient that indicates the equality/inequality of this access compared between the households of Pompeii. The Gini values range between one and zero. One indicates maximum inequality and zero means total equality, i.e., all the households’ distance to a fountain or a bath would be the same. In the case in which a dwelling was connected to the piped water network or had a private bath, it was given a value of zero when adding them to the Gini calculation.
The Gini coefficient can be calculated from the Lorenz curve (Lorenz 1905), which is a graphical representation of the distribution of the scattering of values. In a graph of the Lorenz curve, the Gini coefficient is the ratio of the area (a in Figure 8) between the line of equality (the straight line at 45 degrees from the lower left corner to the upper right corner of the graph) and the Lorenz curve over the entire area under the line of equality (a + b in Figure 8).
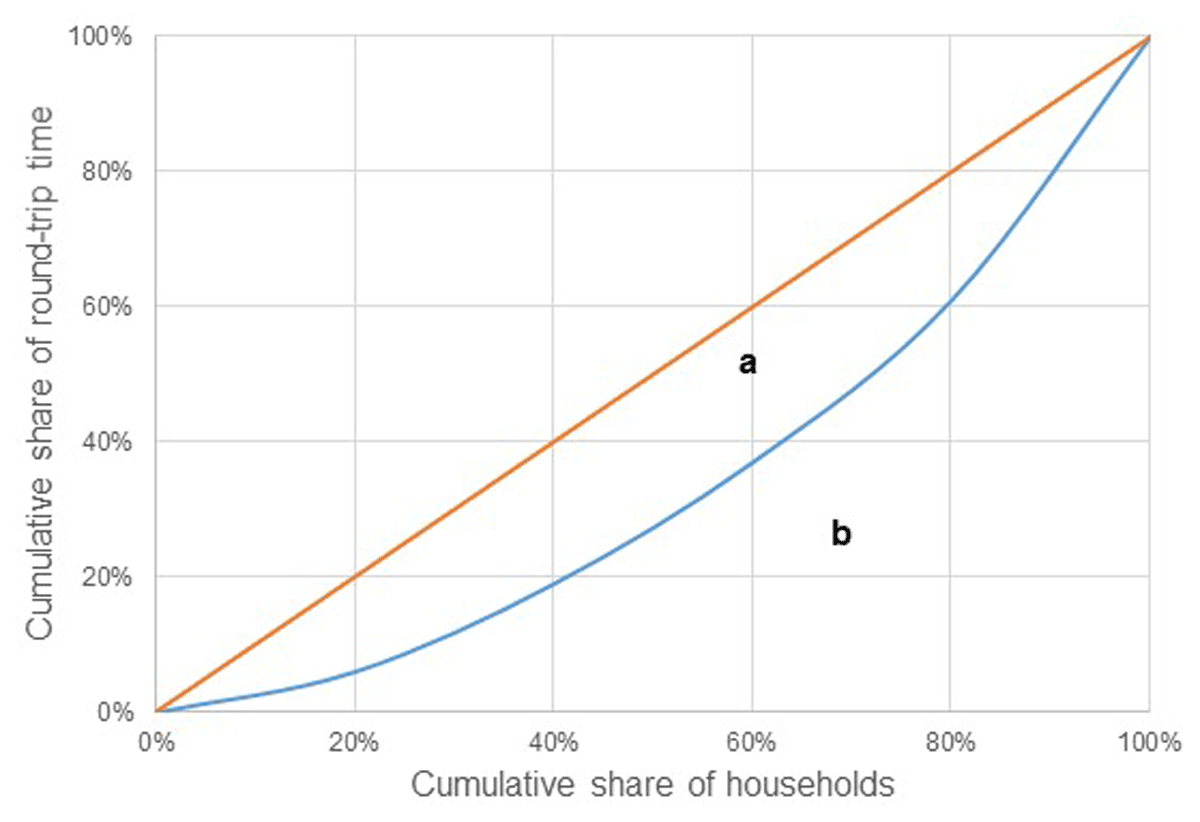
Figure 8
Lorenz curve of round-trip time to nearest fountain from the dwellings. The formula is: Gini = a/(a + b).
2.2.3 Utilizing various scenarios
Besides the distance, there are other factors that should be considered when calculating the Gini coefficient for access to water. Nonetheless, the source material does not allow us to estimate these factors very precisely, rather it offers several options for the calculation, and thus I decided to create several scenarios to see how they influence the Gini coefficient. In addition to distance, the factors that should be considered when estimating access to fountains are the capacity of the vessel for carrying the water, the number of inhabitants in the house, and the per-person need for water. In the case of the baths, they are the bather capacity of the public and semi-public baths, and the number of inhabitants of Pompeii and the number of inhabitants of the excavated area of Pompeii.
Notarian (2023a: 102–104) has demonstrated that the distance between houses and the fountains might not be the only proxy that influenced access to water. He added the number of people living in the house to the calculation to estimate the need of water for each household. We do not have data that reveal the exact number of people living in the Pompeian houses, but it is possible to make coarse approximations. Notarian used Flohr’s (2017: 60–68) method to estimate the minimal and maximal number of people in each house. Notarian further adds to his calculation the difference in the sizes of vessels—ranging from five liters to 20 liters—that could be used to collect water, and he presents two estimations of water requirements per capita: 10 liters per day is low and 20 liters per day is high. The lower is estimated according to the modern emergency minimum and the higher is the acceptable level for basic needs. Subsequently, Notarian produced four scenarios about how much time each house might have needed to collect water from the fountains. The estimations include only water for drinking and cooking.
Notarian (2023a) used Flohr’s (2017: 62–68) population estimates of Pompeii, ranging from approximately 7,500 to 13,500. However, a new funerary inscription has been found outside the Stabian Gate (Figure 1 for the location of the gate). It refers to a feast for over 6,800 Pompeians, which indicates that the estimations of city’s inhabitants of around 10,000 has been too conservative. On the basis of the new inscription, Massimo Osanna (2018: 311–316) has proposed that there might have been 30,000 people, but the inscription can be interpreted differently. Including women being invited to this feast, the number of inhabitants would have been around 16,500 (Simelius 2022b: 616–618, 621 n. 5, see also Bodel et al. 2019 for critique of Osanna’s interpretation of the inscription).
Consequently, I made two other calculations of water consumption with new higher estimations of people living in Pompeian houses. First, I added up both of Notarian’s estimations of people per house—minimum and maximum—then I took one quarter of the people away from each dwelling and rounded up. This gives a total population for the calculated dwelling which matches the scenario of 16,500 inhabitants for the entire city. For the water consumption, I used a scenario of 20 liters of water per person and using 20-liter vessels to fetch the water. To reach an estimation of 30,000 Pompeians I again added up Noatrian’s minimum and maximum estimates of the house inhabitants, but instead of reducing the population by a quarter, I added a quarter to the calculation. This way the number of inhabitants in the dwellings studied would be more than 16,500. This figure would be sufficient, particularly as the large houses of the Regiones VI,17, VII,16 and VIII,2 have been excluded. If we estimate the number of Pompeians as being high, those houses must have a large number of inhabitants. To make this a maximum scenario by using the parameters of this article, I used Notarian’s estimation of 20 liters of water per person and a 5-liter vessel used for carrying it, as that combination takes the most time. These were selected to achieve the highest possible values with the set factors. There are now four different estimations of population that can be utilized in the Gini calculations (Table 1 and Online appendix: Table 2).
Table 1
Various inhabitant scenarios of Pompeii, and times to visit the baths according to these scenarios. (The population estimations are based on Flohr 2017, Osanna 2018 and Simelius 2022b).
| INHABITANTS: POMPEII | INHABITANTS: EXCAVATED AREA | TIMES TO VISIT BATHS PER INHABITANT (EXCAVATED AREA) | TIMES TO VISIT BATHS/INHABITANT (SIMULATED WITH ONE UNEXCAVATED PUBLIC BATH AND TWO SEMI-PUBLIC) |
|---|---|---|---|
| 7500 | 5500 | Once a week | Every 5–7 days |
| 13500 | 8900 | Every 9–12 days | Every 9–13 days |
| 16500 | 10900 | Every 11–15 days | Every 11–15 days |
| 30000 | 19800 | Every 20–27 days | Every 20–28 days |
Despite the considerable number of studies of the Pompeian baths, they often avoid estimating the number of visitors to these baths. Nonetheless, Henry Blyth has projected that the Stabian Baths women’s side could host nine people together by pool, totaling 18 people. On the men’s side the number is 16 for each pool, for a total of 32 bathers. He approximates that with this capacity, there could be 55 bathers per hour, making 330 a day if the baths were open from midday to dusk (Blyth 1999, 87–89). This makes about 35 minutes of bath time per visitor. On the basis of these numbers and the size of the bath complexes, it is possible to make a rough estimation of the visitor capacity of Pompeian baths. The areas of the bath buildings can be found or measured on the PBMP online map (Poehler & Stepanov 2017). For the Praedia di Giulia Felice, I only counted the buildings of the insula, not the large garden. I additionally halved the capacity of the semi-public baths, as they perhaps were more exclusive (see e.g., Koloski-Ostrow 2007: 237–238 on the Praedia di Giulia Felice), resulting in public baths for 500 people per day, 350 of which were semi-public. We can thus estimate that the combined capacity of both types of baths was about 750 to 1,000 bathers per day in the thus far excavated Pompeii at 79 CE. If this is compared to the estimations of population in that area (Simelius 2022b: 618 Table 3), it means that with a population estimation of 5,500 for the excavated area, everybody could bathe during one week. With 8,900 inhabitants for the excavated area in nine to 12 days, every Pompeian had the chance to bathe. If we estimate the population of the area as being 10,900, everyone could bathe every 11 to 15 days and with 19,800 inhabitants, the interval was 20 to 27 days (Table 1).
Following Koloski-Ostrow’s (2007: 224) estimation that there are still unexcavated baths for the public, and based on the assumption presented above that one of them was public and two were semi-public provides a maximum capacity of bath space for Pompeii. Approximating that their visitor capacity is the average of thus far excavated baths (for public baths, 250 bathers and for the semi-public baths, 120), this means the entire capacity of Pompeii would be around 1,100 to 1,500 bathers per day. With the minimum estimation of population, 7,500, everybody could visit the baths once every five to seven days. With an estimated 13,500 people, it would be every nine to 13 days, with 16,500 it would be 11 to 15 days, and with 30,000 it would be 20 to 28 days. The numbers are almost similar as the estimations of the thus far excavated part of the city (Table 1).
It is also possible that occupants of houses that had private resources, such as piped water or a private bath, still utilized the public infrastructure. For instance, Notarian (2023a: 94) notes that some Roman textual sources suggest that the wealthy households brought their water from public fountains even if they had piped water. Because of this, I decided to model inequality in two ways: just considering the public fountains, and another calculation which included the connection to the piped water network. In the case of the semi-public baths, it is difficult to know exactly to whom these baths were available, and therefore I decided to calculate two options for Pompeii: one considering only the public baths and other that includes the three semi-public bath complexes. Additionally, even if some of the houses had a private bath, it is considered that their inhabitants might also occasionally have visited the public baths, for social reasons (Hakanen 2020: 44; Koloski-Ostrow 2007: 242). Consequently, I decided to make some calculations with private baths and some without.
3 Results
3.1 Fountains
Visually, the Pompeian public fountain network seems extensive and transfers a picture of equal distribution (Figure 3). Yet, the distance between dwellings and fountains varies from two meters to 215 meters. This might seem like a large difference, but the distances are relatively moderate, as might be better observed with the round-trip time to the fountains, which varies from a couple of seconds to about seven minutes. The average distance is 47 meters or about 1.5 minutes, and the median is 42 meters or about one minute and 20 seconds. If the entire city was to be excavated, these values would likely be a little lower as there could be some unexcavated fountains closer to the houses for which measurements were taken. The scattering of round-trip times was reasonably equal according to the Gini coefficient, which is 0.331 (Figure 8).
The differences between the households become larger when examining the estimates of the daily time spent bringing water. Notarian’s (2023b) lowest values suggest that in some houses it could be done in a few seconds, when the highest time was more than nine hours. The Gini coefficient of time spent fetching water with the population estimation of 7,500 is 0.525 and with the estimate of 13,500 it is 0.538 (Figure 9). While still in the middle range of the Gini scale, this coefficient is much higher than when only considering the distance from dwellings to fountains. Very similar Gini coefficients were calculated on the basis of the new population scenarios. The Gini coefficient with population estimation of 16,500 for Pompeii is 0.527 (Figure 10). The Gini coefficient of 30,000 population is 0.538 (Figure 11).
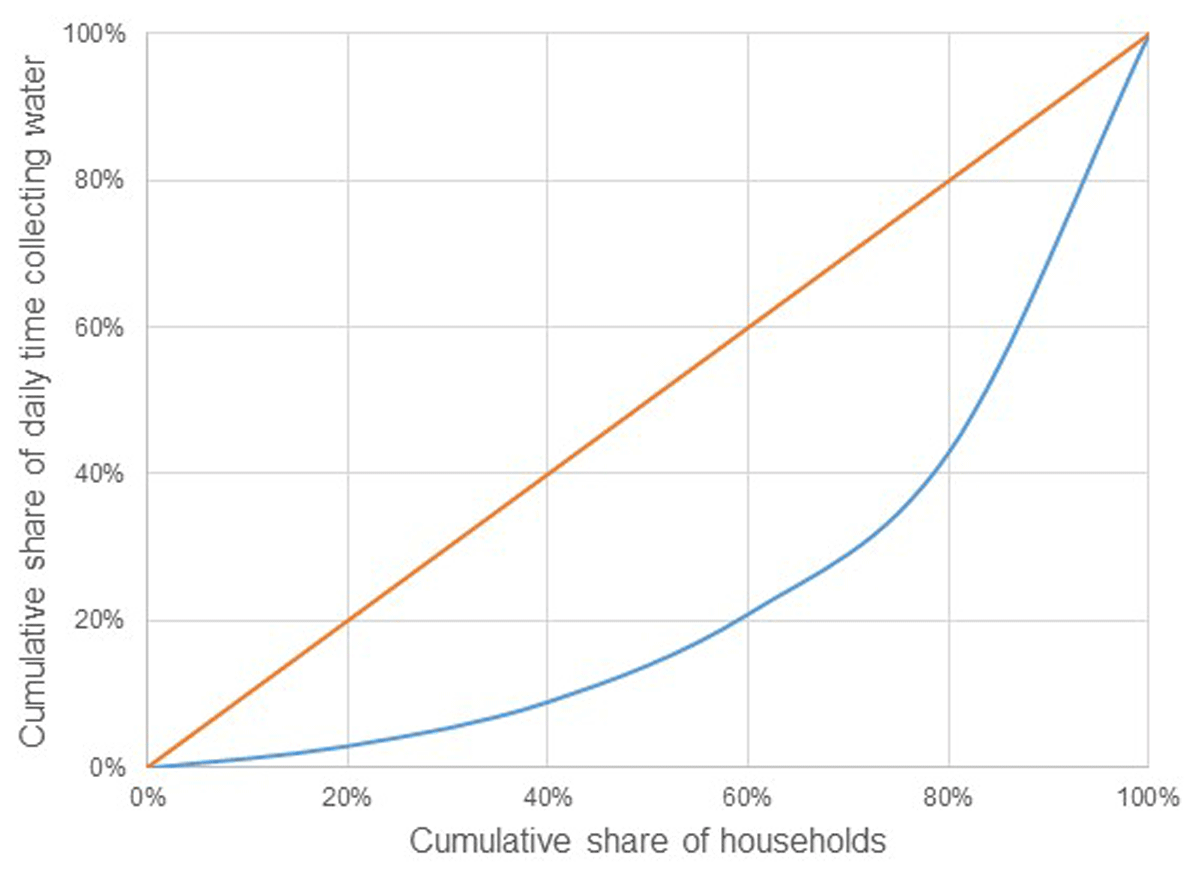
Figure 9
Lorenz curve of daily time collecting water per household, according to Notarian’s (2023b) maximum scenario, 13,500 inhabitants.
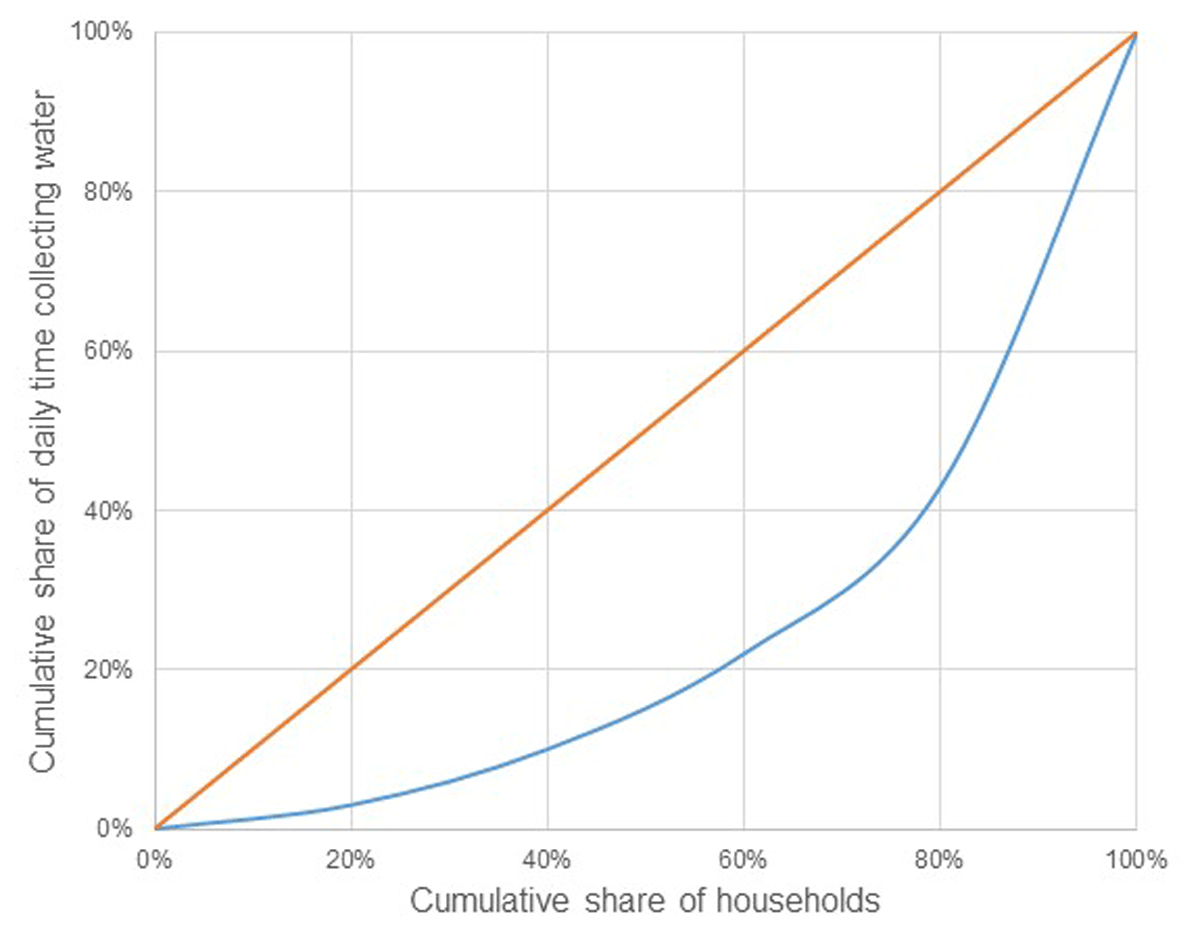
Figure 10
Lorenz curve of daily time collecting water per household, according to the scenario 16,500 inhabitants living in Pompeii.
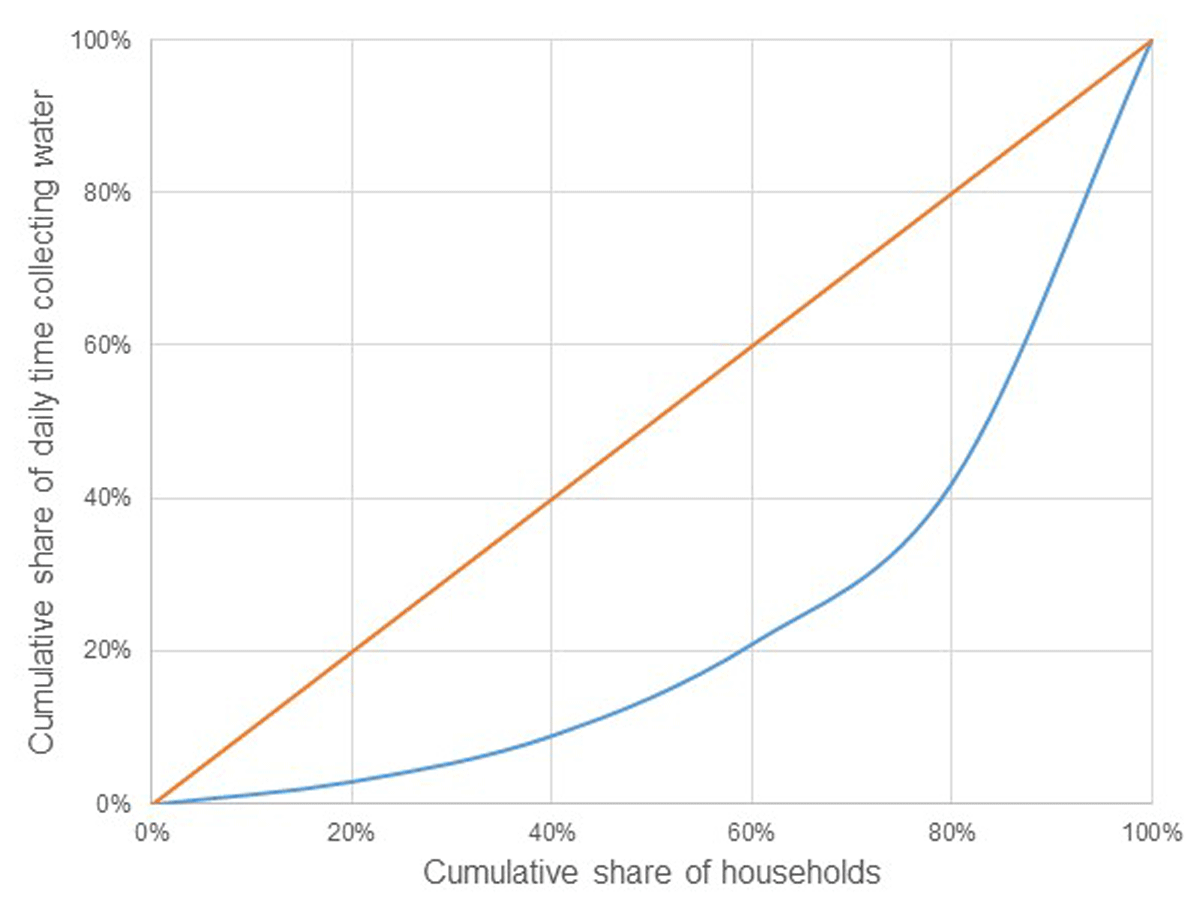
Figure 11
Lorenz curve of daily time collecting water per household, according to the scenario of 30,000 inhabitants living in Pompeii.
If the piped-water network is added to the calculation, the Gini coefficient of the 7,500 inhabitants scenario is 0.553, if we take the minimum number of dwellings (108) connected to the network. If the maximum number of dwellings (140) is connected, the Gini coefficient would be 0.565. In the 13,500 scenario the coefficients are 0.568 and 0.580, and in the 16,500 inhabitants scenario 0.556 and 0.568. In the scenario of 30,000 inhabitants and with the minimum number of dwellings connected to the piped water, the Gini coefficient is 0.566. If the maximum number of dwellings were connected, then it would be 0.578 (Figure 12). This produces the highest Gini value, and thus the estimation is that inequality of fetching water in Pompeii is somewhere between Gini coefficients 0.525–0.578 (Table 2).
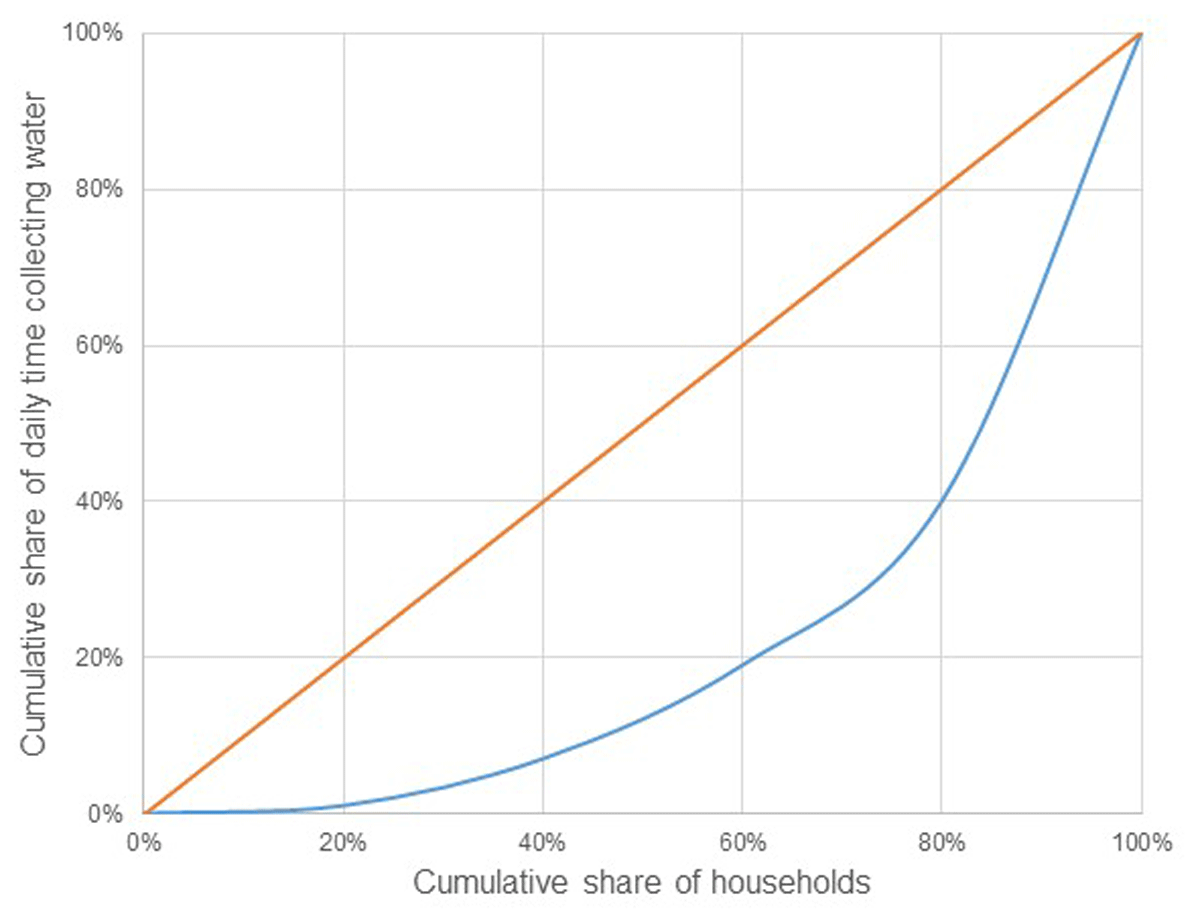
Figure 12
Lorenz curve of daily time collecting water per household, according to the scenario 30,000 inhabitants living in Pompeii and including the piped water network.
Table 2
Various scenarios of calculating time used for fetching water and their Gini coefficients.
| PUBLIC FOUNTAINS | PIPED WATER (MIN.) | PIPED WATER (MAX.) | |
|---|---|---|---|
| One trip Time | 0.331 | ||
| Daily time (Notarian min.) | 0.525 | 0.553 | 0.565 |
| Daily time (Notarian max.) | 0.538 | 0.568 | 0.580 |
| Daily time (16 000 inhabitants/large vessels) | 0.527 | 0.556 | 0.568 |
| Daily time (30 000 inhabitants/small vessel) | 0.538 | 0.566 | 0.578 |
3.2 Baths
The shortest walk between a private dwelling and a public bath in Pompeii was just a matter of seconds—as the closest possible dwelling is just behind the wall of the entrance to a bath—and the longest walking time was 13 minutes. The distance of the shortest walk is less than half a meter, and the longest about 650 meters (Online Appendix Table 3). The average time at the faster walking pace is about three minutes, and with the slower speed, it is around four minutes and eight seconds. The medians are two minutes and 45 second and three minutes and 44 seconds, respectively. The Gini coefficients of the walking times to public baths is 0.374 (Figure 13).
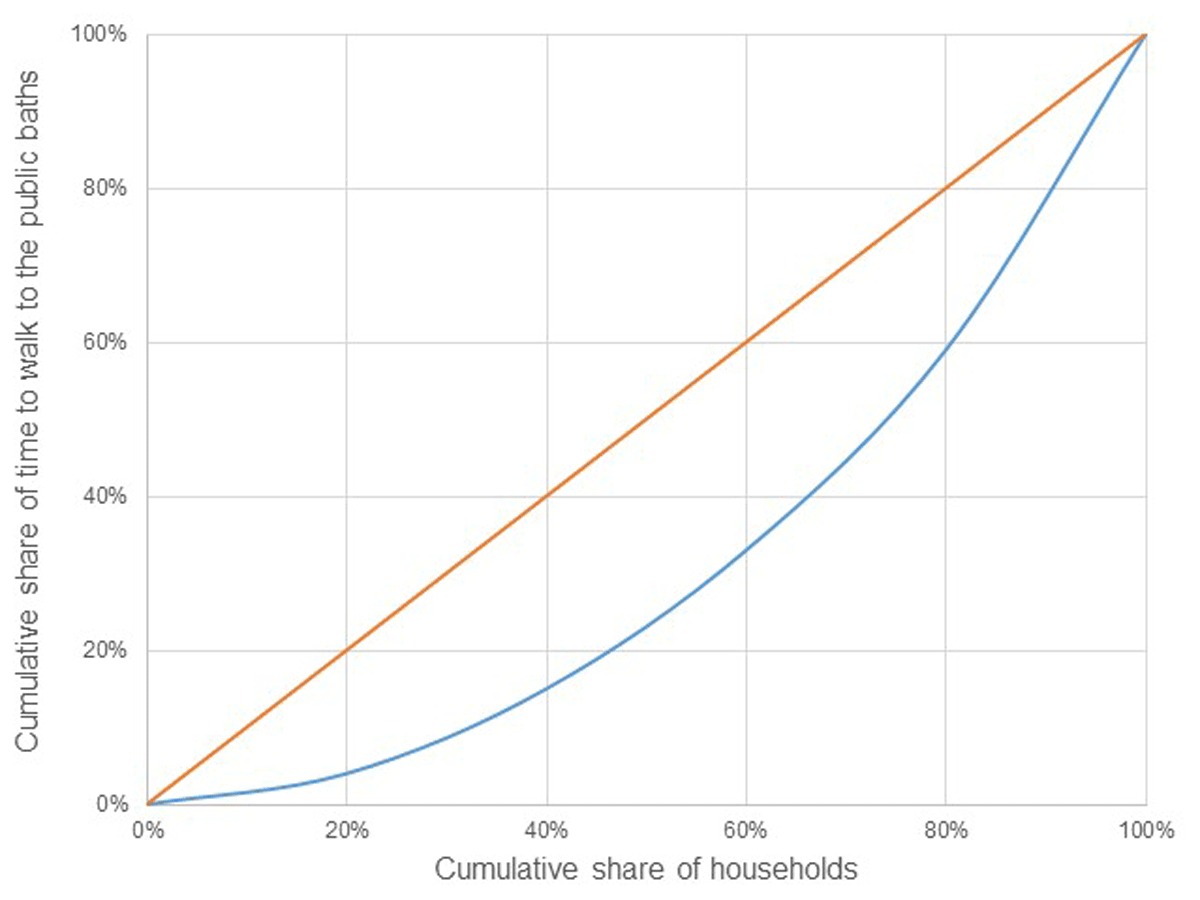
Figure 13
Lorenz curve of time to walk to the public baths per household.
If we add potential semi-public baths to the calculation—those in the Praedia di Giulia Felice II,4, the Palaestra/Sarno Bath and the Suburban Baths—the shortest walk on the street is essentially zero meters as, for instance, house VIII,2,18 is directly connected to the Palaestra/Sarno Baths. The maximum time to walk to the baths is almost 10 minutes and 40 seconds, and its distance is about 520 meters. The faster walking pace takes an average of two minutes and 35 seconds and the slower one three minutes and 32 seconds. The medians are two minutes 20 seconds and three minutes and 10 seconds, respectively. The Gini coefficient for walking time is 0.375. Including the baths that were in private houses in the calculation does not change either Gini coefficients much, as their number is quite small: the Gini coefficient including the private baths is 0.392 (Figure 14). If the semi-public baths are excluded, the Gini coefficient is equally 0.392.
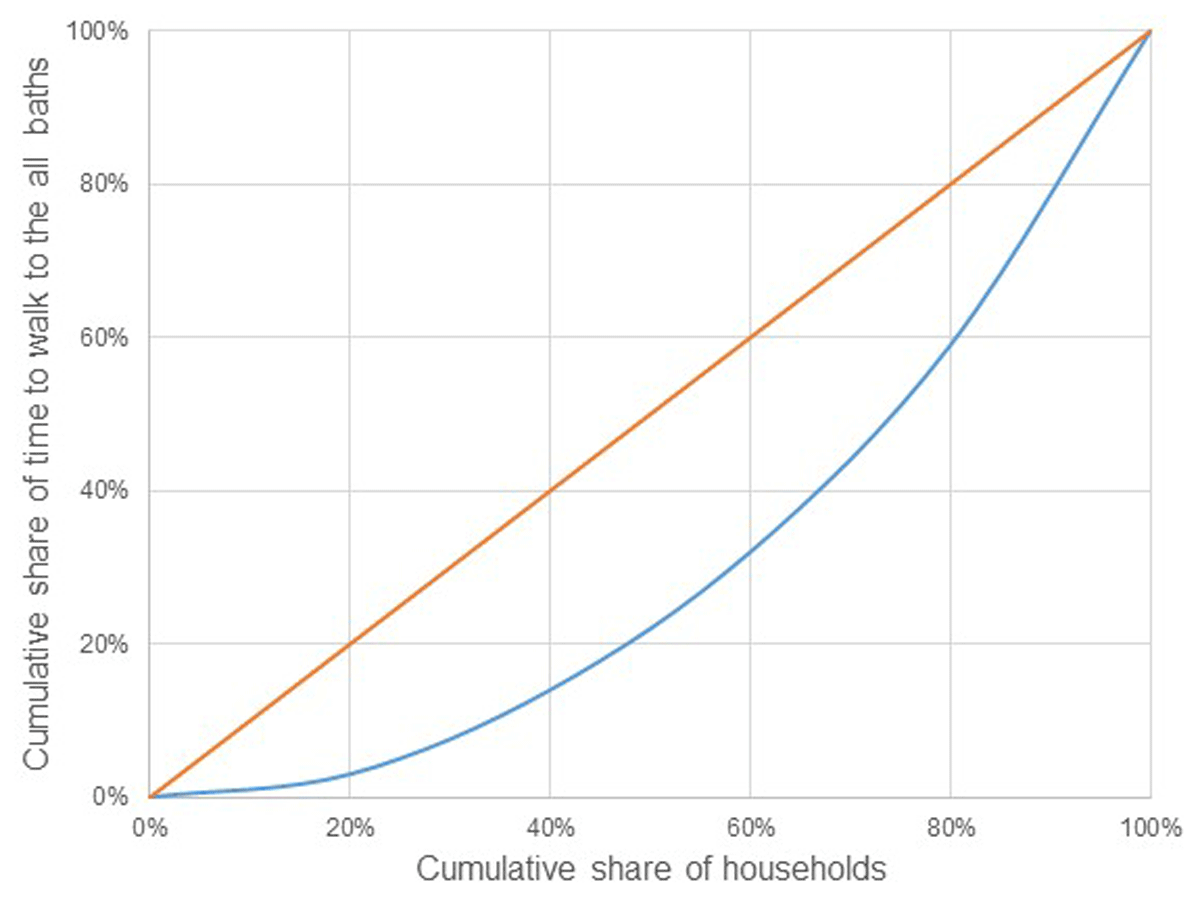
Figure 14
Lorenz curve of time to walk to the baths per household, including the private houses with baths.
It is possible that there are bath complexes under the unexcavated sections, and consequently the Gini estimation might be seriously incorrect. To test it, the Gini coefficient can be calculated by including only the dwellings that we certainly know are connected to the closest bath. If only public baths are estimated, there are 622 such dwellings. The Gini coefficient measured this way is 0.362. If we think that there could be a public bath in Regio I, then we obtain 884 certain dwellings. The Gini in this scenario is 0.351. If the semi-public baths are included there are only two dwellings (624) more compared to the count of the public baths: the Gini is 0.368. The Gini coefficients are quite close to those with all the excavated dwellings, so the calculations are likely to transmit the correct picture. It is always possible that the unexcavated part is dissimilar to the excavated sections, so the results here could be questioned, but that can be only confirmed by researching the area more and producing new data, by excavating or other methods.
Calculating the Gini coefficient on the basis of the time spent walking from houses to the baths resulted in quite similar results, almost all the scenarios were close to 0.37 (Table 3). However, as the Gini coefficients of accessibility to fountains showed, only considering distance does not yield reliable results. Considering the baths, there is naturally the question about how many bathers could visit the Pompeian baths during a day?
Table 3
Various scenarios of calculating walking time from dwellings to the closest bath and their Gini coefficients.
| ONE TRIP TIME | |
|---|---|
| Including only public baths | 0.374 |
| Including also semi-public baths | 0.375 |
| Including also private baths | 0.392 |
| Including only public and private baths (excluding semi-private) | 0.392 |
| Including only public baths (only certain houses) | 0.362 |
| Possible public bath in Regio I (certain houses) | 0.351 |
| Including semi-public baths and a possible bath in Regio I (certain houses) | 0.368 |
3.3 Combined access of water
The distance between a private dwelling and a bath within Pompeii does not appear to be far, walking 10 minutes is unlikely to be too inconvenient, and the access to the baths calculated on the basis of walking time divides relatively equal, as the Gini coefficients demonstrated. However, it is important to include the capacity of the baths in the access calculations. In this section, I aim to do it by combining weekly time spent collecting water and visiting the baths, and thus estimating the inequality of this combination by using the Gini coefficient.
In the smallest inhabitant scenario, the capacity of the baths could offer a Pompeian an opportunity to use the baths once a week, if the chances were divided equally. Even in this scenario, the capacity suggests a need to queue for the baths, if the baths functioned on a first-come-first-served basis. Distance begins to matter, and the visits had to be better planned the further away from a bath one was. In particular, if we believe that Pompeii had a high estimate of population, it seems that the visit needed to be planned very carefully, as it could only occur about once a month, and that visiting a bath was rather a luxury than an occasion to take care of weekly cleanliness.
A rough weekly estimation of how much time each household used for movement related to collecting water and visiting baths was executed on the basis of the calculations made for sections 3.1 and 3.2. If we take the minimum inhabitants’ scenario, about 7,500 inhabitants, it means that every Pompeian could visit a bath once a week. Notarian’s water fetching calculation is only for drinking and cooking water, so perhaps doubling the water amount of one day could provide additional water for personal hygiene in addition to the trip to the bath. This means that there were two days a week for personal hygiene: one in baths and one in the house with fountain/piped water. The scenario of 13,500 inhabitants does not provide the option for weekly visits to a bath, so here perhaps in addition to doubling one day’s water consumption, the consumption of another day should be multiplied by 1.5 to add more water collected from the fountains for hygiene. Also, the walking time to baths should be halved as there was no opportunity to visit the baths weekly—in this estimation it occurs biweekly. Similarly for 16,500 inhabitants, a multiplier could be 1.75 and the bath walking time should be a quarter, and for 30,000, the water consumption of two days should be doubled, and no walking time for the baths included, as the possibilities to visit baths were rare and thus did not have much influence on weekly hygiene. For the minimum scenario, the Gini coefficient is 0.514, for 13,500 inhabitants 0.578, for 16,500 inhabitants 0.565 (Figure 15), and for the maximum scenario, 0.579. These calculations include all baths—counting those in the private houses—and maximum amount of dwellings connected to piped water (Table 4).
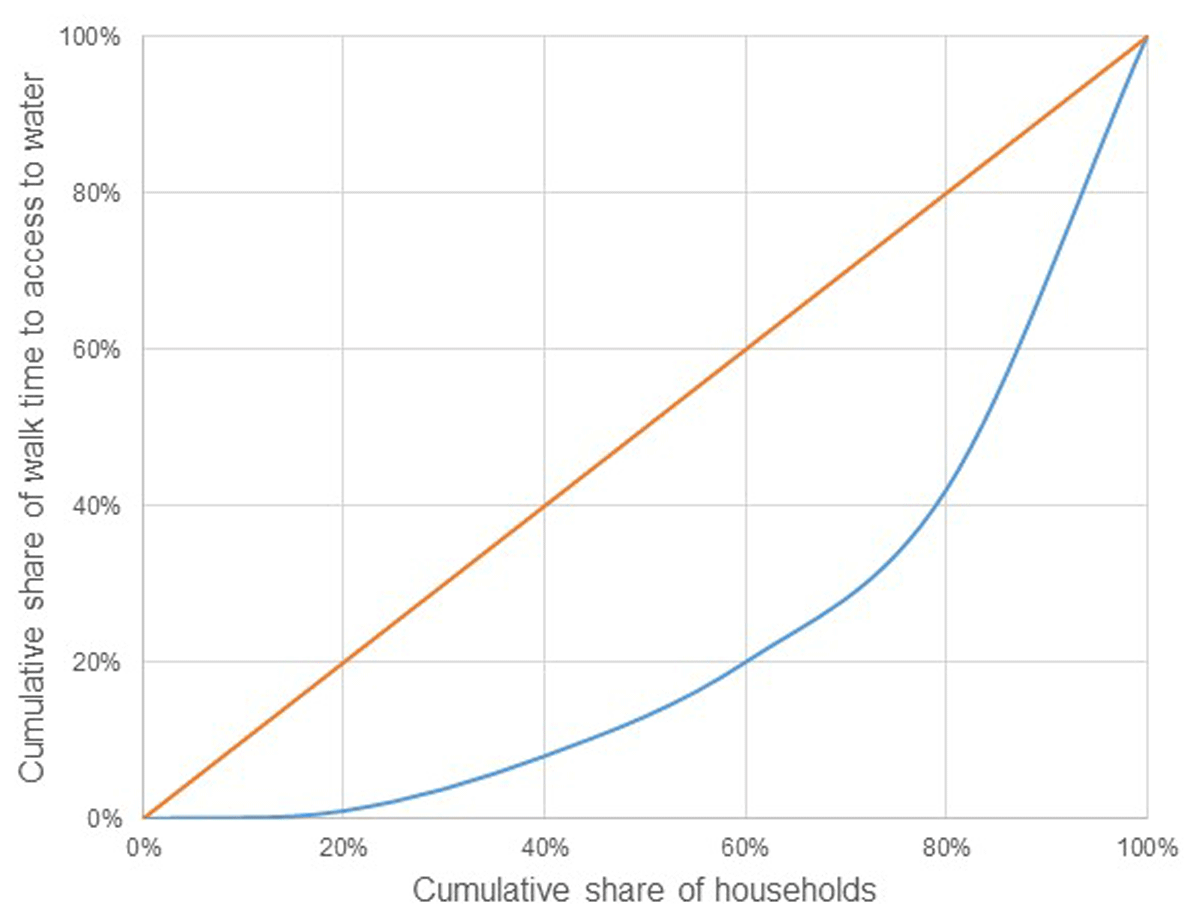
Figure 15
Lorenz curve of weekly walk time relating to access to water, according to the scenario of 16,500 inhabitants in Pompeii.
4 Discussion
The Gini coefficients of Table 4 are all between 0.5 and 0.6. Similar results—Gini coefficients between 0.54 and 0.62—have been estimated for the wealth inequality between the Pompeian households (Flohr 2017: 75; Kohler et al. 2017: suppl. 1 p. 6; Kron 2014: 129). Nonetheless, new estimations of the household Gini coefficients that included the families that did not own a dwelling, are 0.72–0.92 (Simelius 2022b: 615–621). These are clearly higher than the estimates to access of water, which seem to have been divided more equally than wealth in Pompeii. Perhaps a relatively easy access to a basic need—such as water—made it easier to tolerate the high wealth inequality (on a possible small entrance fee to the public baths, see Hakanen 2020: 44, on free access to water in the public fountains, see De Kleijn 2001: 78).
The maximum Gini calculation relating to access to water in Pompeii was almost 0.6 (Table 2 and 4), but in this scenario, the population is very high compared to other population estimates. It seems that this high population of 30,000, would have made Pompeii into a very unequal place; for instance, the wealth inequality of the households calculated on the basis of the house architecture is around 0.9 (Simelius 2022b: 618 Table 3). Nonetheless, the inequality for access to water is much lower than these estimations of the wealth inequality, even if the population of the city is estimated high. In addition, all the Gini coefficients of Table 4 are relatively close to each other, whereas the wealth ranges from 0.7 to 0.9. Again, access to water seems to be more equal than wealth, even with the high estimations of population.
The Gini values in Table 4 are around 0.5, as are several Gini coefficients of Table 2, which demonstrates the inequality to access for the public fountain. This indicates that Pompeian baths contributed relatively little for the general distribution of access to water, as adding them to the calculation does not change results much. At the time of the eruption, a new public bath complex, the Central Baths, was under construction (de Haan & Wallat 2023: 1), which together with these numbers suggest that there was a dire need for more bathing facilities. Additionally, this suggests that the private baths may also have had an important hygiene function for individual households—they were not just luxury. At least they offered comfortability for the people living the houses—they were not dependent on possibly crowded public and semi-public bath facilities.
5 Conclusions
The examination has demonstrated that the distance to the public fountains and baths can be used to measure the inequality in Pompeii. However, it needs another proxy, such as the estimation of water consumption per household or the capacity calculation of the baths, to approximate the access to water more precisely. Only taking into consideration distance, Pompeii does not appear to have been very unequal: the Gini coefficients are between 0.3 and 0.4. The city planning seems to have been done in a manner that there was a public fountain relatively close to each dwelling and the trip to a bath was not excessively long (although, the small size of the city is also a key factor here). Nonetheless, if we add other features, such as calculating how much water each dwelling needed, the Gini coefficient rises to over 0.5. Also, if we make a weekly overall calculation of time spent fetching water and visiting baths, including the capacity of the bath, the Gini coefficient is over 0.5 with all the population estimations. The distance thus can be potentially used as a part of the value, to measure health inequality, but it alone is not sufficient. Nonetheless, studies of other sites need to be completed to estimate how it functions with different archaeological data.
In Table 4, the small decrease in the Gini coefficients (0.013) between the 13,500 and 16,500 scenarios can be explained by the different vessel sizes used in the calculations. A smaller vessel requires more trips to the fountain, which increases the difference between the times to bring water for different households. This highlights the importance of considering various aspects such as calculating the access to water, and additionally, that these results are always somewhat directional—any Gini calculations of antiquity should be taken only as a rough estimate.
There are several ways to continue this research, which is a starting point for development of the use of the ArcGIS Network Analyst data for Gini calculations and estimating health inequality. The calculations on water accessibility could be adjusted to model the differences between individuals. Here, the focus was on the households, and relied on a trickledown effect: everybody in the house could enjoy the water transported to it, or a private bath. Various scenarios in which this is not so straightforward could be designed to calculate the inequality between the individuals in Pompeii. Also, a differentiation between the women’s and men’s sides of the baths could be added to the calculation, although this type of division seems to be debated (see e.g. Hakanen 2020: 44–45). Additionally, testing the Spatial Gini coefficient (see e.g. Panzera & Postiglione 2020; Türk & Östh 2023), which has been used to study the modern world, would be interesting in the Pompeian context.
Acknowledgements
I would like to thank the fellow members of the project “Law, Governance and Space: Questioning the Foundations of the Republican Tradition” (funded by the European Research Council under the European Union’s Horizon 2020 research and innovation program, grant agreement No 771874): Kaius Tuori, Antonio Lopez Garcia, Juhana Heikonen, Anna-Maria Wilskman, Vesa Heikkinen and Lilian Kiander. In addition, many thanks to Ian Dobson for correcting and suggesting ways to improve the English-language version of the text. An enormous expression of gratitude to Matthew Notarian, who very kindly helped me when I was learning to use the ArcGIS Network Analysis and for providing me with his digital elevation model, which saved a great deal of work. As mentioned, his work was the main inspiration for this article. Also, many thanks for all the help—as always—provided by Eric Poehler, Marco Giglio and Eeva-Maria Viitanen.
Reproducibility
The data of this article is published online: doi: https://zenodo.org/records/10079681.
Funding Information
Project “Law, Governance and Space: Questioning the Foundations of the Republican Tradition” funded by the European Research Council under the European Union’s Horizon 2020 research and innovation program, grant agreement No 771874.
Competing Interests
The author has no competing interests to declare.