
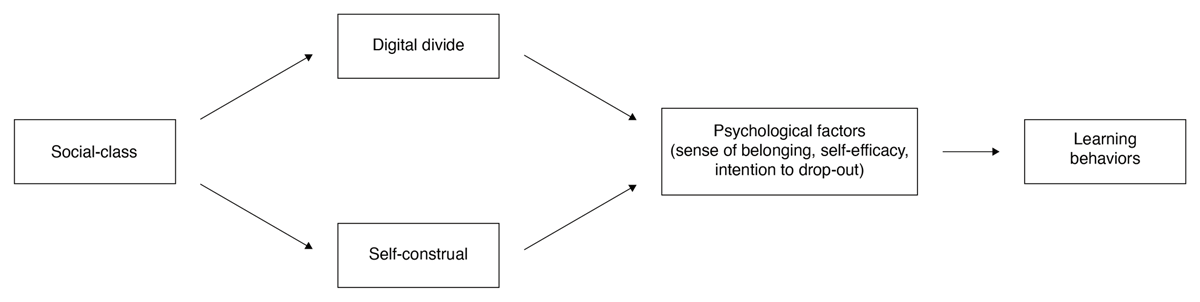
Figure 1
Conceptual model of hypothesis 2.
Table 1
Demographics.
| SOCIAL-CLASSEDUCATION | SOCIAL-CLASSOCCUPATION | |||
|---|---|---|---|---|
| VARIABLES | WORKING-CLASS | MIDDLE/UPPER-CLASS | WORKING-CLASS | MIDDLE/UPPER-CLASS |
| 1. N | 1247 | 923 | 952 | 850 |
| 2. Gender | ||||
| Female | 86.69% | 86.13% | 86.24% | 86.82% |
| Male | 11.95% | 11.38% | 12.39% | 11.18% |
| Not specified | 0.48% | 0.87% | 0.53% | 0.94% |
| Self-description | 0.88% | 1.62% | 0.84% | 1.06% |
| 3. Year | ||||
| First | 36.65% | 40.30% | 37.39% | 38.82% |
| Second | 37.77% | 34.24% | 36.35% | 35.53% |
| Third | 25.58% | 25.46% | 26.26% | 25.65% |
[i] Note: In social-classEducation, participants were on average 20.37 years old (SD = 3.41, min = 17, max = 56), and the social-classOccupation average was 20.42 years old (SD = 3.55, min = 17, max = 56).
Table 2
Variables depending on social-classEducation (N = 2170), social-classOccupation (N = 1802).
| SOCIAL-CLASSEDUCATION | SOCIAL-CLASSOCCUPATION | |||||||||
|---|---|---|---|---|---|---|---|---|---|---|
| VARIABLES | WORKING-CLASS | MIDDLE/UPPER-CLASS | T(DF) | P | COHEN’S D [95% CI] | WORKING-CLASS | MIDDLE/UPPER-CLASS | T(DF) | P | COHEN’S D[95% CI] |
| 1. Digital Equipment | ||||||||||
| Desktop computer | ||||||||||
| - Access | 405 (32.5%) | 308 (33.4%) | –0.44 (1978.93) | .663 | –0.02 [–0.10; 0.07] | 305 (32.0%) | 291 (34.2%) | –0.99 (1769.99) | .323 | –0.05 [–0.14; 0.05] |
| - Number | 1.53 (0.83) | 1.57 (0.91) | –0.94 (1886.51) | .347 | –0.04 [–0.13; 0.04] | 1.53 (0.83) | 1.59 (0.90) | –1.53 (1731.33) | .126 | –0.07 [–0.17; 0.02] |
| - Users | 1.66 (1.12) | 1.69 (1.17) | –0.56 (1933.98) | .579 | –0.02 [–0.11; 0.06] | 1.68 (1.14) | 1.72 (1.20) | –0.72 (1752.73) | .470 | –0.03 [–0.13; 0.06] |
| - Number/Users | 1.06 (0.55) | 1.08 (0.61) | –0.78 (1866.31) | .433 | –0.03 [–0.11; 0.05] | 1.06 (0.55) | 1.08 (0.62) | –0.77 (1499.10) | .444 | –0.04 [–0.13; 0.06] |
| Portable computer | ||||||||||
| - Access | 1221 (97.9%) | 910 (98.6%) | –1.21 (2142.74) | .228 | –0.02 [–0.10; 0.07] | 932 (97.9%) | 838 (98.6%) | –1.12 (1788.24) | .264 | –0.05 [–0.14; 0.04] |
| - Number | 2.69 (1.00) | 2.90 (1.11) | –4.58 (1871.43) | <.001*** | –0.20 [–0.28; 0.12] | 2.67 (0.99) | 2.88 (1.11) | –4.31 (1711.12) | <.001*** | –0.20 [–0.30; –0.11] |
| - Users | 2.12 (0.98) | 2.06 (0.95) | 1.60 (2021.95) | .109 | 0.07 [–0.02; 0.15] | 2.14 (0.97) | 2.05 (0.97) | 1.80 (1774.95) | .072 t | 0.09 [–0.01; 0.18] |
| - Number/Users | 1.53 (1.00) | 1.75 (1.21) | –4.39 (1763.68) | <.001*** | –0.20 [–0.28; 0.11] | 1.50 (0.98) | 1.75 (1.21) | –4.62 (1413.13) | <.001*** | –0.23 [–0.33; –0.14] |
| Tablet computer | ||||||||||
| - Access | 423 (33.9%) | 340 (36.8%) | –1.40 (1965.83) | .161 | –0.06 [–0.15; 0.02] | 315 (33.1%) | 318 (37.4%) | –1.92 (1764.71) | .055 t | –0.09 [–0.18; 0.00] |
| - Number | 1.54 (0.81) | 1.56 (0.83) | –0.67 (1973.59) | .505 | –0.03 [–0.11; 0.06] | 1.50 (0.78) | 1.59 (0.85) | –2.30 (1731.29) | .021* | –0.11 [–0.20; –0.02] |
| - Users | 1.46 (0.86) | 1.55 (0.98) | –2.28 (1832.25) | .023* | –0.10 [–0.19; –0.02] | 1.47 (0.87) | 1.55 (0.97) | –1.83 (1717.64) | .068 t | –0.09 [–0.18; 0.01] |
| - Number/Users | 1.14 (0.58) | 1.11 (0.55) | 1.21 (2041.07) | 0.226 | 0.05 [–0.03; 0.14] | 1.14 (0.58) | 1.11 (0.54) | 0.90 (1654.25) | .044* | 0.04 [–0.05; 0.14] |
| Mobile phone | ||||||||||
| - Access | 1237 (99.2%) | 913 (98.9%) | 0.66 (1809.13) | .507 | 0.03 [–0.06; 0.11] | 944 (99.2%) | 841 (98.9%) | 0.48 (1712.12) | .634 | 0.02 [–0.07; 0.12] |
| - Number | 3.24 (1.29) | 3.25 (1.32) | –0.16 (1960.02) | .876 | –0.01 [–0.09; 0.08] | 3.24 (1.29) | 3.28 (1.33) | –0.62 (1762.89) | .537 | –0.03 [–0.12; 0.06] |
| - Users | 2.05 (1.13) | 1.97 (1.09) | 1.63 (2030.58) | .104 | 0.07 [–0.02; 0.16] | 2.03 (1.13) | 2.01 (1.13) | 0.39 (1775.79) | .698 | 0.02 [–0.07; 0.11] |
| - Number/Users | 2.04 (1.42) | 2.11 (1.47) | –1.21 (1950.68) | .225 | –0.05 [–0.14; 0.03] | 2.05 (1.43) | 2.12 (1.48) | –1.06 (1580.97) | .288 | –0.05 [–0.15; 0.04] |
| Access to IC | 1225 (98.2%) | 907 (98.3%) | –0.05 (1995.80) | .957 | –0.00 [–0.09; 0.08] | 938 (98.5%) | 831 (97.8%) | 1.19 (1638.91) | .232 | 0.06 [–0.04; 0.15] |
| Access to HSI | 690 (55.3%) | 529 (57.3%) | –0.92 (1991.99) | .358 | –0.04 [–0.13; 0.05] | 543 (57.0%) | 486 (57.2%) | –0.06 (1777.26) | .953 | –0.00 [–0.10; 0.09] |
| 2. Material equipment | ||||||||||
| Desk to study | 1157 (92.8%) | 877 (95.0%) | –2.18 (2132.94) | .029* | –0.09 [–0.18; –0.01] | 882 (92.6%) | 810 (95.3%) | –2.37 (1784.02) | .018* | –0.11 [–0.20; –0.02] |
| Quiet place to study | 998 (80.0%) | 783 (84.8%) | –2.93 (2089.50) | .003** | –0.13 [–0.21; –0.04] | 744 (78.2%) | 736 (86.6%) | –4.74 (1788.94) | <.001*** | –0.22 [–0.31; –0.13] |
| 3. Digital use | ||||||||||
| f leisure activities | 5.21 (1.58) | 5.30 (1.55) | –1.31 (2011.21) | .190 | –0.06 [–0.14; 0.03] | 5.25 (1.58) | 5.28 (1.56) | –0.37 (1781.47) | .711 | –0.02 [–0.11; 0.08] |
| f university work | 6.32 (1.04) | 6.40 (0.99) | –1.93 (2038.48) | .054 t | –0.08 [–0.17; 0.00] | 6.30 (1.09) | 6.38 (1.03) | –1.71 (1794.65) | .088 t | –0.08 [–0.17; 0.01] |
| f information search | 4.91 (1.78) | 4.93 (1.81) | –0.23 (1966.74) | .815 | –0.01 [–0.10; 0.07] | 4.94 (1.77) | 4.96 (1.81) | –0.21 (1766.88) | .836 | –0.01 [–0.10; 0.08] |
| f staying in contact | 5.41 (1.63) | 5.50 (1.57) | –1.31 (2027.76) | .190 | –0.01 [–0.10; 0.07] | 5.40 (1.61) | 5.56 (1.50) | –2.09 (1797.11) | .037* | –0.10 [–0.19; –0.01] |
| 4. Self-construal | ||||||||||
| Independence | 5.61 (0.85) | 5.73 (0.78) | –3.23 (2067.19) | .001** | –0.14 [–0.22; –0.05] | 5.62 (0.83) | 5.75 (0.77) | –3.13 (1799.94) | .002** | –0.15 [–0.24; –0.05] |
| Interdependence | 4.60 (1.35) | 4.14 (1.36) | 7.90 (1976.60) | <.001*** | 0.34 [0.26; 0.43] | 4.67 (1.32) | 4.19 (1.35) | 7.60 (1762.85) | <.001*** | 0.36 [0.27; 0.45] |
| 5. Psychological factors | ||||||||||
| Sense of belonging | 4.56 (1.33) | 4.63 (1.22) | –1.31 (2069.31) | .191 | –0.06 [–0.14; 0.03] | 4.57 (1.30) | 4.66 (1.21) | –1.23 (1780.75) | .221 | –0.06 [–0.15; 0.03] |
| Self-efficacy | 4.56 (1.34) | 4.61 (1.36) | –0.76 (1972.52) | .448 | –0.03 [–0.12; 0.05] | 4.55 (1.35) | 4.64 (1.38) | –1.59 (1758.40) | .113 | –0.08 [–0.17; 0.02] |
| Intention to drop-out | 3.83 (1.83) | 3.50 (1.71) | 4.31 (2056.43) | <.001*** | 0.19 [0.10; 0.27] | 3.86 (1.83) | 3.43 (1.72) | 6.08 (1792.80) | <.001*** | 0.29 [0.19; 0.38] |
| 6. Class attendance | ||||||||||
| Attending online class | 5.89 (1.68) | 5.92 (1.64) | –0.43 (2007.05) | .669 | –0.02 [–0.10; 0.07] | 5.82 (1.74) | 5.91 (1.71) | –1.16 (1783.31) | .246 | –0.05 [–0.15; 0.04] |
| Being late for online class | 2.37 (1.67) | 2.41 (1.68) | –0.57 (1977.11) | .572 | –0.02 [–0.11; 0.06] | 2.41 (1.69) | 2.36 (1.65) | 0.61 (1786.87) | .541 | 0.03 [–0.06; 0.12] |
| Missing online class | 2.68 (1.77) | 2.67 (1.70) | 0.05 (2030.15) | .960 | 0.00 [–0.08; 0.09] | 2.69 (1.77) | 2.64 (1.70) | 0.64 (1790.24) | .525 | 0.03 [–0.06; 0.12] |
| Attending on-campus class | 2.44 (1.93) | 2.54 (1.98) | –1.15 (1957.70) | .249 | –0.05 [–0.14; 0.03] | 2.45 (1.97) | 2.49 (1.96) | –0.46 (1779.36) | .643 | –0.02 [–0.11; 0.07] |
| Being late for on-campus class | 1.62 (1.31) | 1.74 (1.41) | –2.00 (1900.97) | .045* | –0.09 [–0.17; –0.00] | 1.65 (1.36) | 1.76 (1.43) | –1.62 (1753.68) | .105 | –0.08 [–0.17; 0.02] |
| Missing on-campus class | 2.21 (1.98) | 2.11 (1.95) | 1.12 (2004.30) | .261 | 0.05 [–0.04; 0.13] | 2.27 (2.07) | 2.10 (1.91) | 1.75 (1798.30) | .080 t | 0.08 [–0.01; 0.17] |
| 7. Out-of-class behaviors | ||||||||||
| Individual homework | 4.76 (1.79) | 4.87 (1.87) | –1.29 (1938.48) | .197 | –0.06 [–0.14; 0.03] | 4.78 (1.83) | 4.88 (1.84) | –1.14 (1776.81) | .256 | –0.05 [–0.15; 0.04] |
| Group homework | 3.00 (1.89) | 2.92 (1.91) | 0.99 (1974.71) | .323 | 0.04 [–0.04; 0.13] | 2.96 (1.89) | 2.98 (1.92) | –0.30 (1769.96) | .767 | –0.01 [–0.11; 0.08] |
| Looking over class notes | 3.39 (1.73) | 3.30 (1.76) | 1.20 (1967.91) | .231 | 0.05 [–0.03; 0.14] | 3.38 (1.74) | 3.35 (1.74) | 0.43 (1776.88) | .668 | 0.02 [–0.07; 0.11] |
| Keeping up on readings | 3.15 (1.75) | 3.17 (1.76) | –0.24 (1978.61) | .808 | –0.01 [–0.10; 0.07] | 3.18 (1.75) | 3.19 (1.78) | –0.17 (1769.34) | .864 | –0.01 [–0.10; 0.08] |
| 8. Independent and other in-class behaviors | ||||||||||
| Asking questions | 2.70 (1.69) | 2.90 (1.70) | –2.70 (1980.12) | .007** | –0.12 [–0.20; –0.03] | 2.71 (1.67) | 2.93 (1.75) | –2.66 (1757.22) | .007** | –0.13 [–0.22; –0.03] |
| Participating in discussions | 2.99 (1.78) | 3.08 (1.78) | –1.23 (1982.74) | .220 | –0.05 [–0.14; 0.03] | 2.93 (1.75) | 3.14 (1.81) | –2.45 (1763.16) | .015* | –0.12 [–0.21; –0.02] |
| Answering questions | 3.28 (1.78) | 3.48 (1.75) | –2.66 (2002.40) | .008** | –0.12 [–0.20; –0.03] | 3.25 (1.76) | 3.51 (1.78) | –3.15 (1772.08) | .002** | –0.15 [–0.24; –0.06] |
| Switching camera on | 1.94 (1.46) | 2.21 (1.58) | –4.11 (1897.94) | <.001*** | –0.18 [–0.27; –0.10] | 1.91 (1.41) | 2.30 (1.65) | –5.26 (1680.03) | <.001*** | –0.25 [–0.34; –0.16] |
| Non-related activities | 4.27 (1.67) | 4.36 (1.63) | –1.23 (2010.86) | .219 | –0.05 [–0.14; 0.03] | 4.27 (1.66) | 4.36 (1.62) | –1.18 (1786.41) | .240 | –0.06 [–0.15; 0.04] |
| Taking notes | 4.99 (1.41) | 4.93 (1.41) | –0.31 (1996.25) | .757 | –0.01 [–0.10; 0.07] | 5.00 (1.44) | 4.94 (1.43) | 0.17 (1787.14) | .861 | 0.01 [–0.08; 0.10] |
| Listening/reading carefully | 5.73 (1.70) | 5.76 (1.68) | 1.03 (1989.26) | .302 | 0.04 [–0.04; 0.13] | 5.76 (1.73) | 5.74 (1.69) | 0.97 (1778.65) | .334 | 0.05 [–0.05; 0.14] |
[i] Note. Nyes (Percentages) for categorical variables, Means (Standard Deviations) for continuous variables. Statistical differences (using Welch’s t-test, Delacre et al., 2017) within variables are highlighted as follows: t p < .10; * p < .05; ** p < .01; *** p < .001. CI = confidence interval, IC = internet connection, HSI = high-speed internet, f = frequency.
Table 3
Correlations with confidence intervals for social-classEducation (N = 2170) and social-classOccupation (N = 1802).
| VARIABLE | 1 | 2 | 3 | 4 | 5 | 6 | 7 | |||||||
|---|---|---|---|---|---|---|---|---|---|---|---|---|---|---|
| 1. Social-class | ||||||||||||||
| 2. Independence | EDU | .07** | ||||||||||||
| [.03, .11] | ||||||||||||||
| OCC | .07** | |||||||||||||
| [.03, .12] | ||||||||||||||
| 3. Interdependence | EDU | –.17** | EDU | .21** | ||||||||||
| [–.21, –.13] | [.17, .25] | |||||||||||||
| OCC | –.18** | OCC | .21** | |||||||||||
| [–.22, –.13] | [.17, .26] | |||||||||||||
| 4. Sense of belonging | EDU | .03 | EDU | .17** | EDU | .05* | ||||||||
| [–.01, .07] | [.12, .21] | [.01, .09] | ||||||||||||
| OCC | .03 | OCC | .16** | OCC | .03 | |||||||||
| [–.02, .07] | [.11, .20] | [–.01, .08] | ||||||||||||
| 5. Self-efficacy | EDU | .02 | EDU | .12** | EDU | .00 | EDU | .29** | ||||||
| [–.03, .06] | [.08, .16] | [–.04, .04] | [.25, .33] | |||||||||||
| OCC | .04 | OCC | .10** | OCC | .00 | OCC | .28** | |||||||
| [–.01, .08] | [.05, .14] | [–.04, .05] | [.23, .32] | |||||||||||
| 6. Intention to drop-out | EDU | –.09** | EDU | –.19** | EDU | .01 | EDU | –.43** | EDU | –.41** | ||||
| [–.13, –.05] | [–.23, –.15] | [–.03, .05] | [–.47, –.40] | [–.44, –.37] | ||||||||||
| OCC | –.14** | OCC | –.17** | OCC | .03 | OCC | –.43** | OCC | –.41** | |||||
| [–.19, –.10] | [–.21, –.12] | [–.02, .07] | [–.47, –.39] | [–.45, –.37] | ||||||||||
| 7. Gender | EDU | –.01 | EDU | –.03 | EDU | –.03 | EDU | –.02 | EDU | –.01 | EDU | .01 | ||
| [–.05, .03] | [–.07, .01] | [–.07, .02] | [–.06, .02] | [–.05, .03] | [–.04, .05] | |||||||||
| OCC | –.02 | OCC | –.04 | OCC | –.02 | OCC | –.02 | OCC | –.01 | OCC | .01 | |||
| [–.06, .03] | [–.08, .01] | [–.07, .02] | [–.06, .03] | [–.06, .03] | [–.03, .06] | |||||||||
| 8. Year | EDU | –.02 | EDU | –.03 | EDU | –.03 | EDU | –.04 | EDU | –.07** | EDU | .08** | EDU | .01 |
| [–.07, .02] | [–.07, .02] | [–.07, .01] | [–.08, .00] | [–.11, –.03] | [.04, .12] | [–.03, .05] | ||||||||
| OCC | –.01 | OCC | –.01 | OCC | –.03 | OCC | –.05* | OCC | –.06* | OCC | .07** | OCC | .00 | |
| [–.06, .03] | [–.06, .03] | [–.07, .02] | [–.09, –.00] | [–.10, –.01] | [.03, .12] | [–.04, .05] | ||||||||
[i] Note: EDU and OCC are used to represent the samples for NEducation and NOccupation, respectively. Values in square brackets indicate the 95% confidence interval for each correlation. * indicates p < .05. ** indicates p < .01.
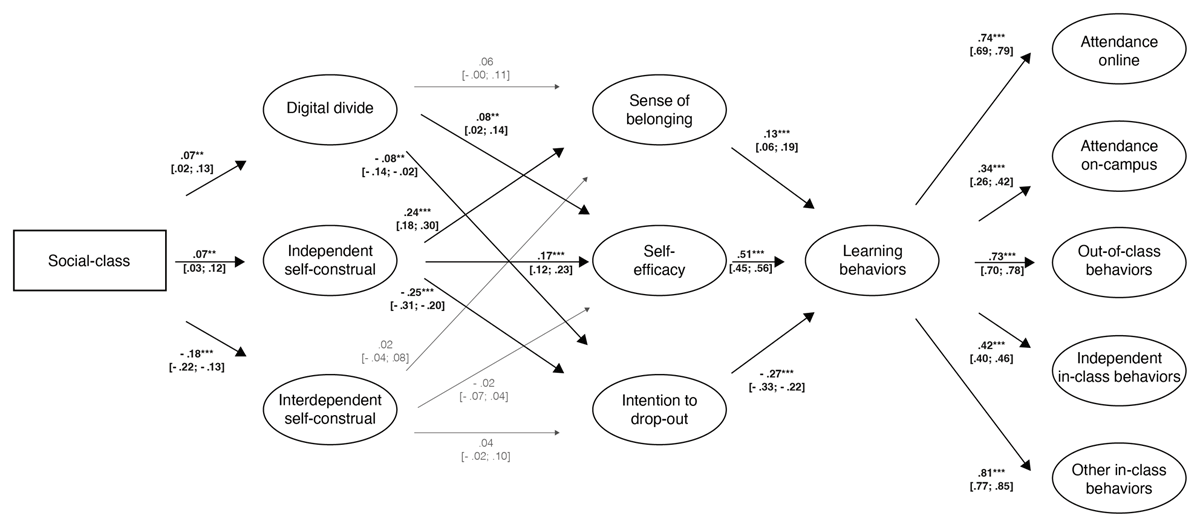
Figure 2
Structural equation model with standardized path coefficients and their confidence intervals in brackets. Significant statistical associations are highlighted in bold and indicated as follows: ** p < .01; *** p < .001.