
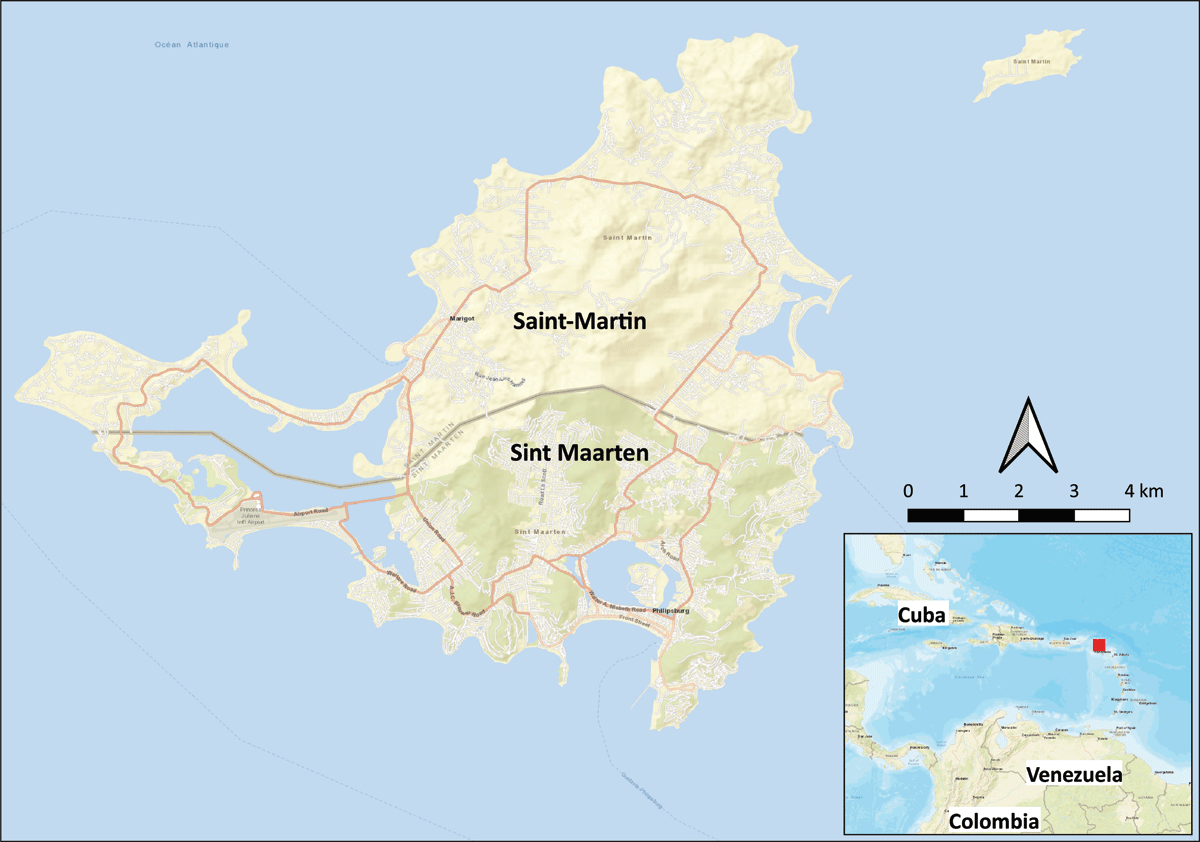
Figure 1
Map of Sint Maarten. The red rectangle in the inset map shows the position of Sint Maarten in the Caribbean. (Map source: Google Maps).
Table 1
Overview of key documents on FRM in Sint Maarten.
| FRM PHASE | SOURCES |
|---|---|
| Preparation | VROMI policy documents |
| Response | National Disaster Plan |
| Recovery | VROMI policy documents, yearly reports, and plans |
| Mitigation | VROMI policy documents, yearly reports, and Ministry plans |

Figure 2
An institutional statement represented in network format.

Figure 3
Different types of connections between institutional statements a) actor-driven marked in purple, b) outcome-driven marked in green, c) sanction-driven marked in red.
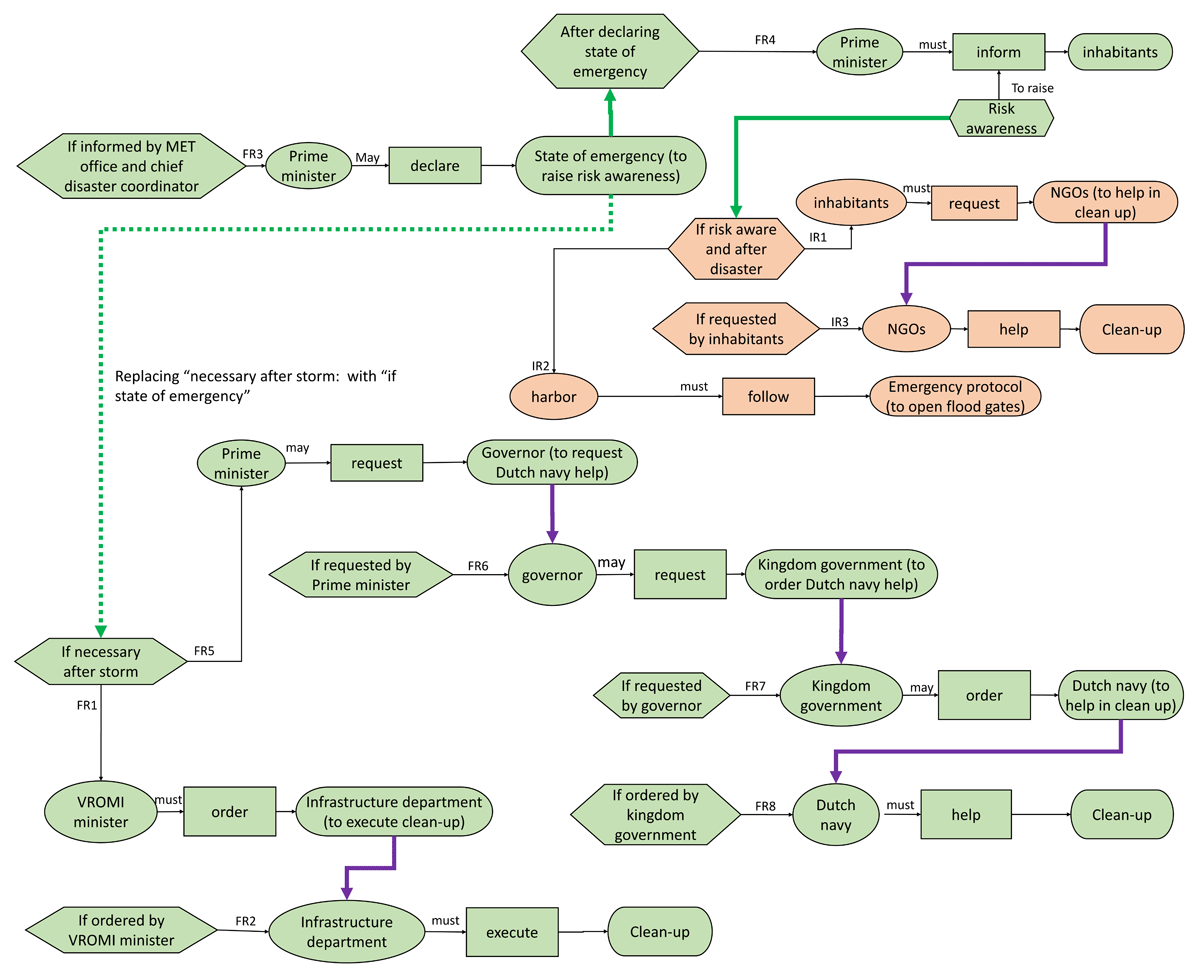
Figure 4
A network diagram illustrating the institutional environment of the response phase in FRM for cleaning up after a flood. The dotted arrow shows how filling a structural hole in the network can make the institutional environment more fluent in case of a disaster situation. The green and orange node colors indicate formal rules (FR) and informal rules (IR), respectively.

Figure 5
A network diagram of the private property development and permit situation reflecting a weak institutional environment.

Figure 6
A network diagram of the inspection action situation, reflecting a very weak institutional environment.
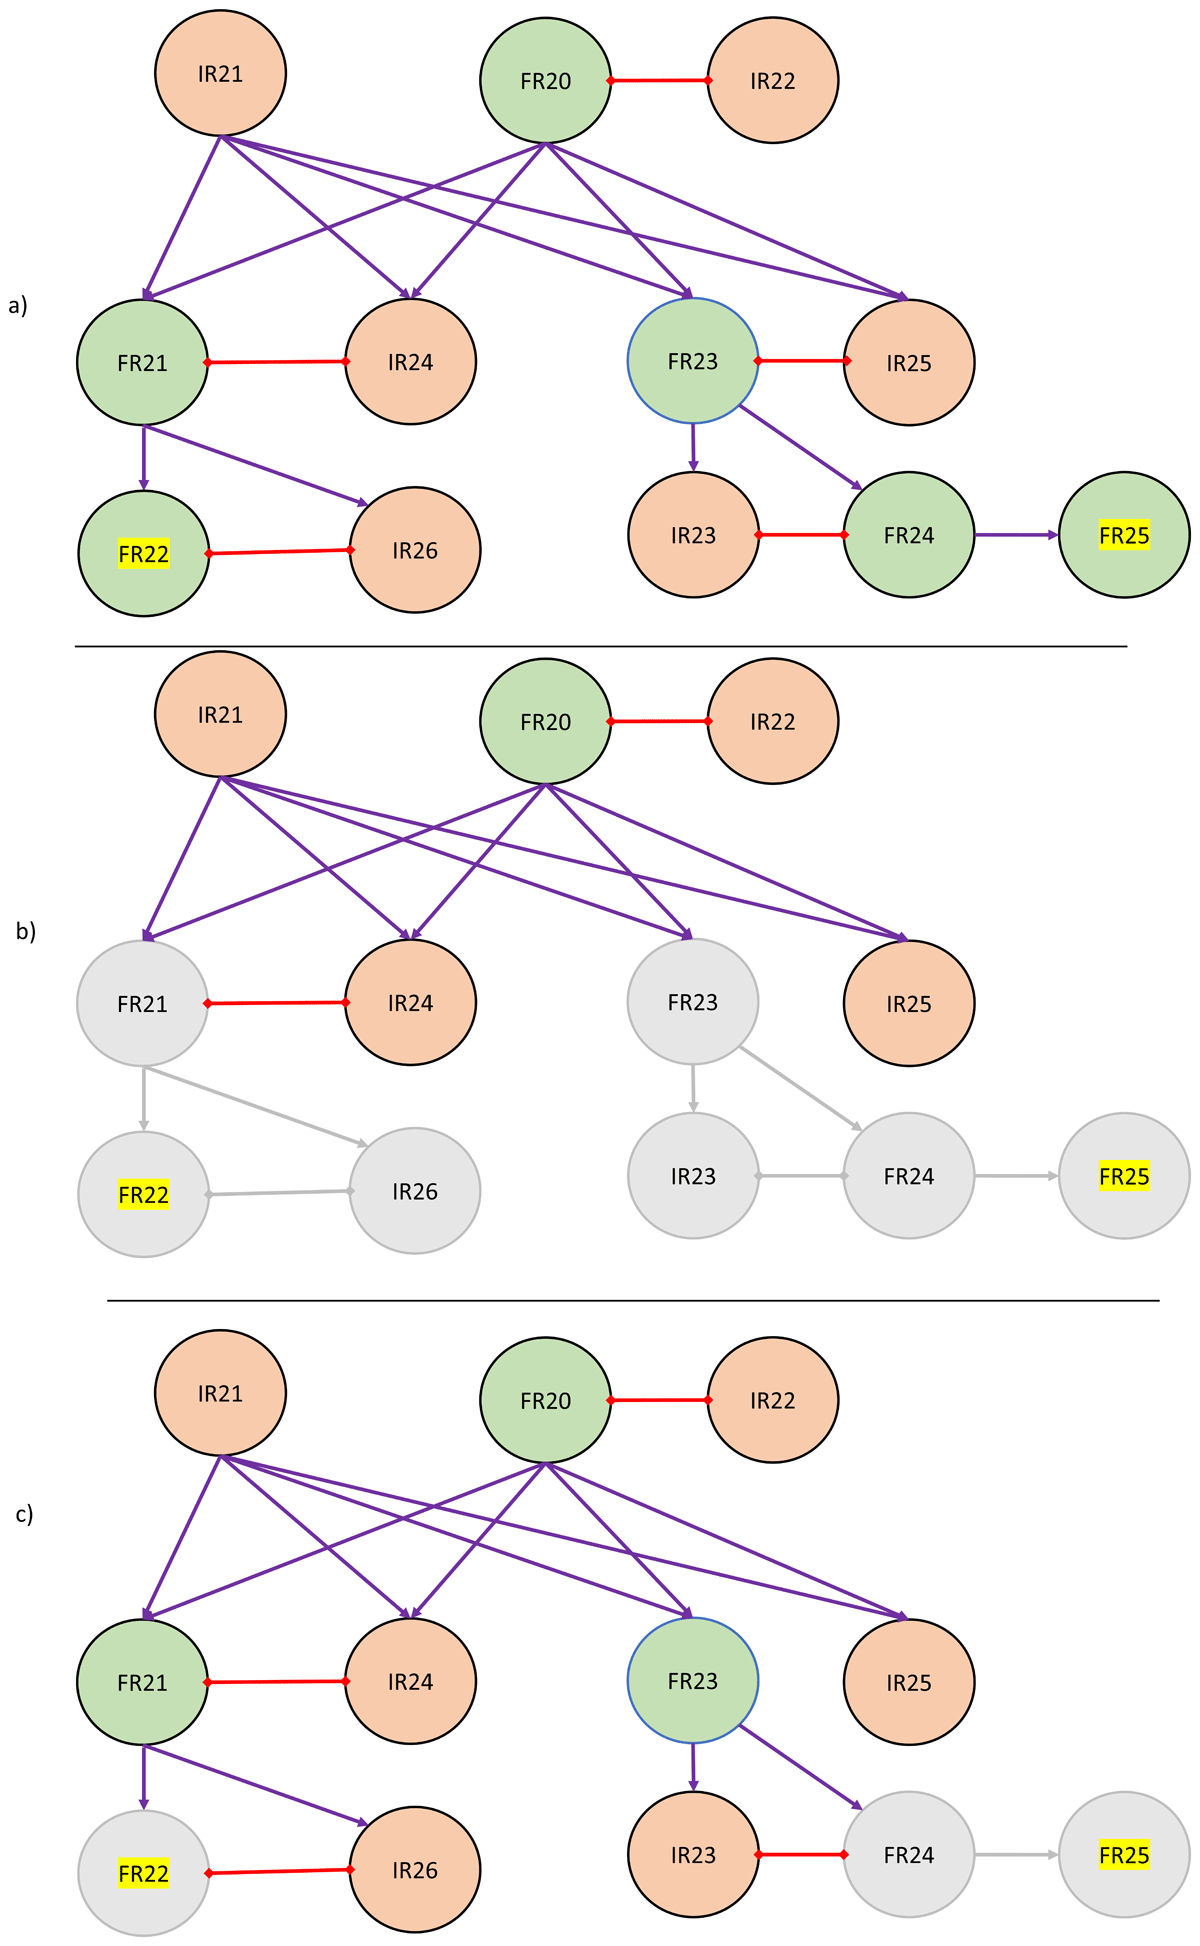
Figure 7
Statement level diagrams showing the inspection situation of the mitigation phase. The end goal of this action situation is permit revocation (FR22) or demolishing/fining (FR25) in case of violation. a) the whole institutional landscape, b) the institutional landscape when FR21 or F23 are not followed, and c) the institutional landscape when FR22 or FR24 are not followed. The grey nodes reflect the parts of the institutional landscape that became void as a result of non-compliance to a certain formal institution. Note: the discrepancies between statements are represented as red links with diamond-shaped arrows on both sides.