
Figure 1
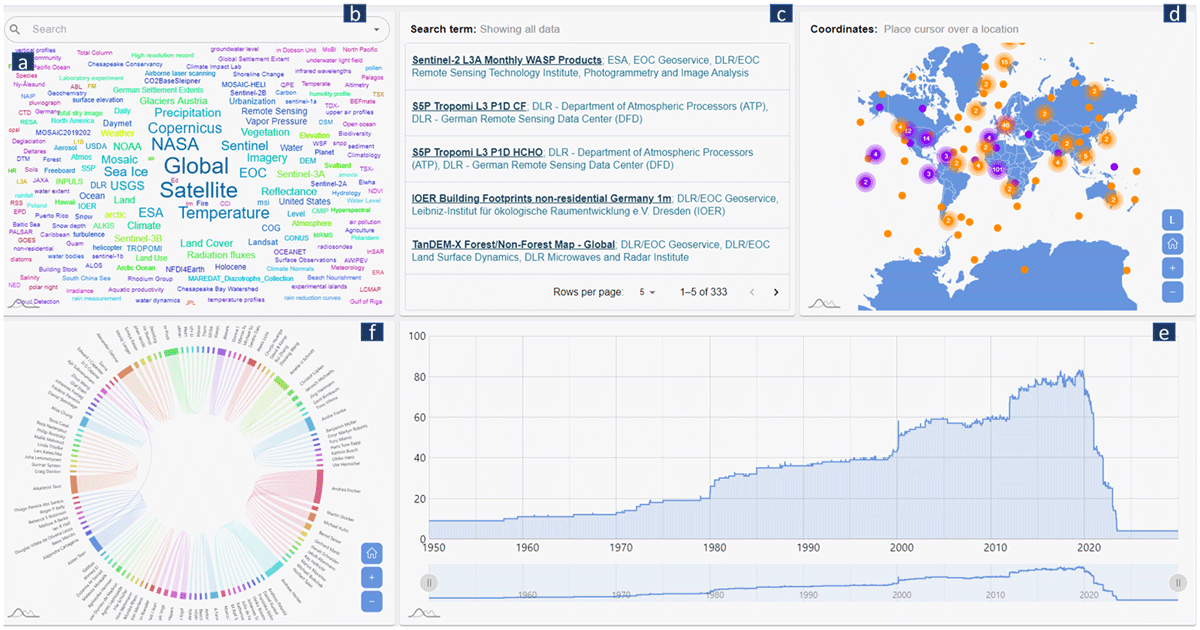
The frontend of VESA. Various visualizations help in multidimensional data search. They are: (a) word Cloud for contextual search, (b) autocomplete search bar also for contextual search, (c) list showing search results and links to the data sources, (d) map for spatial search, (e) line charts for temporal search, and (f) chord diagram showing common authorships.
Table 1
Mapping of analytical questions to metadata dimensions and corresponding visual representations.
| QUESTIONS | METADATA DIMENSIONS | EXAMPLE ATTRIBUTES | CHART TYPE (EXAMPLES) |
|---|---|---|---|
| What | Thematic/Context | keywords, variables, topics, categories | Word Cloud |
| When | Temporal | time ranges, time stamps, frequency | timeline, histograms |
| Where | Spatial | coordinates, regions, bounding boxes | map, heatmap |
| Who | Categories and Relationships | authors, institutes, projects | Treemap, Network graph |
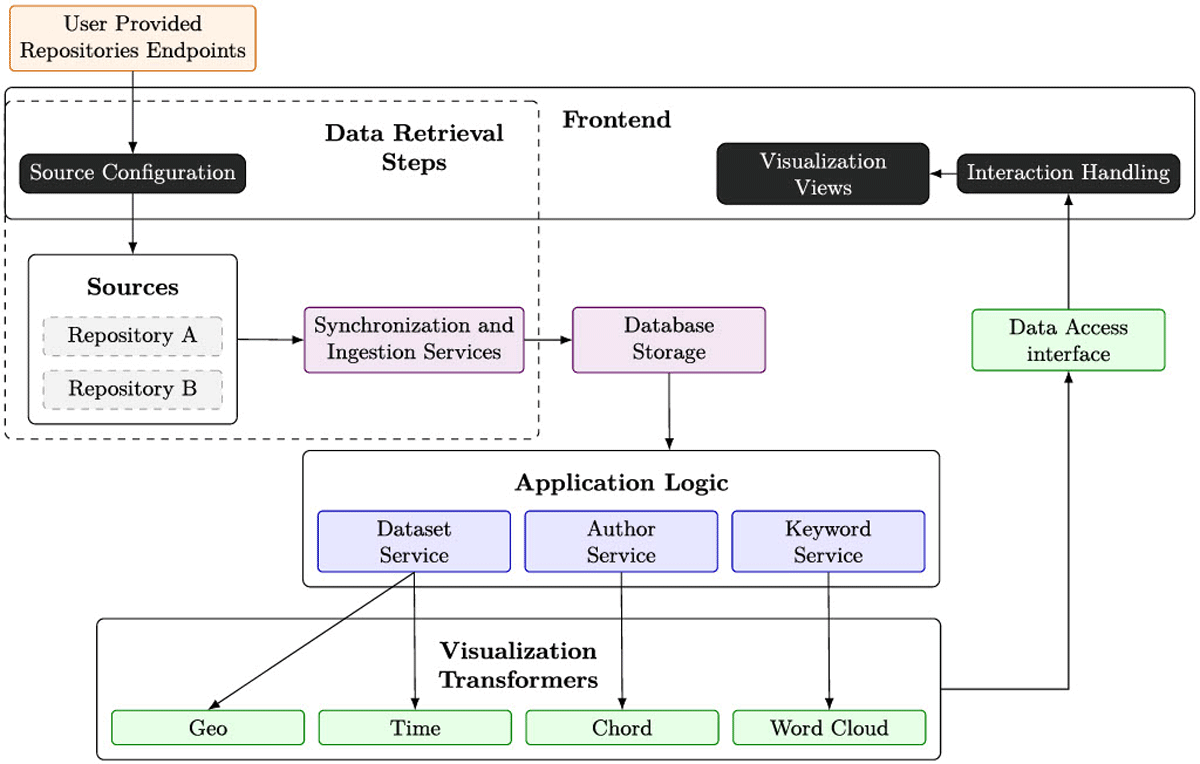
Figure 2
VESA Architecture.
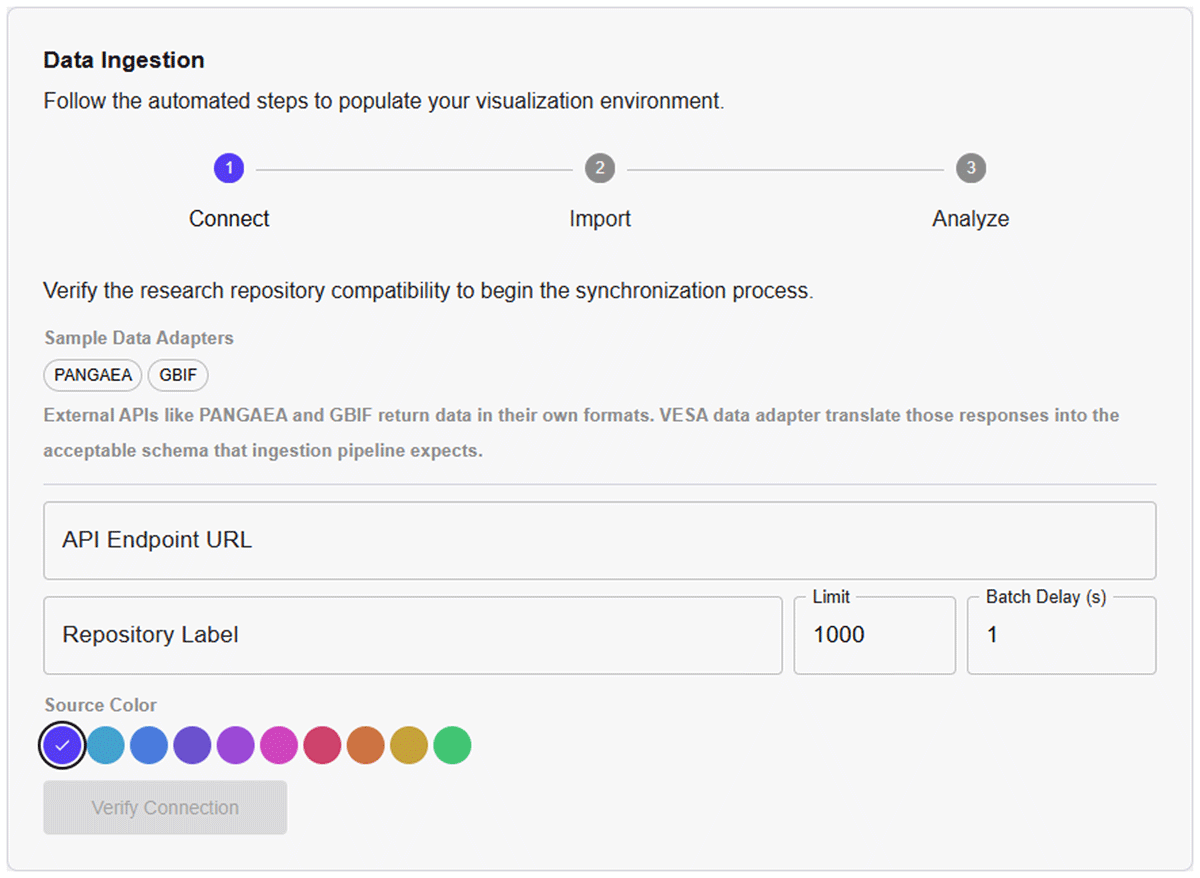
Figure 3
VESA’s Data Ingestion Pipeline. Currently, there are two built-in data adapters for PANGAEA and GBIF repositories for demo purposes. Repository label is a unique name of the data repository; Limit is the maximum number of datasets that need to be fetched. Batch Delay is the number of seconds a pipeline waits before fetching the next batch. Source Color is the assigned color to the repository that will appear in the Map’s Legend.
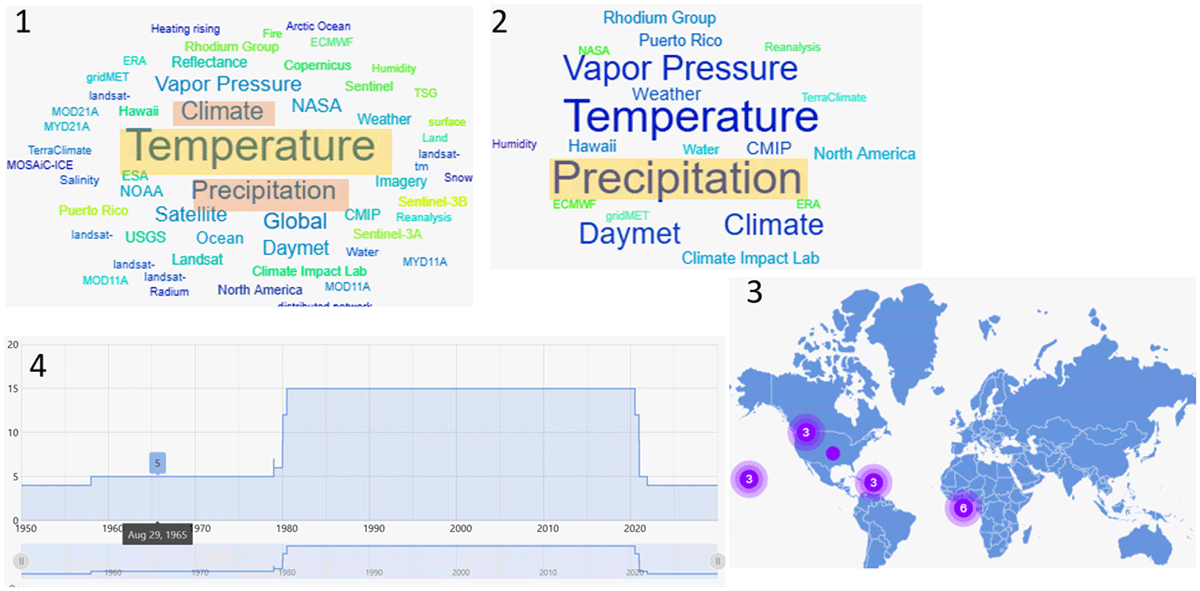
Figure 4
Screenshot from running the use case 1 on VESA.
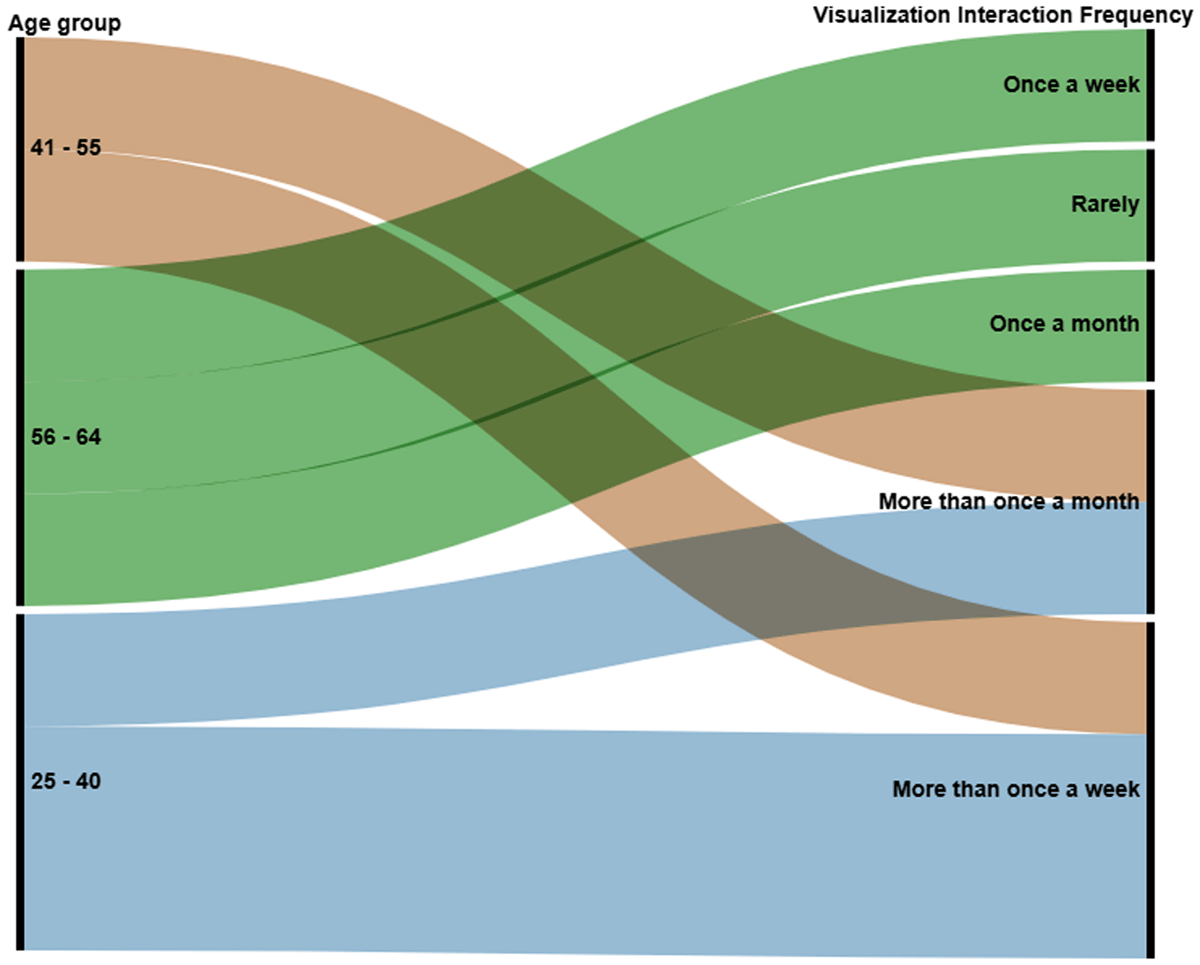
Figure 5
An alluvial diagram showing age group by visualization interaction frequency. The bands are layered by the number of respondents in each age group, with the highest frequency shown at the bottom.
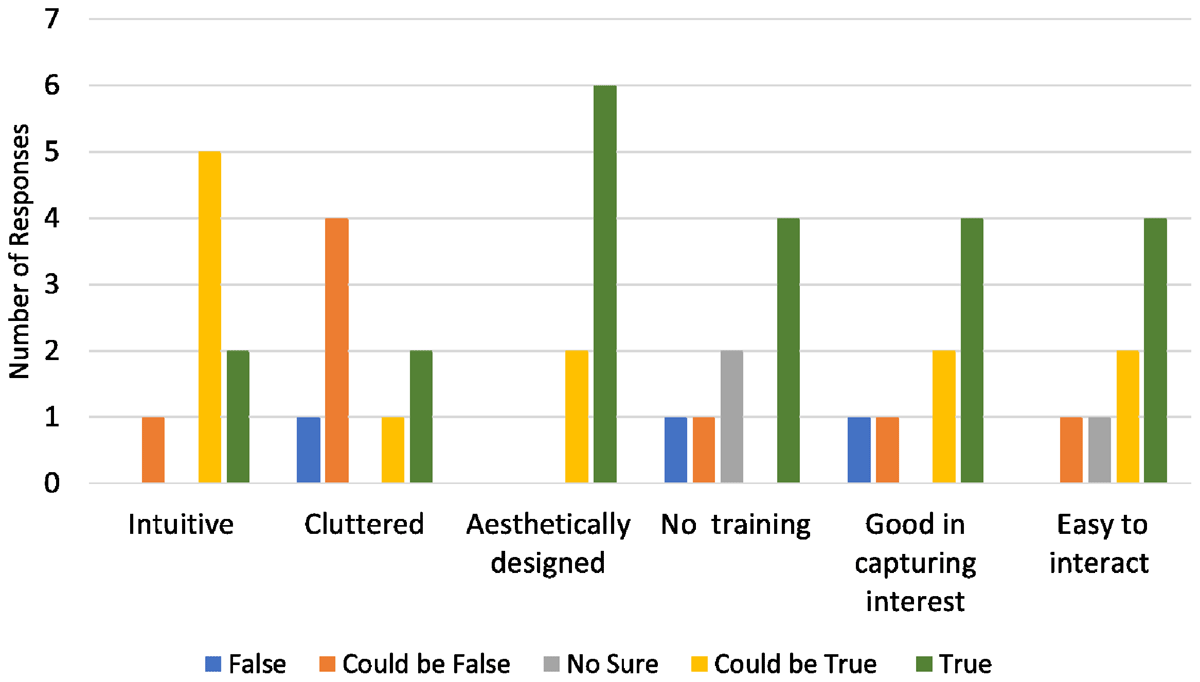
Figure 6
Results on evaluation of the VESA interface. The clustered bar chart shows user perception across six key dimensions: intuitiveness, interface being cluttered, aesthetically designed, no training needed, good in capturing interest, and easy to interact with.
Table 2
Evaluating VESA based on the derived guidelines. We scored it 1, 2, and 3, where 1 is all, based on whether it fulfills all, some, and none of the tasks in each requirement.
| REQUIREMENT | SCORE | EXPLANATION |
|---|---|---|
| Support for Lookup, Exploratory and Overview Tasks | 1 | VESA provides multidimensional exploration and overview of the datasets in store. It assists in lookup and exploration of the filtered datasets. |
| Multidimensional Search and Visualization | 1 | It provides visual search in four dimensions. |
| Configurable and Domain-Agnostic Functionality | 2 | Through adapter-based repository integration, VESA is domain-agnostic; however, it is not much configurable at the frontend. |
| User-Centric Design and Intuitive Interfaces | 2 | VESA has an intuitive design; however, more user studies need to be done for conformity and to enhance its usability. |
| Support for Sensemaking | 2 | Currently, it only supports Lookup, Exploration, and Overview tasks and does not summarize the search datasets. |
| FAIR Principle Alignment | 1 | It can be used for any repository and it assists in finding the datasets and provides the source data link. |
| Evaluation and Feedback Mechanisms Tools | 3 | No online and live evaluation and feedback mechanism are built in yet. |