
Table 1
Three regions’ demographic distributions.
| VARIABLES | UK | JP | TW | |
|---|---|---|---|---|
| Gender | Men | 45.2% | 50.3% | 48.4% |
| Women | 54.8% | 49.7% | 51.6% | |
| Age | 20–29 | 18.2% | 15.4% | 19.5% |
| 30–39 | 20.1% | 19.8% | 20.7% | |
| 40–49 | 22.2% | 27.0% | 24.1% | |
| 50–59 | 27.0% | 25.5% | 25.0% | |
| 60–64 | 12.5% | 12.4% | 10.7% | |
| Education | College graduate and above | 40.3% | 51.5% | 68.5% |
| Other | 59.7% | 48.5% | 31.5% | |
| Household income | Higher | 34.0% | 31.0% | 32.1% |
| Middle | 25.3% | 29.3% | 31.2% | |
| Lower | 33.8% | 26.6% | 32.7% | |
| Cannot answer | 6.9% | 13.1% | 4.0% |
[i] UK: n = 1,894; JP: n = 2,179; TW: n = 1,993.
Note: UK = United Kingdom; JP = Japan; TW = Taiwan.
Table 2
Factors (Attributes) and Levels.
| FACTORS (ATTRIBUTES) | LEVEL 1 | LEVEL 2 | LEVEL 3 |
|---|---|---|---|
| Number of daily new COVID-19 infections across the country | JP: Less than 2,000/UK: Less than 5,000/TW: Less than 20 | JP: Around 10,000/UK: Around 25,000/TW: Around 100 | JP: 50,000 or over/UK: 100,000 or over/TW: 400 or over |
| Holding of large-scale events | No restrictions on audience numbers | Able to be held with restrictions on audience numbers | Only able to be held without an audience |
| State of hospital beds in your local council area | Abundance of hospital beds | Approximately 50% occupation of hospital beds | Beds are stretched, and you cannot be admitted to hospital immediately |
| Someone infected near you | Nobody has been infected near you | Someone at work has been infected | Someone at home has been infected |
| Economic consequences near you | Nobody has lost their job near you because of COVID-19 | Friend has lost their job because of COVID-19 | Family member has lost their job because of COVID-19 |
| Living with family | Living alone | Living with someone (who is neither an older adult nor at high risk) | Living with someone (who is either an older adult or at high risk) |
| Employment | Able to work from home | Required to commute to an office | Work that has a lot of contact with people, such as medicine, care, and hospitality |
| COVID-19 vaccine | Unvaccinated | Vaccinated |
[i] Note: JP = Japan, UK = United Kingdom, TW = Taiwan. Each level of the factor of Number of daily new COVID-19 infections across the country in the three regions was set differently according to differences in the respective situation at the time. The common criteria were set as follows. Level 1 = Approximate number of daily new infections across the country at the first peak of the COVID-19 pandemic (spring 2020) in the region; Level 2 = Approximately five times that of Level 1; Level 3 = Approximately half of the largest number of infections per day experienced to the date of the survey administered in the region and approximately four to five times that of Level 2.
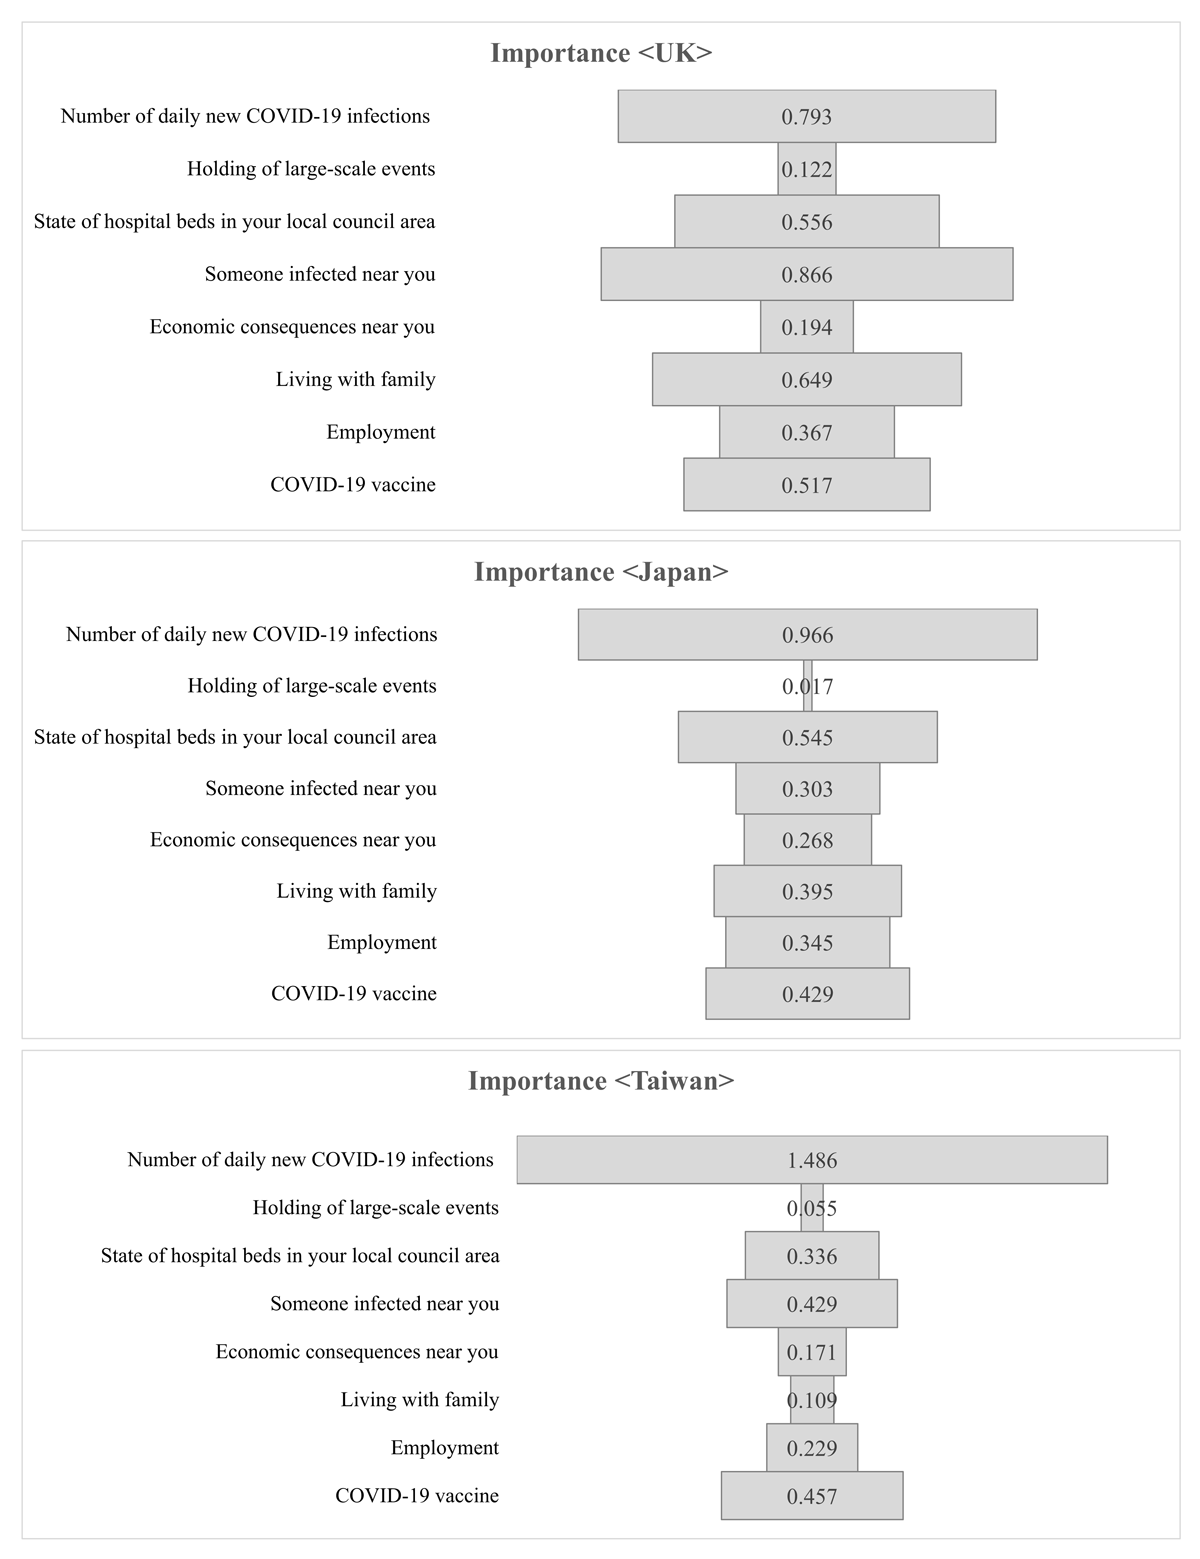
Figure 1
Importance (utility range) of factors of COVID-19 information.
Notes:
The factors are: Number of daily new COVID-19 infections across the country, Holding of large-scale events, State of hospital beds in your local council area, Someone infected near you, Economic consequences near you, Living with family, Employment; and COVID-19 vaccine.
See also Table 2.
Table 3
UK influence degree of factors and independent variables of each class.
| FACTORS | LEVELS | ADJUSTED COEFFICIENTS | UTILITY RANGE (IMPORTANCE) | |||||||
|---|---|---|---|---|---|---|---|---|---|---|
| CLASS 1 | CLASS 2 | CLASS 3 | CLASS 4 | CLASS 1 | CLASS 2 | CLASS 3 | CLASS 4 | |||
| Provided Information | Number of daily new COVID-19 infections | UK Less than 5,000 | –0.10 | –0.13 | –0.17 | –0.06 | 0.21 | 0.25 | 0.36 | 0.12 |
| UK Around 25,000 | –0.01 | 0.01 | –0.01 | 0.01 | ||||||
| UK 100,000 or over | 0.11 | 0.12 | 0.19 | 0.06 | ||||||
| Large-scale events | No restrictions on audience | –0.02 | –0.02 | –0.04 | 0.00 | 0.05 | 0.05 | 0.08 | 0.01 | |
| Restrictions on audience numbers | 0.00 | 0.00 | –0.01 | 0.00 | ||||||
| Without an audience | 0.03 | 0.03 | 0.04 | 0.01 | ||||||
| State of hospital beds | Plenty of hospital beds | –0.09 | –0.10 | –0.13 | –0.05 | 0.18 | 0.18 | 0.28 | 0.10 | |
| 50% of hospital beds | –0.01 | 0.02 | –0.03 | 0.01 | ||||||
| Cannot be admitted to hospital immediately | 0.10 | 0.08 | 0.15 | 0.04 | ||||||
| Someone infected near you | Nobody infected | –0.11 | –0.17 | –0.17 | –0.06 | 0.23 | 0.32 | 0.33 | 0.14 | |
| Someone at work infected | 0.00 | 0.02 | 0.02 | –0.02 | ||||||
| Someone at home infected | 0.11 | 0.15 | 0.15 | 0.08 | ||||||
| Economic consequences near you because of COVID-19 | Nobody has lost their job | –0.03 | –0.02 | –0.06 | 0.00 | 0.06 | 0.03 | 0.10 | 0.00 | |
| Friend has lost their job | 0.00 | 0.00 | 0.02 | 0.00 | ||||||
| Family member has lost their job | 0.03 | 0.01 | 0.04 | 0.00 | ||||||
| Living with family | Living alone | –0.08 | –0.09 | –0.12 | –0.05 | 0.18 | 0.25 | 0.30 | 0.12 | |
| Living with someone (not elderly or high risk) | –0.03 | –0.08 | –0.06 | –0.02 | ||||||
| Living with elderly or high risk | 0.10 | 0.16 | 0.18 | 0.07 | ||||||
| Employment | Able to work from home | –0.04 | –0.08 | –0.11 | –0.03 | 0.10 | 0.19 | 0.23 | 0.06 | |
| Required to commute | –0.01 | –0.03 | –0.01 | 0.00 | ||||||
| Work lots of contact with people | 0.05 | 0.11 | 0.12 | 0.03 | ||||||
| COVID-19 vaccine | Unvaccinated | 0.07 | 0.11 | 0.09 | 0.03 | 0.14 | 0.21 | 0.19 | 0.06 | |
| Vaccinated | –0.07 | –0.11 | –0.09 | –0.03 | ||||||
| Covariates | Gender | Men | 0.09 | –0.10 | –0.12 | 0.12 | ||||
| Women | –0.09 | 0.10 | 0.12 | –0.12 | ||||||
| Age | 20–29 | 0.28 | –0.05 | –0.09 | –0.13 | |||||
| 30–39 | 0.24 | 0.23 | 0.04 | –0.51 | ||||||
| 40–49 | 0.24 | 0.23 | 0.04 | –0.51 | ||||||
| 50–59 | –0.09 | –0.09 | –0.03 | 0.22 | ||||||
| 60–64 | –0.09 | –0.09 | –0.03 | 0.22 | ||||||
| Educational level | Lower | 0.00 | 0.01 | 0.04 | –0.05 | |||||
| Higher (College graduates or higher) | 0.00 | –0.01 | –0.04 | 0.05 | ||||||
| Household Income | Low | –0.08 | 0.22 | –0.21 | 0.07 | |||||
| Mid | 0.17 | –0.02 | 0.05 | –0.20 | ||||||
| High | –0.09 | –0.20 | 0.16 | 0.14 | ||||||
| Vaccine status | Others | 0.16 | 0.12 | 0.07 | –0.36 | |||||
| Vaccine hesitancy | –0.16 | –0.12 | –0.07 | 0.36 | ||||||
| Health numeracy | 0.00 | 0.03 | 0.01 | –0.03 | ||||||
| Science literacy | 0.00 | 0.05 | 0.01 | –0.06 | ||||||
| Cautious habitual behaviors | –0.07 | 0.18 | 0.11 | –0.23 | ||||||
| Risk taking habitual behaviors | 0.02 | –0.10 | –0.01 | 0.09 | ||||||
| Trust in government measures against COVID-19 | 0.02 | –0.04 | 0.01 | 0.01 | ||||||
| Trust in medical institutions’ measures against COVID-19 | –0.04 | 0.14 | 0.00 | –0.11 | ||||||
| Constant | 1.32 | –3.22 | –1.20 | 3.10 | ||||||
| R2 | 0.14 | 0.10 | 0.12 | 0.10 | ||||||
| N (Total 1,505) | 512 | 465 | 383 | 145 | ||||||
Table 4
UK compositions of the subgroups (four classes).
| CLASS 1 | CLASS 2 | CLASS 3 | CLASS 4 | ||
|---|---|---|---|---|---|
| Class sizes | 34.08% | 30.82% | 25.34% | 9.76% | |
| Average values of evaluation on 18 conjoint cards | 5.94 | 8.95 | 7.90 | 3.56 | |
| Age | 20–29 | 25.71% | 13.22% | 17.41% | 24.12% |
| 30–39 | 23.67% | 19.36% | 20.13% | 13.63% | |
| 40–49 | 20.47% | 22.22% | 23.39% | 26.37% | |
| 50–59 | 20.94% | 31.13% | 26.99% | 24.03% | |
| 60–64 | 9.21% | 14.08% | 12.07% | 11.85% | |
| Gender | Men | 51.06% | 43.65% | 41.88% | 49.62% |
| Women | 48.94% | 56.35% | 58.12% | 50.38% | |
| Household Income | Low | 31.21% | 40.56% | 26.93% | 40.91% |
| Mid | 31.56% | 27.30% | 28.07% | 20.03% | |
| High | 37.23% | 32.14% | 45.01% | 39.06% | |
| Educational level | Lower | 57.56% | 59.05% | 57.82% | 62.18% |
| Higher (College graduates or higher) | 42.44% | 40.95% | 42.18% | 37.82% | |
| Vaccine status | Others | 93.36% | 96.82% | 94.97% | 75.47% |
| Vaccine hesitency | 6.64% | 3.18% | 5.03% | 24.53% | |
| Health numeracy (Average valuie) | 5.00 | 5.42 | 5.04 | 4.66 | |
| Science literacy (Average value) | 6.69 | 7.28 | 6.86 | 6.34 | |
| Trust in government measures against COVID-19(Average value) | 13.21 | 12.88 | 13.44 | 11.75 | |
| Trust in medical institutions’ measures againt COVID-19 (Average value) | 15.58 | 17.39 | 16.27 | 13.30 | |
| Cautious habitual behaviors (Average value) | 10.48 | 12.04 | 11.64 | 8.87 | |
| Risktaking habitual behaviors (Average value) | 9.47 | 7.50 | 8.89 | 9.79 | |
| N = 1,505 | |||||
Table 5
Summary of UK subgroup (class) characteristics.
| SUBGROUP | POSSIBLE INTERPRETATIONS | RISK-AVERSE BEHAVIOUR FREQUENCY (AVERAGE VALUES OF DEPENDENT VARIABLES) | RESPONDENT’S CHARACTERISTICS | CHARACTERISTICS OF THE UTILITY RANGE OF CONJOINT EXPERIMENT |
|---|---|---|---|---|
| Class 1 | Moderate | Moderate | Yonger age | Moderate utility ranges in all the factors |
| Class 2 | Prudent | High | Higher age, higher educational level, higher health numeracy, higher science literacy, higher trust in medical institutions, cautious habitual behaviors | Moderate utility ranges in all the factors |
| Class 3 | Government Supporter | Moderate | Women, higher income, higher trust in government measures | Relatively higher utility rages in all the factors |
| Class 4 | Risk-taking | Low | Younger age, men, vaccine hesitancy, lower trust in government measures, lower health numeracy, lower science literacy, lower trust in medical institutions, risk-taking havitual behaviours | Lower utility ranges in all the factors |
Table 6
Japan influence degree of factors and independent variables of each class.
| FACTORS | LEVELS | ADJUSTED COEFFICIENTS | UTILITY RANGE (IMPORTANCE) | |||||||
|---|---|---|---|---|---|---|---|---|---|---|
| CLASS 1 | CLASS 2 | CLASS 3 | CLASS 4 | CLASS 1 | CLASS 2 | CLASS 3 | CLASS 4 | |||
| Provided Information | Number of daily new COVID-19 infections | JP Less than 2,000 | –0.25 | –0.25 | –0.30 | –0.11 | 0.45 | 0.50 | 0.58 | 0.21 |
| JP Around 10,000 | 0.05 | 0.01 | 0.02 | 0.01 | ||||||
| JP 50,000 or over | 0.20 | 0.24 | 0.28 | 0.10 | ||||||
| Large-scale events | No restrictions on audience | 0.00 | –0.02 | 0.01 | 0.00 | 0.10 | 0.03 | 0.02 | 0.01 | |
| Restrictions on audience numbers | –0.05 | 0.00 | –0.01 | 0.00 | ||||||
| Without an audience | 0.05 | 0.01 | –0.01 | 0.01 | ||||||
| State of hospital beds | Plenty of hospital beds | –0.14 | –0.13 | –0.17 | –0.04 | 0.30 | 0.30 | 0.41 | 0.09 | |
| 50% of hospital beds | –0.02 | –0.04 | –0.07 | –0.01 | ||||||
| Cannot be admitted to hospital immediately | 0.16 | 0.17 | 0.24 | 0.05 | ||||||
| Someone infected near you | Nobody infected | –0.12 | –0.08 | –0.13 | –0.02 | 0.18 | 0.15 | 0.26 | 0.04 | |
| Someone at work infected | 0.06 | 0.01 | 0.00 | 0.00 | ||||||
| Someone at home infected | 0.06 | 0.07 | 0.13 | 0.02 | ||||||
| Economic consequences near you because of COVID-19 | Nobody has lost their job | –0.03 | –0.05 | –0.11 | –0.02 | 0.06 | 0.10 | 0.20 | 0.04 | |
| Friend has lost their job | 0.01 | 0.00 | 0.03 | 0.00 | ||||||
| Family member has lost their job | 0.03 | 0.05 | 0.08 | 0.02 | ||||||
| Living with family | Living alone | –0.09 | –0.08 | –0.12 | –0.03 | 0.25 | 0.21 | 0.32 | 0.07 | |
| Living with someone (not elderly or high risk) | –0.07 | –0.05 | –0.08 | –0.01 | ||||||
| Living with elderly or high risk | 0.16 | 0.13 | 0.20 | 0.04 | ||||||
| Employ-ment | Able to work from home | –0.12 | –0.07 | –0.15 | –0.01 | 0.30 | 0.16 | 0.37 | 0.05 | |
| Required to commute | –0.06 | –0.03 | –0.08 | –0.02 | ||||||
| Work lots of contact with people | 0.18 | 0.09 | 0.22 | 0.03 | ||||||
| COVID-19 vaccine | Unvaccinated | 0.14 | 0.08 | 0.17 | 0.03 | 0.28 | 0.15 | 0.33 | 0.06 | |
| Vaccinated | –0.14 | –0.08 | –0.17 | –0.03 | ||||||
| Covariates | Gender | Men | –0.26 | 0.19 | –0.18 | 0.24 | ||||
| Women | 0.26 | –0.19 | 0.18 | –0.24 | ||||||
| Age | 20–29 | –0.14 | 0.03 | –0.01 | 0.12 | |||||
| 30–39 | 0.01 | 0.13 | –0.03 | –0.12 | ||||||
| 40–49 | 0.01 | 0.13 | –0.03 | –0.12 | ||||||
| 50–59 | –0.01 | –0.04 | –0.04 | 0.09 | ||||||
| 60–64 | –0.01 | –0.04 | –0.04 | 0.09 | ||||||
| Educational level | Lower | 0.05 | –0.09 | 0.02 | 0.02 | |||||
| Higher (College graduates or higher) | –0.05 | 0.09 | –0.02 | –0.02 | ||||||
| Household Income | Low | 0.07 | –0.11 | –0.11 | 0.15 | |||||
| Mid | –0.09 | 0.12 | 0.06 | –0.09 | ||||||
| High | 0.02 | 0.00 | 0.05 | –0.06 | ||||||
| Vaccine status | Others | 0.15 | 0.02 | 0.08 | –0.25 | |||||
| Vaccine hesitancy | –0.15 | –0.02 | –0.08 | 0.25 | ||||||
| Health numeracy | 0.01 | 0.01 | 0.03 | –0.05 | ||||||
| Science literacy | 0.04 | –0.05 | 0.00 | 0.02 | ||||||
| Cautious habitual behaviors | 0.30 | –0.08 | 0.03 | –0.24 | ||||||
| Risk taking habitual behaviors | –0.16 | 0.05 | –0.05 | 0.16 | ||||||
| Trust in government measures against COVID-19 | –0.04 | 0.02 | –0.01 | 0.04 | ||||||
| Trust in medical institutions’ measures against COVID-19 | 0.10 | –0.01 | 0.08 | –0.17 | ||||||
| Constant | –3.91 | 1.33 | –0.97 | 3.55 | ||||||
| R2 | 0.12 | 0.18 | 0.18 | 0.06 | ||||||
| N (Total 1,571) | 476 | 470 | 439 | 186 | ||||||
Table 7
Japan compositions of the subgroups (four classes).
| CLASS 1 | CLASS 2 | CLASS 3 | CLASS 4 | ||
|---|---|---|---|---|---|
| Class sizes | 30.52% | 30.08% | 27.61% | 11.79% | |
| Average values of evaluation on 18 conjoint cards | 9.27 | 6.59 | 8.27 | 4.18 | |
| Age | 20–29 | 11.17% | 17.65% | 14.96% | 21.70% |
| 30–39 | 18.39% | 24.30% | 19.02% | 21.32% | |
| 40–49 | 28.13% | 26.08% | 27.45% | 28.52% | |
| 50–59 | 28.66% | 22.00% | 25.47% | 17.36% | |
| 60–64 | 13.66% | 9.97% | 13.10% | 11.10% | |
| Gender | Men | 43.15% | 66.43% | 48.46% | 67.49% |
| Women | 56.85% | 33.57% | 51.54% | 32.51% | |
| Household income | Low | 32.04% | 24.81% | 26.68% | 36.94% |
| Mid | 31.18% | 38.75% | 36.20% | 30.97% | |
| High | 36.78% | 36.45% | 37.11% | 32.09% | |
| Educational level | Lower | 49.97% | 38.51% | 46.68% | 46.40% |
| Higher (College graduates or higher) | 50.03% | 61.49% | 53.32% | 53.60% | |
| Vaccine status | Others | 93.49% | 90.27% | 92.25% | 77.73% |
| Vaccine hesitency | 6.51% | 9.73% | 7.75% | 22.27% | |
| Health numeracy (Average valuie) | 6.68 | 6.61 | 6.73 | 6.18 | |
| Science literacy (Average value) | 6.60 | 6.21 | 6.45 | 6.14 | |
| Trust in government measures against COVID-19(Average value) | 11.90 | 11.81 | 12.22 | 10.18 | |
| Trust in medical institutions’ measures againt COVID-19 (Average value) | 14.83 | 13.68 | 14.73 | 11.25 | |
| Cautious habitual behaviors (Average value) | 13.50 | 12.56 | 12.98 | 11.77 | |
| Risktaking habitual behaviors (Average value) | 5.55 | 6.89 | 6.09 | 7.91 | |
| N = 1,571 | |||||
Table 8
Summary of Japan subgroup (class) characteristics.
| SUBGROUP | POSSIBLE INTERPRETATIONS | RISK-AVERSE BEHAVIOUR FREQUENCY (AVERAGE VALUES OF DEPENDENT VARIABLES) | RESPONDENT’S CHARACTERISTICS | CHARACTERISTICS OF THE UTILITY RANGE OF CONJOINT EXPERIMENT |
|---|---|---|---|---|
| Class 1 | Prudent | High | Higer age, women, higher science literacy, higher trust in government measures, higher trust in medical institutions measures, cautious habitual behaviours | Moderate utility ranges in all the factors |
| Class 2 | Simple | Moderate | Men, higher educational level | Generally have lower utility ranges but has a simple, higher utility ranges in the factor of numbers as well as hospital beds |
| Class 3 | Government Supporter | Moderate | Women, higher household income, hgiher health numeracy, higher trust in govenmental measures | Higher utility ranges in all the factors, especially in Numbers, Beds, and Vaccine |
| Class 4 | Risk-taking | Low | Yonger age, men, lower household income, vaccine hesitency, lower health numeracy, lower science literacy, lower trust in government measures, lower trust in medical institutions measures, risk-taking habitual behaviors | Lower utility ranges in all the factors |
Table 9
Taiwan influence degree of factors and independent variables of each class.
| FACTORS | LEVELS | ADJUSTED COEFFICIENTS | UTILITY RANGE (IMPORTANCE) | |||||||
|---|---|---|---|---|---|---|---|---|---|---|
| CLASS 1 | CLASS 2 | CLASS 3 | CLASS 4 | CLASS 1 | CLASS 2 | CLASS 3 | CLASS 4 | |||
| Provided Information | Number of daily new COVID-19 infections | TW Less than 20 | –0.43 | –0.39 | –0.31 | –0.14 | 0.83 | 0.80 | 0.65 | 0.26 |
| TW Around 100 | 0.03 | –0.02 | –0.02 | 0.01 | ||||||
| TW 400 or over | 0.40 | 0.41 | 0.34 | 0.13 | ||||||
| Large-scale events | No restrictions on audience | 0.02 | 0.01 | 0.00 | 0.00 | 0.06 | 0.06 | 0.01 | 0.00 | |
| Restrictions on audience numbers | –0.04 | –0.04 | 0.00 | 0.00 | ||||||
| Without an audience | 0.02 | 0.03 | 0.01 | 0.00 | ||||||
| State of hospital beds | Plenty of hospital beds | –0.09 | –0.08 | –0.06 | –0.02 | 0.15 | 0.21 | 0.16 | 0.04 | |
| 50% of hospital beds | 0.02 | –0.04 | –0.03 | –0.01 | ||||||
| Cannot be admitted to hospital immediately | 0.07 | 0.12 | 0.09 | 0.03 | ||||||
| Someone infected near you | Nobody infected | –0.20 | –0.13 | –0.11 | –0.03 | 0.32 | 0.23 | 0.19 | 0.06 | |
| Someone at work infected | 0.09 | 0.03 | 0.03 | 0.00 | ||||||
| Someone at home infected | 0.11 | 0.10 | 0.08 | 0.03 | ||||||
| Economic consequences near you because of COVID-19 | Nobody has lost their job | –0.03 | –0.05 | –0.03 | –0.01 | 0.07 | 0.08 | 0.06 | 0.02 | |
| Friend has lost their job | –0.02 | 0.03 | 0.01 | 0.01 | ||||||
| Family member has lost their job | 0.05 | 0.02 | 0.02 | 0.00 | ||||||
| Living with family | Living alone | –0.08 | –0.06 | –0.04 | –0.01 | 0.12 | 0.11 | 0.07 | 0.02 | |
| Living with someone (not elderly or high risk) | 0.04 | 0.01 | 0.01 | –0.01 | ||||||
| Living with elderly or high risk | 0.04 | 0.05 | 0.03 | 0.01 | ||||||
| Employ-ment | Able to work from home | –0.14 | –0.09 | –0.05 | –0.02 | 0.26 | 0.19 | 0.11 | 0.04 | |
| Required to commute | 0.01 | –0.01 | –0.02 | –0.01 | ||||||
| Work lots of contact with people | 0.13 | 0.10 | 0.07 | 0.02 | ||||||
| COVID-19 vaccine | Unvaccinated | 0.10 | 0.12 | 0.07 | 0.05 | 0.20 | 0.25 | 0.15 | 0.09 | |
| Vaccinated | –0.10 | –0.12 | –0.07 | –0.05 | ||||||
| Covariates | Gender | Men | –0.16 | –0.20 | 0.05 | 0.30 | ||||
| Women | 0.16 | 0.20 | –0.05 | –0.30 | ||||||
| Age | 20–29 | 0.01 | –0.09 | –0.10 | 0.18 | |||||
| 30–39 | 0.09 | 0.04 | –0.09 | –0.05 | ||||||
| 40–49 | 0.09 | 0.04 | –0.09 | –0.05 | ||||||
| 50–59 | –0.07 | 0.23 | 0.05 | –0.20 | ||||||
| 60–64 | –0.07 | 0.23 | 0.05 | –0.20 | ||||||
| Educational level | Lower | 0.08 | –0.03 | –0.04 | 0.00 | |||||
| Higher (College graduates or higher) | –0.08 | 0.03 | 0.04 | 0.00 | ||||||
| Household Income | Low | 0.12 | –0.05 | –0.03 | –0.04 | |||||
| Mid | 0.07 | 0.04 | 0.08 | –0.19 | ||||||
| High | –0.19 | 0.01 | –0.05 | 0.23 | ||||||
| Vaccine status | Others | 0.15 | 0.28 | –0.09 | –0.34 | |||||
| Vaccine hesitancy | –0.15 | –0.28 | 0.09 | 0.34 | ||||||
| Health numeracy | 0.01 | 0.01 | –0.02 | 0.00 | ||||||
| Science literacy | 0.04 | 0.05 | –0.05 | –0.03 | ||||||
| Cautious habitual behaviors | 0.19 | 0.03 | –0.13 | –0.09 | ||||||
| Risk taking habitual behaviors | –0.08 | 0.00 | 0.04 | 0.04 | ||||||
| Trust in government measures against COVID-19 | 0.01 | 0.02 | 0.01 | –0.03 | ||||||
| Trust in medical institutions’ measures against COVID-19 | 0.03 | –0.01 | –0.04 | 0.02 | ||||||
| Constant | –2.28 | –0.69 | 2.17 | 0.80 | ||||||
| R2 | 0.17 | 0.19 | 0.20 | 0.14 | ||||||
| N (Total 1,574) | 563 | 501 | 333 | 177 | ||||||
Table 10
Taiwan compositions of the subgroups (four classes).
| CLASS 1 | CLASS 2 | CLASS 3 | CLASS 4 | ||
|---|---|---|---|---|---|
| Class sizes | 35.59% | 31.95% | 21.04% | 11.42% | |
| Average values of evaluation on 18 conjoint cards | 9.26 | 8.00 | 6.11 | 5.62 | |
| Age | 20–29 | 18.76% | 18.84% | 20.01% | 25.54% |
| 30–39 | 22.62% | 22.70% | 20.58% | 21.12% | |
| 40–49 | 22.30% | 30.02% | 24.10% | 19.64% | |
| 50–59 | 26.84% | 19.11% | 26.32% | 20.78% | |
| 60–64 | 9.47% | 9.33% | 8.99% | 12.92% | |
| Gender | Men | 44.66% | 45.55% | 55.59% | 68.27% |
| Women | 55.34% | 54.45% | 44.41% | 31.73% | |
| Household Income | Low | 35.74% | 28.49% | 31.78% | 30.76% |
| Mid | 33.45% | 33.56% | 35.91% | 27.22% | |
| High | 30.81% | 37.96% | 32.31% | 42.02% | |
| Educational level | Lower | 32.67% | 25.33% | 29.72% | 27.35% |
| Higher (College graduates or higher) | 67.33% | 74.67% | 70.28% | 72.65% | |
| Vaccine status | Others | 96.21% | 97.30% | 93.87% | 91.73% |
| Vaccine hesitency | 3.79% | 2.70% | 6.13% | 8.27% | |
| Health numeracy (Average valuie) | 6.51 | 6.57 | 6.17 | 6.48 | |
| Science literacy (Average value) | 7.27 | 7.37 | 6.87 | 7.18 | |
| Trust in government measures against COVID-19 (Average value) | 14.88 | 14.64 | 14.00 | 13.68 | |
| Trust in medical institutions’ measures againt COVID-19 (Average value) | 16.65 | 16.30 | 15.62 | 15.82 | |
| Cautious habitual behaviors (Average value) | 13.17 | 12.87 | 12.38 | 12.51 | |
| Risktaking habitual behaviors (Average value) | 8.13 | 9.06 | 9.35 | 9.49 | |
| N = 1,574 | |||||
Table 11
Summary of Taiwan subgroup (class) characteristics.
| SUBGROUP | POSSIBLE INTERPRETATIONS | RISK-AVERSE BEHAVIOUR FREQUENCY (AVERAGE VALUES OF DEPENDENT VARIABLES) | RESPONDENT’S CHARACTERISTICS | CHARACTERISTICS OF THE UTILITY RANGE OF CONJOINT EXPERIMENT |
|---|---|---|---|---|
| Class 1 | Prudent | High | Higher age, women, higher trust in government measures, higher trust in medical institutions’ measures, cautious habitual behaviours | Higher utility ranges but has a exclusive higher utility range in the factor of Numbers |
| Class 2 | Simple | Moderate to high | Moiddle age, women, higher education level, higher health numeracy, higher science literacy | Moderate to high utility ranges but has a exclusive higher utility range in the factor of Numbers |
| Class 3 | Stray | Moderate | Men, lower health numeracy, lower science literacy, lower trust in government measures, lower trust in medical institutional measures | Moderate utility ranges but has a simple, exclusive wider utility range in the factor of Numbers |
| Class 4 | Risk-taking | Low | Yonger age, men, vaccine hesitency, lower trust in government measures, and risk-taking habitual behaviours | Lower utility ranges in all the factors |