
Introduction
The threat of health risks from new infectious diseases has been a challenge throughout human history. The COVID-19 pandemic has caused significant health, economic, and social damage worldwide. The issue of new infectious diseases in modern society is affected by the outcomes of the infectious diseases and people’s behaviour in response to the influence of culture and policy in the country and disseminated information.
During the pandemic, experts emphasised the importance of the message, ‘fear rightly and act rightly’ (Terada, 1948), and government officials and experts frequently disseminated information such as the number of new cases per day, the level of bed congestion, and vaccination updates. Citizens decide whether to take preventive actions against the spread of infection by considering such information and their circumstances (e.g., whether they live with older adults or alone, whether they have a job that allows them to work remotely, or whether they have been vaccinated). Although many experts are interested in the manner in which disseminated information and individuals’ circumstances influence citizens’ behavioural change, there are countless combinations of these variables, making it almost impossible to empirically investigate when considering all such factors. The current study attempts to tackle this issue by extracting primary factors and obtaining approximating solutions incorporating a conjoint experiment with an orthogonal design (see Appendix 1).
This approach can provide clearer visions of behavioural change related to new infectious diseases through empirical evidence regarding how expert information provision regarding a new infectious disease and citizens’ respective situations jointly affect their behaviours during the pandemic. The current study reports results from the United Kingdom (UK), Japan (JP), and Taiwan (TW) based on identically-designed survey data. Consequently, the observed effects can be explored regarding cultural differences and similarities.
This study aims to provide fundamental information that contributes to medical policy and public health development concerning new infectious diseases by reporting the empirical results of an international comparative survey of risk-averse behaviour determinants in the context of the COVID-19 pandemic. This study established two goals: (1) to examine how the context of COVID-19 information elicited risk-averse behaviours by empirically identifying the relative most important variables among such information, and (2) to extract subgroups that shared similar patterns of risk-averse behaviour during the pandemic by statistically examining interactions of respondents’ attributes and the information provided on risk-averse behaviours.
For the above two purposes, the current study conceptualised ‘Information’ that affects people’s decision-making by categorising it into (a) content composed of several factors, and (b) factors composed of several levels or degrees. Based on this conceptualisation, an experimental method capable of presenting information regarding the COVID-19 situation including the above factors and levels and assessing decision-making responses to risk-averse behaviours was applied. Therefore, a conjoint experiment (Louviere, 1988; Rao, 2014) was incorporated into the survey design to quantitatively measure the degree of risk-averse behaviour to multiple combinations of factors and levels. A conjoint experiment is a method that prepares several cards (information) that include a hypothetical scenario comprising multiple factors and categories (levels) of each factor to present to respondents and statistically demonstrates which combinations of factors and levels influence people’s decision-making.
Regarding the relationship between information on the COVID-19 situation and risk-averse behaviour, the factors refer to the elements of information disseminated by experts and governments, such as ‘number of daily new COVID-19 infections across the country’ or ‘restrictions on audience numbers in large-scale events’; surrounding information, such as ‘the urgency related to the number of available hospital beds’ or ‘whether people at one’s workplace are infected’; and individual information, such as ‘whether vaccinated or unvaccinated’. The levels refer to the degree or kinds of such factors. For instance, the levels of the factor of ‘number of daily new COVID-19 infections across the country’ can be set as 5,000 or approximately 25,000, and 100,000. The levels of the factor of ‘the urgency related to the number of available hospital beds’ can be set as ‘Plenty of hospital beds’, ‘Approximately 50% occupation of hospital beds’, ‘Beds are stretched, and you cannot be admitted to hospital immediately.’ By setting such experimental conditions, the combination of important factors and levels that are the determinants of risk-averse behaviours can be statistically identified to reveal the determinants of decision-making related to new infectious diseases (See also Appendix 1 and Appendix 2).
Previous studies have identified that engaging in risk-averse behaviour prevents the spread of the COVID-19 infection (e.g., Gao et al., 2020). Therefore, the current study quantitatively explores which factors people place the most importance on when engaging in risk-averse behaviour in response to different combinations of various information and situations related to COVID-19 and what characteristics are observed in subgroups with similar behavioural tendencies. The results can provide essential evidence for preparing for new pandemics in the future.
Few empirical studies deal with the relationship between information related to COVID-19 and behavioural changes such as taking risk-averse behaviour. For example, many papers published in the 2020s at the beginning of the spread of the COVID-19 infection mainly focus on qualitative considerations of risk awareness of new infectious diseases (Cori et al., 2020). Later, empirical studies gradually emerged, such as those utilising social big data from travel booking sites to examine the relationship between the published number of infections and individuals’ travel-related decisions (Ito et al., 2022; Im et al., 2021; Omori et al., 2024). Ito et al. (2022) have identified that the paucity of empirical studies on this issue might be due to a lack of suitable methods to observe decision-making for future behaviour. The current study fills this gap by incorporating a conjoint experiment method capable of assessing peoples’ decision-making regarding hypothetical situations.
People’s risk-averse behaviour regarding the COVID-19 pandemic has been investigated worldwide based on social surveys (Bergeot and Jusot, 2024; Dai et al., 2022; Rayani et al., 2021) and international comparative surveys (Dryhurst et al., 2020). Such studies have identified that people who perceived greater risks were more likely to have more frequent risk-averse behaviours during the COVID-19 pandemic (Bruine de Bruin and Bennett, 2020). Further, some studies have explored risk-averse behaviour in conjunction with psychological aspects including trust in government or medical professionals (Schneider et al., 2021).
Several social science studies regarding COVID-19 have incorporated conjoint experiments; however, most are choice experiments focusing on the specific condition of a region dealing with triage, who deserves immediate healthcare (Reeskens et al., 2021), or willingness to accept vaccination concerning COVID-19, (Wang et al., 2023; Igarashi et al., 2022), thus, their focus and set conditions are different from that of the current study.
Further, by clustering people with similar behavioural decision-making in response to the information, the current study pays unique attention to people’s scientific knowledge. How the general scientific knowledge or science literacy of the public influences their attitudinal change regarding provided information has been a critical issue in the fields of science and risk communication (Kato-Nitta et al., 2019; Simis et al., 2016). People use available information for attitudinal decision-making toward the application of novel science to their everyday lives (Finucane et al., 2002; Slovic et al., 1981). The traditional ‘deficit model’ framework proposes that higher ‘proper’ scientific knowledge among the public leads to a ‘proper’ response to the information; accordingly, people’s science literacy should have some influence on clustering people into subgroups when considering the relationships of COVID-19 information and risk-averse behaviour.
As Marivate and Combrink’s (2020) case study on using data to inform South Africa’s COVID-19 response claimed, enabling the public to engage with open data during a pandemic is significant. They also emphasised that prioritising data management practices by getting feedback from the public who use such information is a proactive approach that helps prepare for the future risks. Considering this, the current study empirically examining how data influences people’s public health behaviours in the different regions by focusing on the intersection of data science and cultural contexts should elucidate the manner in which different communities would interpret and respond to health information in varying ways. By doing so, it should contribute to the previous discussion on cultural differences in risk perceptions (Schaller and Murray, 2010; van Doren et al., 2024). It further extends the previous literature (Kato-Nitta et al., 2023) exploring how understanding and application of data can be shaped by regional, cultural, and societal contexts, and is thus relevant to not only medical experts but also data managers related to science, technology, and health.
This study aims to answer the following two research questions.
RQ1: How did the public evaluate information regarding the COVID-19 pandemic when deciding whether to engage in risk-averse behaviours?
RQ2: Do subgroups share characteristics of risk-averse behaviour regarding information on COVID-19? If so, how are they segmented in conjunction with people’s attributes and their scientific knowledge?
The current study explores the above two research questions by focusing on three regions—the UK, Japan, and Taiwan—selected for their similarities as high-income economies (above $13,205 GNI per capita) according to the World Bank (2023) and being insular states capable of undertaking relatively strict border measures. This approach enables us to examine the statistical results about whether regional or cultural similarities are observed, while broadly controlling for economic and geographical conditions.
Methods
Data
This study used data from web-based surveys focusing on regional comparative studies in the UK, Japan, and Taiwan. The surveys were entrusted to a Japan-based member company of Gallup International, with experience in administering international surveys. The surveys in the UK, Japan, and Taiwan were administered in 2022 from February 15th to February 22nd, March 7th to March 9th, and February 16th to February 25th, respectively. The surveys employed a uniform survey design across the three regions with a target population aged 20–64 years. To mitigate possible sampling bias inherent in volunteer online panels, sample allocation was made in proportion to regional size, gender, and age: Japan, n = 2,757, as per the Japan National Population Census October 2020; UK, n = 2,624, as per the Office for National Statistics, Mid-Year Population Estimates June 2020; and Taiwan, n = 2,606, as per the Directorate-General of Budget, Accounting and Statistics, National Statistics, Republic of China (Taiwan), Population by 5-year Age Group, October 2021.
To secure the data’s reliability and internal consistency, we excluded ‘satisficers’ or participants with inappropriate behaviour indicating low cognitive effort in answering questions (Krosnick, 1991; Maniaci and Rogge, 2014; Inagaki et al., 2021; Tourangeau et al., 2013) (For criteria of excluding satisficers in the current study, See Appendix 3). Participants who did not answer the items (variables) used in the statistical analyses were also excluded listwise. The exclusion criteria were identical for all three regions. The final number of survey participants was 1,894, 2,129, and 1,993 for the UK, Japan, and Taiwan, respectively. Table 1 lists each region’s survey demographics.
Table 1
Three regions’ demographic distributions.
| VARIABLES | UK | JP | TW | |
|---|---|---|---|---|
| Gender | Men | 45.2% | 50.3% | 48.4% |
| Women | 54.8% | 49.7% | 51.6% | |
| Age | 20–29 | 18.2% | 15.4% | 19.5% |
| 30–39 | 20.1% | 19.8% | 20.7% | |
| 40–49 | 22.2% | 27.0% | 24.1% | |
| 50–59 | 27.0% | 25.5% | 25.0% | |
| 60–64 | 12.5% | 12.4% | 10.7% | |
| Education | College graduate and above | 40.3% | 51.5% | 68.5% |
| Other | 59.7% | 48.5% | 31.5% | |
| Household income | Higher | 34.0% | 31.0% | 32.1% |
| Middle | 25.3% | 29.3% | 31.2% | |
| Lower | 33.8% | 26.6% | 32.7% | |
| Cannot answer | 6.9% | 13.1% | 4.0% |
[i] UK: n = 1,894; JP: n = 2,179; TW: n = 1,993.
Note: UK = United Kingdom; JP = Japan; TW = Taiwan.
Data from the Organization for Economic Co-operation and Development (OECD, 2021) reveal that the rate of tertiary attainment of the population aged 25–64 years was approximately 50% in the UK and 55% in Japan. Therefore, the educational level of survey respondents from Japan was relatively aligned with OECD statistics, but the survey respondents from the UK exhibited relatively lower educational levels. According to the report from the Taiwanese Ministry of Education (2021/2022), the net enrolment ratio of tertiary education in Taiwan in 2020 was approximately 72%. Owing to the inherent nature of the survey respondent group comprising voluntary registrants operated by a survey company, the distribution of educational attainment in each country was not fully concordant with that of the respective population. However, the relative ordering of the distribution rate of education in the current data (TW > JP > UK) is concordant with that of the population.
Measures and analyses
Conjoint experimental design
This study employed a conjoint experimental design (Louviere, 1988; Rao, 2014). Respondents were provided with information regarding various hypothetical social situations occurring during the COVID-19 pandemic and asked to indicate the degree of risk-avoidance behaviour they would perform in each situation. A typical conjoint experiment design presents information to respondents as ‘cards’ comprising sets of factors (attributes) and level combinations. In the current study, the factors included social and individual situations, such as the number of daily new COVID-19 infections across the country, the number of available hospital beds in the local council area, and COVID-19 vaccination status. Furthermore, the levels representing each factor’s degree were established; for example, less than 5000, approximately 25,000, and 100,000 or over regarding the number of daily new COVID-19 infections.
Table 2 presents details regarding the factors and levels thereof.
Table 2
Factors (Attributes) and Levels.
| FACTORS (ATTRIBUTES) | LEVEL 1 | LEVEL 2 | LEVEL 3 |
|---|---|---|---|
| Number of daily new COVID-19 infections across the country | JP: Less than 2,000/UK: Less than 5,000/TW: Less than 20 | JP: Around 10,000/UK: Around 25,000/TW: Around 100 | JP: 50,000 or over/UK: 100,000 or over/TW: 400 or over |
| Holding of large-scale events | No restrictions on audience numbers | Able to be held with restrictions on audience numbers | Only able to be held without an audience |
| State of hospital beds in your local council area | Abundance of hospital beds | Approximately 50% occupation of hospital beds | Beds are stretched, and you cannot be admitted to hospital immediately |
| Someone infected near you | Nobody has been infected near you | Someone at work has been infected | Someone at home has been infected |
| Economic consequences near you | Nobody has lost their job near you because of COVID-19 | Friend has lost their job because of COVID-19 | Family member has lost their job because of COVID-19 |
| Living with family | Living alone | Living with someone (who is neither an older adult nor at high risk) | Living with someone (who is either an older adult or at high risk) |
| Employment | Able to work from home | Required to commute to an office | Work that has a lot of contact with people, such as medicine, care, and hospitality |
| COVID-19 vaccine | Unvaccinated | Vaccinated |
[i] Note: JP = Japan, UK = United Kingdom, TW = Taiwan. Each level of the factor of Number of daily new COVID-19 infections across the country in the three regions was set differently according to differences in the respective situation at the time. The common criteria were set as follows. Level 1 = Approximate number of daily new infections across the country at the first peak of the COVID-19 pandemic (spring 2020) in the region; Level 2 = Approximately five times that of Level 1; Level 3 = Approximately half of the largest number of infections per day experienced to the date of the survey administered in the region and approximately four to five times that of Level 2.
There are seven attributes with three levels each and one attribute with two levels. Therefore, the total number of combinations of attributes and levels was 4,374. The study applied Taguchi’s L18 Orthogonal array (Hisam et al., 2024; Yang et al., 2008; Kacker et al., 1991; Mitra, 2011; Taguchi, 1977; 2010; Taguchi and Konishi, 1959; Taguchi, 1987), enabling us to produce an equivalent result with just 18 combinations as with a result from the 4,374 combinations. Taguchi’s L18 orthogonal array (Auspurg et al., 2014) has a size of 18 rows and 8 columns, and factors are assigned to each column so that all level combinations for any factors appear the same number of times among 18 rows. This orthogonal nature of each column allows the experimenter to independently assess the main effects of up to eight factors in just 18 experiments by assigning seven factors with three levels and one factor with two levels. Further explanation of the conjoint experiment and Taguchi’s orthogonal design are presented in Appendix 1.
The details of the 18 cards used in each region’s survey are presented in Appendix 2. In the survey, 18 cards were randomly presented to the respondents to ensure that order effects were adequately controlled in the repeated measurements. Each card was accompanied by a lead sentence: ‘If you were in the type of situation described below, would you take measures to prevent the spread, such as refraining from unessential outside trips and travel or dining in a large group? (Please select one)’. Based on the hypothetical situation presented on the card, the respondents answered on an 11-point scale (0 = I would definitely not take prevention measures, 5 = I cannot say either way, and 10 = I would certainly take prevention measures).
Statistical analysis
Evaluating the information of the largest effect on risk-averse behaviour with conjoint analysis
To explore RQ1, we applied a conjoint analysis. To evaluate the strength of each factor’s effect, the ranges of the maximum and minimum utility values of the levels within the respective factors (attributes) were calculated for each region. A wider range of utility values indicates larger effects of the attributes. Thereafter, we examined whether similarities or differences exist among the three regions regarding the strength of each factor’s effect on the COVID-19 information or situation.
Clustering people in subgroups by applying a finite mixture model
To explore RQ2, we applied a finite mixture model (latent class regression) (Desarbo et al., 1992; Gensler, 2021). This model’s dependent variable is risk-averse behaviour frequency, measured as a response to each conjoint card. By assuming a model wherein multiple, finite, latent classes (subgroups) exist with similar responses to the information as well as having similarities regarding specified covariates—including gender, age, education, and scientific knowledge (science literacy)—and given that the intercept and slope differ for each subgroup, the interaction effects between each group and other independent variables can be estimated.
Thus, utilising this model enables us to interpret respondents’ risk-averse behaviour in the COVID-19 context by clustering respondents with similar characteristics as a one-step estimation. We used the same statistical approach of a finite mixture model by incorporating the same variables in the three regions to consider whether similarities or differences exist regarding the latent classes (subgroups) extracted from the regional data. Two types of clustering variables were included in the models. The former are the scores of information provided in the conjoint cards (all the attributes and levels established in the conjoint experiment using 18 hypothetical situations). The latter are covariates that comprise multiple variables that distinguish individuals, including gender, age, educational level, household income, and vaccine status. As the current research considers how scientific knowledge influences individuals’ attitudinal change regarding provided information, two variables of science literacy (European Union, 2001; National Science Board, 2016; Kato-Nitta, 2019) and health numeracy (Okamoto et al., 2012; Nakadai et al., 2018) were also included in this study. In addition, based on the results from previous studies that explore risk-averse behaviour toward COVID-19 (Bruine de Bruin and Bennett, 2020; Schneider et al., 2021), cautious habitual behaviours, risk-taking habitual behaviours, and trust in government measures against COVID-19 and medical institutions’ measures against COVID-19 were included. Appendix 4 presents these variables’ descriptions and operationalisation.
Results
Information with the largest effect on risk-averse behaviour based on utility range (importance) in the UK, Japan, and Taiwan
Conjoint analyses based on experiments with 18 sets of conjoint cards presented to each respondent were conducted in the UK, Japan, and Taiwan. Before calculating the importance scores (utility range) of the eight types of factors, we confirmed the measurement reliability and validity by examining the correlation coefficients between the observed and estimated values of the utilities and obtained sufficient results (r > 0.95). We further confirmed that the utilities presented no inverse results; for example, if the level of a smaller number of infections exhibited a higher utility value than that of a larger number of infections. Some inversions were observed at the individual level, but none were observed in the overall regional-level average values for the respective regions. Thus, the measurement validity and reliability were confirmed. Appendix 5 provides details regarding the utility values.
Figure 1 presents the conjoint analysis results of the UK, Japan, and Taiwan.
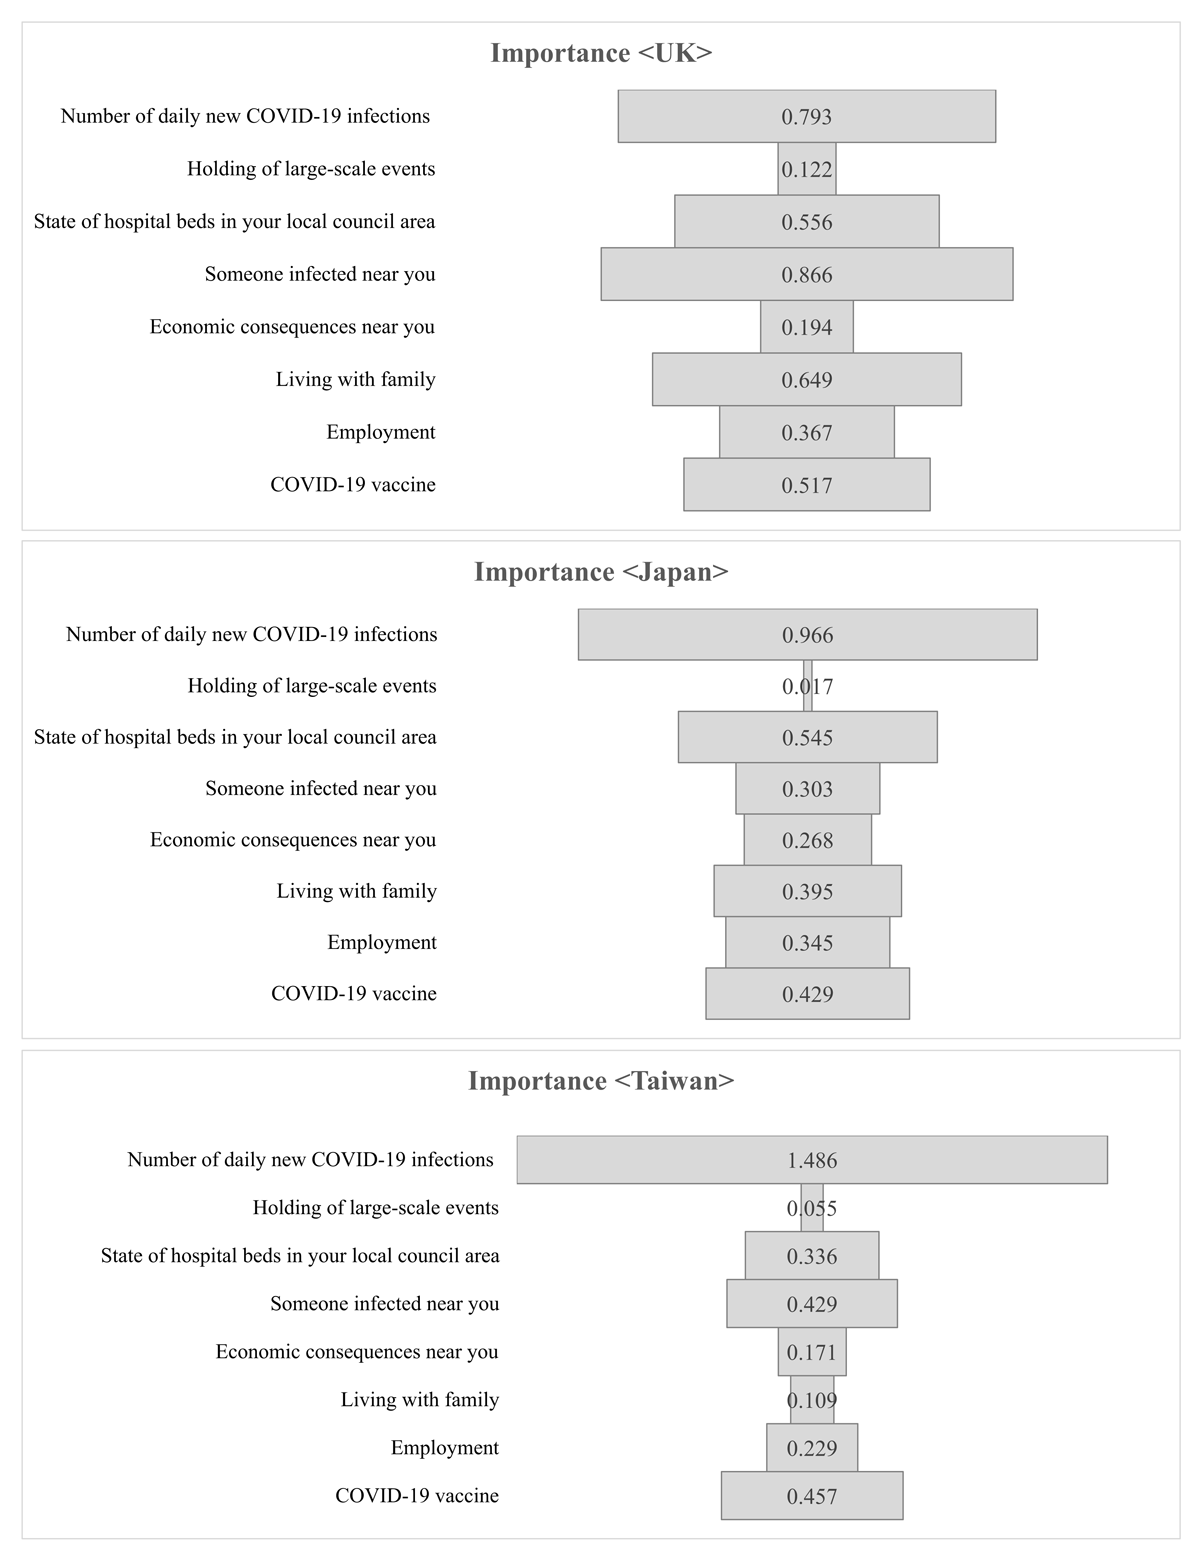
Figure 1
Importance (utility range) of factors of COVID-19 information.
Notes:
The factors are: Number of daily new COVID-19 infections across the country, Holding of large-scale events, State of hospital beds in your local council area, Someone infected near you, Economic consequences near you, Living with family, Employment; and COVID-19 vaccine.
See also Table 2.
The impact of information on risk-averse behaviour differs among the three regions. Nevertheless, the daily number of new COVID-19 infections across the country, availability of hospital beds and COVID-19 vaccination rates were of relatively high importance in each region. Respondents from the UK placed the highest importance on infection status in one’s surrounding living environment, that is, ‘someone infected near you’; however, respondents from Taiwan reported prominently high importance for the number of new infections per day despite the distinctively small number of infections established in the levels of conjoint cards among the three regions.
Overall, people in Japan and Taiwan were more likely to decide to engage in risk-averse behaviour related to COVID-19 information based on the number of new daily infections in the country as compared to those in the UK. On the contrary, people in the UK placed greater importance on direct contact via the occurrence of infections in their workplace or home.
Clustering of respondents with finite mixture models
In a finite mixture model, evaluating the number of classes (subgroups) suitable for clustering data is essential before interpreting the statistical results. The current study used the Akaike Information Criterion (AIC) and Bayesian Information Criterion (BIC) to determine the number of classes (See Appendix 6). In addition to these statistical criteria, we evaluated whether the identified class (subgroups) could be considered empirically substantial (Gensler, 2021; Kotler and Keller, 2012). Furthermore, by assessing the sample composition ratio of the class, we confirmed that no class comprised an extremely small number of samples. Based on these identical criteria, we obtained the results for four classes (subgroups) in the UK, Japan, and Taiwan.
Overall, the analyses revealed two similarities between the three regions. First, they all had a ‘risk-taking’ class that exhibited the lowest mean value of the dependent variable of risk-averse behaviour for the COVID-19 situation of the four classes. The ‘risk-taking’ class exhibited common characteristics across the region and comprised a relatively larger proportion of young men and individuals with a tendency towards vaccine hesitancy, low trust in the government measures against COVID-19, low trust in medical institutions’ measures against COVID-19, and relatively lower scores of science literacy and health numeracy. Furthermore, they have presented commonalities in their relatively lower utility range (importance), meaning that they tended to make smaller behavioural changes according to the information or situation provided. The ‘risk-taking’ class comprised approximately 10% of the total in all three regions.
Second, all three regions had a ‘prudent’ class that exhibited the highest mean value of the dependent variable of the four classes. A common characteristic across the regions of the ‘prudent’ class included a relatively larger proportion of older people and individuals with higher educational levels, higher science literacy, high trust in medical institutions, and cautious habitual behaviours. The ‘prudent’ class comprised approximately 30% to 35% of the total in all three regions.
Regarding the other two classes with moderate-mean values of the dependent variable of risk-averse behaviour during the COVID-19 situation, we observed both common and different characteristics among the three regions. In the following section, we examine the clustering of the statistical results of each region and their respective interpretations.
The UK
Table 3 shows the results of cluster segmentation of four classes with a finite mixture model in the UK.
Table 3
UK influence degree of factors and independent variables of each class.
| FACTORS | LEVELS | ADJUSTED COEFFICIENTS | UTILITY RANGE (IMPORTANCE) | |||||||
|---|---|---|---|---|---|---|---|---|---|---|
| CLASS 1 | CLASS 2 | CLASS 3 | CLASS 4 | CLASS 1 | CLASS 2 | CLASS 3 | CLASS 4 | |||
| Provided Information | Number of daily new COVID-19 infections | UK Less than 5,000 | –0.10 | –0.13 | –0.17 | –0.06 | 0.21 | 0.25 | 0.36 | 0.12 |
| UK Around 25,000 | –0.01 | 0.01 | –0.01 | 0.01 | ||||||
| UK 100,000 or over | 0.11 | 0.12 | 0.19 | 0.06 | ||||||
| Large-scale events | No restrictions on audience | –0.02 | –0.02 | –0.04 | 0.00 | 0.05 | 0.05 | 0.08 | 0.01 | |
| Restrictions on audience numbers | 0.00 | 0.00 | –0.01 | 0.00 | ||||||
| Without an audience | 0.03 | 0.03 | 0.04 | 0.01 | ||||||
| State of hospital beds | Plenty of hospital beds | –0.09 | –0.10 | –0.13 | –0.05 | 0.18 | 0.18 | 0.28 | 0.10 | |
| 50% of hospital beds | –0.01 | 0.02 | –0.03 | 0.01 | ||||||
| Cannot be admitted to hospital immediately | 0.10 | 0.08 | 0.15 | 0.04 | ||||||
| Someone infected near you | Nobody infected | –0.11 | –0.17 | –0.17 | –0.06 | 0.23 | 0.32 | 0.33 | 0.14 | |
| Someone at work infected | 0.00 | 0.02 | 0.02 | –0.02 | ||||||
| Someone at home infected | 0.11 | 0.15 | 0.15 | 0.08 | ||||||
| Economic consequences near you because of COVID-19 | Nobody has lost their job | –0.03 | –0.02 | –0.06 | 0.00 | 0.06 | 0.03 | 0.10 | 0.00 | |
| Friend has lost their job | 0.00 | 0.00 | 0.02 | 0.00 | ||||||
| Family member has lost their job | 0.03 | 0.01 | 0.04 | 0.00 | ||||||
| Living with family | Living alone | –0.08 | –0.09 | –0.12 | –0.05 | 0.18 | 0.25 | 0.30 | 0.12 | |
| Living with someone (not elderly or high risk) | –0.03 | –0.08 | –0.06 | –0.02 | ||||||
| Living with elderly or high risk | 0.10 | 0.16 | 0.18 | 0.07 | ||||||
| Employment | Able to work from home | –0.04 | –0.08 | –0.11 | –0.03 | 0.10 | 0.19 | 0.23 | 0.06 | |
| Required to commute | –0.01 | –0.03 | –0.01 | 0.00 | ||||||
| Work lots of contact with people | 0.05 | 0.11 | 0.12 | 0.03 | ||||||
| COVID-19 vaccine | Unvaccinated | 0.07 | 0.11 | 0.09 | 0.03 | 0.14 | 0.21 | 0.19 | 0.06 | |
| Vaccinated | –0.07 | –0.11 | –0.09 | –0.03 | ||||||
| Covariates | Gender | Men | 0.09 | –0.10 | –0.12 | 0.12 | ||||
| Women | –0.09 | 0.10 | 0.12 | –0.12 | ||||||
| Age | 20–29 | 0.28 | –0.05 | –0.09 | –0.13 | |||||
| 30–39 | 0.24 | 0.23 | 0.04 | –0.51 | ||||||
| 40–49 | 0.24 | 0.23 | 0.04 | –0.51 | ||||||
| 50–59 | –0.09 | –0.09 | –0.03 | 0.22 | ||||||
| 60–64 | –0.09 | –0.09 | –0.03 | 0.22 | ||||||
| Educational level | Lower | 0.00 | 0.01 | 0.04 | –0.05 | |||||
| Higher (College graduates or higher) | 0.00 | –0.01 | –0.04 | 0.05 | ||||||
| Household Income | Low | –0.08 | 0.22 | –0.21 | 0.07 | |||||
| Mid | 0.17 | –0.02 | 0.05 | –0.20 | ||||||
| High | –0.09 | –0.20 | 0.16 | 0.14 | ||||||
| Vaccine status | Others | 0.16 | 0.12 | 0.07 | –0.36 | |||||
| Vaccine hesitancy | –0.16 | –0.12 | –0.07 | 0.36 | ||||||
| Health numeracy | 0.00 | 0.03 | 0.01 | –0.03 | ||||||
| Science literacy | 0.00 | 0.05 | 0.01 | –0.06 | ||||||
| Cautious habitual behaviors | –0.07 | 0.18 | 0.11 | –0.23 | ||||||
| Risk taking habitual behaviors | 0.02 | –0.10 | –0.01 | 0.09 | ||||||
| Trust in government measures against COVID-19 | 0.02 | –0.04 | 0.01 | 0.01 | ||||||
| Trust in medical institutions’ measures against COVID-19 | –0.04 | 0.14 | 0.00 | –0.11 | ||||||
| Constant | 1.32 | –3.22 | –1.20 | 3.10 | ||||||
| R2 | 0.14 | 0.10 | 0.12 | 0.10 | ||||||
| N (Total 1,505) | 512 | 465 | 383 | 145 | ||||||
The left side of Table 3 shows the adjusted coefficients (utilities) of each level of the four classes. The scores of the less than 5,000 level of the number of daily new COVID-19 infections across the country factor are relatively large in the negative direction. Therefore, this level has a strong negative influence on risk-averse behaviour when all the other variables are controlled. Likewise, the scores of the 100,000 level of the number of daily new COVID-19 infections across the country factor are relatively large in the positive direction. Therefore, this level has a strong positive influence on risk-averse behaviour when all the other variables are controlled. The right of Table 3 shows the utility ranges (Importance) of factors from the four classes. Importance value can be used for interpreting class characteristics. In this table, the larger scores represent stronger effects on risk-averse behaviours. For instance, Class 3 has relatively larger scores of utility ranges (importance) for all factors, while Class 4 has relatively smaller scores of utility ranges for all factors. Therefore, people in Class 4 tend not to make behavioural changes no matter the provided information, and people in Class 3 tend to make behavioural changes in response to provided information.
The proportions of individuals included in each class in the UK data are presented in Table 4.
Table 4
UK compositions of the subgroups (four classes).
| CLASS 1 | CLASS 2 | CLASS 3 | CLASS 4 | ||
|---|---|---|---|---|---|
| Class sizes | 34.08% | 30.82% | 25.34% | 9.76% | |
| Average values of evaluation on 18 conjoint cards | 5.94 | 8.95 | 7.90 | 3.56 | |
| Age | 20–29 | 25.71% | 13.22% | 17.41% | 24.12% |
| 30–39 | 23.67% | 19.36% | 20.13% | 13.63% | |
| 40–49 | 20.47% | 22.22% | 23.39% | 26.37% | |
| 50–59 | 20.94% | 31.13% | 26.99% | 24.03% | |
| 60–64 | 9.21% | 14.08% | 12.07% | 11.85% | |
| Gender | Men | 51.06% | 43.65% | 41.88% | 49.62% |
| Women | 48.94% | 56.35% | 58.12% | 50.38% | |
| Household Income | Low | 31.21% | 40.56% | 26.93% | 40.91% |
| Mid | 31.56% | 27.30% | 28.07% | 20.03% | |
| High | 37.23% | 32.14% | 45.01% | 39.06% | |
| Educational level | Lower | 57.56% | 59.05% | 57.82% | 62.18% |
| Higher (College graduates or higher) | 42.44% | 40.95% | 42.18% | 37.82% | |
| Vaccine status | Others | 93.36% | 96.82% | 94.97% | 75.47% |
| Vaccine hesitency | 6.64% | 3.18% | 5.03% | 24.53% | |
| Health numeracy (Average valuie) | 5.00 | 5.42 | 5.04 | 4.66 | |
| Science literacy (Average value) | 6.69 | 7.28 | 6.86 | 6.34 | |
| Trust in government measures against COVID-19(Average value) | 13.21 | 12.88 | 13.44 | 11.75 | |
| Trust in medical institutions’ measures againt COVID-19 (Average value) | 15.58 | 17.39 | 16.27 | 13.30 | |
| Cautious habitual behaviors (Average value) | 10.48 | 12.04 | 11.64 | 8.87 | |
| Risktaking habitual behaviors (Average value) | 9.47 | 7.50 | 8.89 | 9.79 | |
| N = 1,505 | |||||
The Latent class analysis generally interprets class characteristics based on the conditional probabilities of responses. Table 5 summarises the observations of characteristics of each subgroup (class) in the UK.
Table 5
Summary of UK subgroup (class) characteristics.
| SUBGROUP | POSSIBLE INTERPRETATIONS | RISK-AVERSE BEHAVIOUR FREQUENCY (AVERAGE VALUES OF DEPENDENT VARIABLES) | RESPONDENT’S CHARACTERISTICS | CHARACTERISTICS OF THE UTILITY RANGE OF CONJOINT EXPERIMENT |
|---|---|---|---|---|
| Class 1 | Moderate | Moderate | Yonger age | Moderate utility ranges in all the factors |
| Class 2 | Prudent | High | Higher age, higher educational level, higher health numeracy, higher science literacy, higher trust in medical institutions, cautious habitual behaviors | Moderate utility ranges in all the factors |
| Class 3 | Government Supporter | Moderate | Women, higher income, higher trust in government measures | Relatively higher utility rages in all the factors |
| Class 4 | Risk-taking | Low | Younger age, men, vaccine hesitancy, lower trust in government measures, lower health numeracy, lower science literacy, lower trust in medical institutions, risk-taking havitual behaviours | Lower utility ranges in all the factors |
Japan
Table 6 shows the results of cluster segmentation for the four classes with a finite mixture model in Japan.
Table 6
Japan influence degree of factors and independent variables of each class.
| FACTORS | LEVELS | ADJUSTED COEFFICIENTS | UTILITY RANGE (IMPORTANCE) | |||||||
|---|---|---|---|---|---|---|---|---|---|---|
| CLASS 1 | CLASS 2 | CLASS 3 | CLASS 4 | CLASS 1 | CLASS 2 | CLASS 3 | CLASS 4 | |||
| Provided Information | Number of daily new COVID-19 infections | JP Less than 2,000 | –0.25 | –0.25 | –0.30 | –0.11 | 0.45 | 0.50 | 0.58 | 0.21 |
| JP Around 10,000 | 0.05 | 0.01 | 0.02 | 0.01 | ||||||
| JP 50,000 or over | 0.20 | 0.24 | 0.28 | 0.10 | ||||||
| Large-scale events | No restrictions on audience | 0.00 | –0.02 | 0.01 | 0.00 | 0.10 | 0.03 | 0.02 | 0.01 | |
| Restrictions on audience numbers | –0.05 | 0.00 | –0.01 | 0.00 | ||||||
| Without an audience | 0.05 | 0.01 | –0.01 | 0.01 | ||||||
| State of hospital beds | Plenty of hospital beds | –0.14 | –0.13 | –0.17 | –0.04 | 0.30 | 0.30 | 0.41 | 0.09 | |
| 50% of hospital beds | –0.02 | –0.04 | –0.07 | –0.01 | ||||||
| Cannot be admitted to hospital immediately | 0.16 | 0.17 | 0.24 | 0.05 | ||||||
| Someone infected near you | Nobody infected | –0.12 | –0.08 | –0.13 | –0.02 | 0.18 | 0.15 | 0.26 | 0.04 | |
| Someone at work infected | 0.06 | 0.01 | 0.00 | 0.00 | ||||||
| Someone at home infected | 0.06 | 0.07 | 0.13 | 0.02 | ||||||
| Economic consequences near you because of COVID-19 | Nobody has lost their job | –0.03 | –0.05 | –0.11 | –0.02 | 0.06 | 0.10 | 0.20 | 0.04 | |
| Friend has lost their job | 0.01 | 0.00 | 0.03 | 0.00 | ||||||
| Family member has lost their job | 0.03 | 0.05 | 0.08 | 0.02 | ||||||
| Living with family | Living alone | –0.09 | –0.08 | –0.12 | –0.03 | 0.25 | 0.21 | 0.32 | 0.07 | |
| Living with someone (not elderly or high risk) | –0.07 | –0.05 | –0.08 | –0.01 | ||||||
| Living with elderly or high risk | 0.16 | 0.13 | 0.20 | 0.04 | ||||||
| Employ-ment | Able to work from home | –0.12 | –0.07 | –0.15 | –0.01 | 0.30 | 0.16 | 0.37 | 0.05 | |
| Required to commute | –0.06 | –0.03 | –0.08 | –0.02 | ||||||
| Work lots of contact with people | 0.18 | 0.09 | 0.22 | 0.03 | ||||||
| COVID-19 vaccine | Unvaccinated | 0.14 | 0.08 | 0.17 | 0.03 | 0.28 | 0.15 | 0.33 | 0.06 | |
| Vaccinated | –0.14 | –0.08 | –0.17 | –0.03 | ||||||
| Covariates | Gender | Men | –0.26 | 0.19 | –0.18 | 0.24 | ||||
| Women | 0.26 | –0.19 | 0.18 | –0.24 | ||||||
| Age | 20–29 | –0.14 | 0.03 | –0.01 | 0.12 | |||||
| 30–39 | 0.01 | 0.13 | –0.03 | –0.12 | ||||||
| 40–49 | 0.01 | 0.13 | –0.03 | –0.12 | ||||||
| 50–59 | –0.01 | –0.04 | –0.04 | 0.09 | ||||||
| 60–64 | –0.01 | –0.04 | –0.04 | 0.09 | ||||||
| Educational level | Lower | 0.05 | –0.09 | 0.02 | 0.02 | |||||
| Higher (College graduates or higher) | –0.05 | 0.09 | –0.02 | –0.02 | ||||||
| Household Income | Low | 0.07 | –0.11 | –0.11 | 0.15 | |||||
| Mid | –0.09 | 0.12 | 0.06 | –0.09 | ||||||
| High | 0.02 | 0.00 | 0.05 | –0.06 | ||||||
| Vaccine status | Others | 0.15 | 0.02 | 0.08 | –0.25 | |||||
| Vaccine hesitancy | –0.15 | –0.02 | –0.08 | 0.25 | ||||||
| Health numeracy | 0.01 | 0.01 | 0.03 | –0.05 | ||||||
| Science literacy | 0.04 | –0.05 | 0.00 | 0.02 | ||||||
| Cautious habitual behaviors | 0.30 | –0.08 | 0.03 | –0.24 | ||||||
| Risk taking habitual behaviors | –0.16 | 0.05 | –0.05 | 0.16 | ||||||
| Trust in government measures against COVID-19 | –0.04 | 0.02 | –0.01 | 0.04 | ||||||
| Trust in medical institutions’ measures against COVID-19 | 0.10 | –0.01 | 0.08 | –0.17 | ||||||
| Constant | –3.91 | 1.33 | –0.97 | 3.55 | ||||||
| R2 | 0.12 | 0.18 | 0.18 | 0.06 | ||||||
| N (Total 1,571) | 476 | 470 | 439 | 186 | ||||||
Similar to the results obtained from the UK data, Japanese people in Class 4 tend not to make behavioural changes no matter the provided information, while those in Class 3 tend to make behavioural changes in response to provided information.
The proportions of individuals included in each class in Japan are shown in Table 7.
Table 7
Japan compositions of the subgroups (four classes).
| CLASS 1 | CLASS 2 | CLASS 3 | CLASS 4 | ||
|---|---|---|---|---|---|
| Class sizes | 30.52% | 30.08% | 27.61% | 11.79% | |
| Average values of evaluation on 18 conjoint cards | 9.27 | 6.59 | 8.27 | 4.18 | |
| Age | 20–29 | 11.17% | 17.65% | 14.96% | 21.70% |
| 30–39 | 18.39% | 24.30% | 19.02% | 21.32% | |
| 40–49 | 28.13% | 26.08% | 27.45% | 28.52% | |
| 50–59 | 28.66% | 22.00% | 25.47% | 17.36% | |
| 60–64 | 13.66% | 9.97% | 13.10% | 11.10% | |
| Gender | Men | 43.15% | 66.43% | 48.46% | 67.49% |
| Women | 56.85% | 33.57% | 51.54% | 32.51% | |
| Household income | Low | 32.04% | 24.81% | 26.68% | 36.94% |
| Mid | 31.18% | 38.75% | 36.20% | 30.97% | |
| High | 36.78% | 36.45% | 37.11% | 32.09% | |
| Educational level | Lower | 49.97% | 38.51% | 46.68% | 46.40% |
| Higher (College graduates or higher) | 50.03% | 61.49% | 53.32% | 53.60% | |
| Vaccine status | Others | 93.49% | 90.27% | 92.25% | 77.73% |
| Vaccine hesitency | 6.51% | 9.73% | 7.75% | 22.27% | |
| Health numeracy (Average valuie) | 6.68 | 6.61 | 6.73 | 6.18 | |
| Science literacy (Average value) | 6.60 | 6.21 | 6.45 | 6.14 | |
| Trust in government measures against COVID-19(Average value) | 11.90 | 11.81 | 12.22 | 10.18 | |
| Trust in medical institutions’ measures againt COVID-19 (Average value) | 14.83 | 13.68 | 14.73 | 11.25 | |
| Cautious habitual behaviors (Average value) | 13.50 | 12.56 | 12.98 | 11.77 | |
| Risktaking habitual behaviors (Average value) | 5.55 | 6.89 | 6.09 | 7.91 | |
| N = 1,571 | |||||
Table 8 summarises the observations regarding the characteristics of each subgroup (class) in Japan.
Table 8
Summary of Japan subgroup (class) characteristics.
| SUBGROUP | POSSIBLE INTERPRETATIONS | RISK-AVERSE BEHAVIOUR FREQUENCY (AVERAGE VALUES OF DEPENDENT VARIABLES) | RESPONDENT’S CHARACTERISTICS | CHARACTERISTICS OF THE UTILITY RANGE OF CONJOINT EXPERIMENT |
|---|---|---|---|---|
| Class 1 | Prudent | High | Higer age, women, higher science literacy, higher trust in government measures, higher trust in medical institutions measures, cautious habitual behaviours | Moderate utility ranges in all the factors |
| Class 2 | Simple | Moderate | Men, higher educational level | Generally have lower utility ranges but has a simple, higher utility ranges in the factor of numbers as well as hospital beds |
| Class 3 | Government Supporter | Moderate | Women, higher household income, hgiher health numeracy, higher trust in govenmental measures | Higher utility ranges in all the factors, especially in Numbers, Beds, and Vaccine |
| Class 4 | Risk-taking | Low | Yonger age, men, lower household income, vaccine hesitency, lower health numeracy, lower science literacy, lower trust in government measures, lower trust in medical institutions measures, risk-taking habitual behaviors | Lower utility ranges in all the factors |
Taiwan
Table 9 shows the results of the cluster segmentation for the four classes with a finite mixture model in Taiwan.
Table 9
Taiwan influence degree of factors and independent variables of each class.
| FACTORS | LEVELS | ADJUSTED COEFFICIENTS | UTILITY RANGE (IMPORTANCE) | |||||||
|---|---|---|---|---|---|---|---|---|---|---|
| CLASS 1 | CLASS 2 | CLASS 3 | CLASS 4 | CLASS 1 | CLASS 2 | CLASS 3 | CLASS 4 | |||
| Provided Information | Number of daily new COVID-19 infections | TW Less than 20 | –0.43 | –0.39 | –0.31 | –0.14 | 0.83 | 0.80 | 0.65 | 0.26 |
| TW Around 100 | 0.03 | –0.02 | –0.02 | 0.01 | ||||||
| TW 400 or over | 0.40 | 0.41 | 0.34 | 0.13 | ||||||
| Large-scale events | No restrictions on audience | 0.02 | 0.01 | 0.00 | 0.00 | 0.06 | 0.06 | 0.01 | 0.00 | |
| Restrictions on audience numbers | –0.04 | –0.04 | 0.00 | 0.00 | ||||||
| Without an audience | 0.02 | 0.03 | 0.01 | 0.00 | ||||||
| State of hospital beds | Plenty of hospital beds | –0.09 | –0.08 | –0.06 | –0.02 | 0.15 | 0.21 | 0.16 | 0.04 | |
| 50% of hospital beds | 0.02 | –0.04 | –0.03 | –0.01 | ||||||
| Cannot be admitted to hospital immediately | 0.07 | 0.12 | 0.09 | 0.03 | ||||||
| Someone infected near you | Nobody infected | –0.20 | –0.13 | –0.11 | –0.03 | 0.32 | 0.23 | 0.19 | 0.06 | |
| Someone at work infected | 0.09 | 0.03 | 0.03 | 0.00 | ||||||
| Someone at home infected | 0.11 | 0.10 | 0.08 | 0.03 | ||||||
| Economic consequences near you because of COVID-19 | Nobody has lost their job | –0.03 | –0.05 | –0.03 | –0.01 | 0.07 | 0.08 | 0.06 | 0.02 | |
| Friend has lost their job | –0.02 | 0.03 | 0.01 | 0.01 | ||||||
| Family member has lost their job | 0.05 | 0.02 | 0.02 | 0.00 | ||||||
| Living with family | Living alone | –0.08 | –0.06 | –0.04 | –0.01 | 0.12 | 0.11 | 0.07 | 0.02 | |
| Living with someone (not elderly or high risk) | 0.04 | 0.01 | 0.01 | –0.01 | ||||||
| Living with elderly or high risk | 0.04 | 0.05 | 0.03 | 0.01 | ||||||
| Employ-ment | Able to work from home | –0.14 | –0.09 | –0.05 | –0.02 | 0.26 | 0.19 | 0.11 | 0.04 | |
| Required to commute | 0.01 | –0.01 | –0.02 | –0.01 | ||||||
| Work lots of contact with people | 0.13 | 0.10 | 0.07 | 0.02 | ||||||
| COVID-19 vaccine | Unvaccinated | 0.10 | 0.12 | 0.07 | 0.05 | 0.20 | 0.25 | 0.15 | 0.09 | |
| Vaccinated | –0.10 | –0.12 | –0.07 | –0.05 | ||||||
| Covariates | Gender | Men | –0.16 | –0.20 | 0.05 | 0.30 | ||||
| Women | 0.16 | 0.20 | –0.05 | –0.30 | ||||||
| Age | 20–29 | 0.01 | –0.09 | –0.10 | 0.18 | |||||
| 30–39 | 0.09 | 0.04 | –0.09 | –0.05 | ||||||
| 40–49 | 0.09 | 0.04 | –0.09 | –0.05 | ||||||
| 50–59 | –0.07 | 0.23 | 0.05 | –0.20 | ||||||
| 60–64 | –0.07 | 0.23 | 0.05 | –0.20 | ||||||
| Educational level | Lower | 0.08 | –0.03 | –0.04 | 0.00 | |||||
| Higher (College graduates or higher) | –0.08 | 0.03 | 0.04 | 0.00 | ||||||
| Household Income | Low | 0.12 | –0.05 | –0.03 | –0.04 | |||||
| Mid | 0.07 | 0.04 | 0.08 | –0.19 | ||||||
| High | –0.19 | 0.01 | –0.05 | 0.23 | ||||||
| Vaccine status | Others | 0.15 | 0.28 | –0.09 | –0.34 | |||||
| Vaccine hesitancy | –0.15 | –0.28 | 0.09 | 0.34 | ||||||
| Health numeracy | 0.01 | 0.01 | –0.02 | 0.00 | ||||||
| Science literacy | 0.04 | 0.05 | –0.05 | –0.03 | ||||||
| Cautious habitual behaviors | 0.19 | 0.03 | –0.13 | –0.09 | ||||||
| Risk taking habitual behaviors | –0.08 | 0.00 | 0.04 | 0.04 | ||||||
| Trust in government measures against COVID-19 | 0.01 | 0.02 | 0.01 | –0.03 | ||||||
| Trust in medical institutions’ measures against COVID-19 | 0.03 | –0.01 | –0.04 | 0.02 | ||||||
| Constant | –2.28 | –0.69 | 2.17 | 0.80 | ||||||
| R2 | 0.17 | 0.19 | 0.20 | 0.14 | ||||||
| N (Total 1,574) | 563 | 501 | 333 | 177 | ||||||
Taiwanese people in Class 4 tend not to make behavioural changes no matter the provided information and only moderately respond to the number of new infections. People in the other three classes tend to make strong behavioural changes in response to the number of new infections.
The proportions of individuals in each class in Taiwan are shown in Table 10.
Table 10
Taiwan compositions of the subgroups (four classes).
| CLASS 1 | CLASS 2 | CLASS 3 | CLASS 4 | ||
|---|---|---|---|---|---|
| Class sizes | 35.59% | 31.95% | 21.04% | 11.42% | |
| Average values of evaluation on 18 conjoint cards | 9.26 | 8.00 | 6.11 | 5.62 | |
| Age | 20–29 | 18.76% | 18.84% | 20.01% | 25.54% |
| 30–39 | 22.62% | 22.70% | 20.58% | 21.12% | |
| 40–49 | 22.30% | 30.02% | 24.10% | 19.64% | |
| 50–59 | 26.84% | 19.11% | 26.32% | 20.78% | |
| 60–64 | 9.47% | 9.33% | 8.99% | 12.92% | |
| Gender | Men | 44.66% | 45.55% | 55.59% | 68.27% |
| Women | 55.34% | 54.45% | 44.41% | 31.73% | |
| Household Income | Low | 35.74% | 28.49% | 31.78% | 30.76% |
| Mid | 33.45% | 33.56% | 35.91% | 27.22% | |
| High | 30.81% | 37.96% | 32.31% | 42.02% | |
| Educational level | Lower | 32.67% | 25.33% | 29.72% | 27.35% |
| Higher (College graduates or higher) | 67.33% | 74.67% | 70.28% | 72.65% | |
| Vaccine status | Others | 96.21% | 97.30% | 93.87% | 91.73% |
| Vaccine hesitency | 3.79% | 2.70% | 6.13% | 8.27% | |
| Health numeracy (Average valuie) | 6.51 | 6.57 | 6.17 | 6.48 | |
| Science literacy (Average value) | 7.27 | 7.37 | 6.87 | 7.18 | |
| Trust in government measures against COVID-19 (Average value) | 14.88 | 14.64 | 14.00 | 13.68 | |
| Trust in medical institutions’ measures againt COVID-19 (Average value) | 16.65 | 16.30 | 15.62 | 15.82 | |
| Cautious habitual behaviors (Average value) | 13.17 | 12.87 | 12.38 | 12.51 | |
| Risktaking habitual behaviors (Average value) | 8.13 | 9.06 | 9.35 | 9.49 | |
| N = 1,574 | |||||
Table 11 summarises the observations regarding the characteristics of each subgroup (class) in Taiwan.
Table 11
Summary of Taiwan subgroup (class) characteristics.
| SUBGROUP | POSSIBLE INTERPRETATIONS | RISK-AVERSE BEHAVIOUR FREQUENCY (AVERAGE VALUES OF DEPENDENT VARIABLES) | RESPONDENT’S CHARACTERISTICS | CHARACTERISTICS OF THE UTILITY RANGE OF CONJOINT EXPERIMENT |
|---|---|---|---|---|
| Class 1 | Prudent | High | Higher age, women, higher trust in government measures, higher trust in medical institutions’ measures, cautious habitual behaviours | Higher utility ranges but has a exclusive higher utility range in the factor of Numbers |
| Class 2 | Simple | Moderate to high | Moiddle age, women, higher education level, higher health numeracy, higher science literacy | Moderate to high utility ranges but has a exclusive higher utility range in the factor of Numbers |
| Class 3 | Stray | Moderate | Men, lower health numeracy, lower science literacy, lower trust in government measures, lower trust in medical institutional measures | Moderate utility ranges but has a simple, exclusive wider utility range in the factor of Numbers |
| Class 4 | Risk-taking | Low | Yonger age, men, vaccine hesitency, lower trust in government measures, and risk-taking habitual behaviours | Lower utility ranges in all the factors |
Discussion and Conclusion
The current study extended previous research on the manner in which data informs public health responses, particularly in the context of the COVID-19 pandemic. It presents a novel direction in the field of research by integrating a comparative regional approach to understanding risk-averse behaviour in response to COVID-19 information across three distinct cultural and geographical contexts—the UK, Japan, and Taiwan. It contributes to prior discussion on the relationship between information and risk-averse behaviours by uniquely employing a conjoint experimental design to quantitatively measure decision-making, and identified key factors that influence individuals’ responses to COVID-19-related information. The incorporation of a finite mixture model to identify latent subgroups based on respondents’ characteristics, including science literacy, introduced an innovative approach of segmenting populations according to public health- behavioural tendencies. Hence, the current study provides important findings that are imperative in preparing for future pandemics.
Regarding RQ1, the utility ranges obtained from the conjoint analyses revealed that citizens in Japan and Taiwan were most sensitive to the number of daily new infections when making a risk-averse behaviour. This result is concordant with a previous Japanese study using social big data (Ito et al., 2022; Omori et al., 2024). By contrast, those in the UK were most sensitive to the presence of familiar infected persons. The importance of the number of new infections daily was outstandingly large in Taiwan, which experienced almost no major peaks in infections at the time of the survey (the values of the levels set in the numbers in Taiwan were 1/250 of that in the UK). This implies that the number of infections may not directly influence differences in behaviour. Furthermore, people in dissimilar cultural contexts or situations may have reacted differently to the same COVID-19 information. Such a phenomenon has also been seen in a previous study that explored the relationship between information on gene-edited food and people’s risk perceptions in the US, Japan, and Germany (Kato-Nitta et al., 2023). In the current study, this may be attributable to cultural differences, differences in habitual behaviours or social norms between East Asia and Europe or differences in how COVID-19 and related policies were reported in these countries. This underscores the importance of considering cultural and societal contexts when designing public health interventions, as people’s risk-averse behaviours may be shaped by their unique cultural and social norms.
Certainly, a myriad of combinations of information and conditions exists in individuals’ surroundings, which can evoke behavioural changes in them. Therefore, considering all the information or situations, including social distancing, wearing masks, and abstaining from travel, was nearly impossible. To address this issue, we used a conjoint experimental design. As the observed and estimated values were sufficiently correlated and no overall reversal of utility values across the three regions was observed, the validity of the current study’s approach was confirmed. However, this study has several limitations.
First, it is unclear whether the hypothetical situations used in the conjoint experiment reflect real-life situations. This is a weakness as the experiment involves recalling and responding to a hypothetical situation. Second, the current research employed the approximation with 7 factors (attributes) × 3 levels and 1 factor (attribute) × 2 levels; it is debatable whether the factors and levels established by the current study are optimal for statistically exploring the relationship between information and risk-averse behaviour under the COVID-19 situation. If any factors had a greater influence than the eight factors utilised in the current study, this approximation would not be optimal; however, since this research was conducted during the spread of COVID-19 when few previous studies had adopted the same survey methodology based on similar research questions and themes, this research had to be exploratory. There may have been other important variables that should have been considered as factors; therefore, we hope the current study contributes as a basis for further discussions. Third, this study has a limitation common to all surveys applying hypothetical experiments regarding the COVID-19 situation: we cannot rule out the possibility that respondents’ responses may have been influenced by the situation in their area when the survey was administered. As time passed and the situation of infections in the areas changed, the responses may have also changed (Qin et al., 2021). Nevertheless, by using identical experimental designs in the three regions, this study provides more information than a one-shot survey administered in a single region. To strengthen these results, similar surveys should be administered in other regions, and multiple surveys should be administered in the same region over time.
In conclusion, the impact of information on behavioural change pertaining to the COVID-19 situation across regions had both differences and similarities. The main difference was that while people in the UK placed the highest importance on the extent of direct contact for deciding behavioural change, people in Japan and Taiwan were most concerned with the number of daily new infections across the country when determining their actions.
Regarding RQ2, the study identified common latent subgroups across the three regions, specifically the risk-taking and prudent classes. These subgroups shared certain characteristics, such as age, vaccine hesitancy, science literacy, trust in government, and trust in medical institution measures against COVID-19, which have significant implications for public health policies. Better understanding these latent groups can help policymakers develop more targeted interventions, especially to engage those in the risk-taking class who are less likely to change their behaviour in response to information. The result that the risk-taking class contained higher proportions of vaccine hesitancy may contradict the intuition that vaccination would have fostered feelings of safety and led to going out more actively. Those who answered that they could not get vaccinated for medical reasons exhibited the highest mean value for the dependent variable of risk-averse behaviour across the regions (see Appendix 7), highlighting the distinctiveness of this subgroup’s behaviour. Nevertheless, as the responses of the risk-taking classes commonly exhibited positive and negative coefficients to the levels of ‘Vaccinated’ and ‘Unvaccinated’, respectively, the orientations of risk-averse behaviour frequency are the same as the other classes. Therefore, participants in the risk-taking classes may have simply been confident in their physical robustness.
In contrast, the prudent subgroups exhibited proportionately high levels of trust in government and medical institution measures against COVID-19, which was similar across the three regions. This could be an important implication for health policy experts and healthcare professionals because it indicates that restoring people’s trust significantly influences the decision-making of those in risk-taking classes, which could result in behavioural changes. This result is concordant with previous studies noting that trust is closely related to people’s risk perceptions (Lobb, 2005; Slovic et al., 1981).
Scientific knowledge was another similar issue across the UK, Japan, and Taiwan. The prudent class existed in all three regions and exhibited the highest frequency of risk-averse behaviour among the four sub-groups. They tended to score higher in science literacy as well as higher in health numeracy in the three regions. Being prudent and performing risk-averse behaviour (preventing infection spread) in the context of a new infectious disease outbreak implies correct or appropriate fear. Hence, increasing people’s general scientific knowledge and health literacy (numeracy) could be an effective strategy to promote positive health behaviors, particularly in the context of infectious disease outbreaks. Furthermore, this confirms the information deficit model in science communication studies regarding the assumption that an increase in ‘correct’ scientific knowledge among the public enhances positive attitudes toward new science and technology applications in everyday life, thereby contributing to further elucidating the deficit model’s boundary conditions (Ahteensuu, 2012; Kato-Nitta et al., 2019).
Moreover, the current study’s results further contribute to the discussion on the manner in which data-sharing systems can be adapted to meet the needs of diverse populations, such as those with varying levels of data literacy and science literacy or different health risks. By integrating cultural dimensions with data science approaches, the current study offers a more holistic understanding of how data can be used in public health, and thus makes a novel contribution to the ongoing discussions in data science research and public health.
Data Accessibility Statement
The datasets generated and/or analysed during the current study are not publicly available owing to the regulations of the Japanese privacy protection law; however, they are available from the corresponding author upon reasonable request.
Additional File
The additional file for this article can be found as follows:
Ethics and Consent
The surveys used in the current study were administered in accordance with the General Data Protection Regulation, EU Regulation 2016/679 and the Japanese Privacy Information Protection Law and were approved by the Institute of Statistical Mathematics Ethical Review Board beforehand (ISM21-005). Participation was voluntary, and participants could withdraw at any time. Informed consent was obtained from all survey company participants.
Acknowledgements
NKN extends their gratitude to Dr. Asao Fujiyama for his valuable comments on this research proposal for funding, and to Dr. Hiroe Tsubaki for his valuable comments on the research. Further, NKN thanks Dr. Satoshi Ito who continuously encouraged this research project from spring 2020 to spring 2023, as well as Dr. Kristina Kokorelias for her valuable comments on the manuscript.
Competing Interests
The authors have no competing interests to declare.
Author contributions
NKN conceptualised and designed the current research, obtained funding, designed and organised the experimental questionnaire surveys, curated the data, developed the statistical analysis plan, conducted the statistical analyses, and wrote the paper. YI designed the experimental questionnaire surveys and curated the data. TM designed the experimental questionnaire surveys and curated the data. All authors have reviewed and approved the final manuscript.