
Table 1
Data collection periods per respondent group, interview setting, and CS network. ATRAP: Action Towards Reducing Aquatic Snail-Borne Parasitic Diseases.
| PROJECT | RESPONDENT GROUP | NUMBER OF RESPONDENTS | DATE OF INTERVIEW | INTERVIEW SETTING |
|---|---|---|---|---|
| Geo-Observers | Citizen scientists | 51 | Aug and Nov 2019 | Group |
| 59 | Jan and Feb 2021 | Individual | ||
| Control group | 56 | Nov 2019 | Group | |
| 41 | Jan and Feb 2021 | Individual | ||
| ATRAP | Citizen scientists | 23 | Jan 2021 | Individual |
| 24 | Oct 2021 | Group | ||
| Control group | 30 | Jan 2021 | Individual | |
| 34 | Nov 2021 | Group |
Table 2
Demographic characteristics of the study respondents. Bolded cells represent statistically significant differences between similar groups.
| VARIABLE | CITIZEN SCIENCE NETWORK AND RESPONDENT GROUP | |||||||||||
|---|---|---|---|---|---|---|---|---|---|---|---|---|
| ATRAP_ALL | ATRAP_CSs | ATRAP_CG | GO_ALL | GO_CSs | GO_CG | |||||||
| n | % | n | % | n | % | n | % | n | % | n | % | |
| Age: mean (sd) | 36.3 (7.2) | 37.8(6.7) | 35.2 (7.4) | 32.1(8.5) | 33.1(8.8) | 31.2(8.2) | ||||||
| Age groups | ||||||||||||
| 20–29 | 7 | 13.2 | 2 | 8.7 | 5 | 16.7 | 43 | 40.2 | 20 | 39.2 | 23 | 41 |
| 30–39 | 27 | 50.9 | 9 | 39 | 18 | 60 | 46 | 43 | 19 | 37.3 | 27 | 48 |
| 40–49 | 16 | 30.2 | 11 | 48 | 5 | 16.7 | 11 | 10.3 | 8 | 15.7 | 3 | 5.4 |
| 50+ | 3 | 5.7 | 1 | 4.3 | 2 | 6.7 | 6 | 5.61 | 3 | 5.9 | 3 | 5.4 |
| Not indicated | 0 | 0 | 0 | 0 | 0 | 0 | 1 | 0.9 | 1 | 2 | 0 | 0 |
| Occupation status | ||||||||||||
| Employed | 8 | 15.1 | 3 | 13 | 5 | 16.7 | 17 | 15.9 | 6 | 11.8 | 11 | 20 |
| No income-generating activity | 5 | 9.4 | 2 | 8.7 | 3 | 10 | 14 | 13.1 | 3 | 5.9 | 11 | 20 |
| Self-employed | 40 | 75.5 | 18 | 78 | 22 | 73.3 | 76 | 71 | 42 | 82.4 | 34 | 61 |
| Gender | ||||||||||||
| Female | 12 | 22.6 | 6 | 26 | 6 | 20 | 29 | 27.1 | 12 | 23.5 | 17 | 30 |
| Male | 41 | 77.4 | 17 | 74 | 24 | 80 | 78 | 72.9 | 39 | 76.5 | 39 | 70 |
| Education level | ||||||||||||
| Primary level | 11 | 20.8 | 4 | 17 | 7 | 23.3 | 15 | 14 | 7 | 13.7 | 8 | 14.3 |
| Lower secondary | 19 | 35.8 | 10 | 44 | 9 | 30 | 25 | 23.4 | 10 | 19.6 | 15 | 26.9 |
| Upper secondary | 6 | 11.3 | 4 | 17 | 2 | 6.7 | 23 | 21.5 | 14 | 27.5 | 9 | 16.1 |
| High (University or tertiary) | 17 | 32.1 | 5 | 22 | 12 | 40 | 44 | 41.1 | 20 | 39.2 | 24 | 42.9 |
| Past volunteering experience | ||||||||||||
| Yes | 49 | 92.5 | 20 | 87 | 29 | 96.7 | 26 | 24.3 | 24 | 47.1 | 2 | 3.6 |
| No | 4 | 7.55 | 3 | 13 | 1 | 3.3 | 24 | 22.4 | 22 | 43.1 | 2 | 3.6 |
| Not indicated | 0 | 0 | 0 | 0 | 0 | 0 | 57 | 53.3 | 5 | 9.8 | 52 | 92.9 |
[i] Notes: ATRAP: Action Towards Reducing Aquatic Snail-Borne Parasitic Diseases, CSs: citizen scientists; CG: control group, GO: Geo-Observers.
Table 3
Comparisons of mean scores between motivational factors using the Mann-Whitney U test and BH correction for multiple comparisons. Significant differences between the highest-scoring factors (Understanding, Values) and the lowest-scoring factors (Social, Protective) are highlighted in bold.
| CITIZEN SCIENCE NETWORK | ATRAP | GO | ||||||||||
|---|---|---|---|---|---|---|---|---|---|---|---|---|
| INTERVIEW SETTING | GROUP(n = 58) | INDIVIDUAL(n = 53) | GROUP(n = 107) | INDIVIDUAL(n = 100) | ||||||||
| COMPARISONS | W | p.adj | r | W | p.adj | r | W | p.adj | r | W | p.adj | r |
| Understanding_Values | 964 | 0.73 | 0.04 | 1012 | 0.53 | 0.08 | 3840.5 | 0.00** | 0.23 | 4212.5 | 0.14 | 0.12 |
| Understanding_Career | 1157 | 0.07. | 0.22 | 1250 | 0.00** | 0.31 | 3026 | 0.74 | 0.03 | 4119 | 0.23 | 0.10 |
| Understanding_Social | 1334.5 | 0.00** | 0.39 | 1557 | 0.00** | 0.59 | 4445.5 | 0.00** | 0.40 | 6217.5 | 0.00** | 0.59 |
| Understanding_Enhancement | 1043.5 | 0.36 | 0.11 | 1231 | 0.00** | 0.29 | 3619.5 | 0.25 | 0.10 | 4377.5 | 0.05* | 0.16 |
| Understanding_Protective | 1579 | 0.00** | 0.61 | 1636 | 0.00** | 0.67 | 4131 | 0.00** | 0.43 | 6381.5 | 0.00** | 0.63 |
| Understanding_Attitude | 825 | 0.42 | 0.10 | 1340 | 0.00** | 0.39 | 2605.5 | 0.53 | 0.06 | 5885 | 0.00** | 0.51 |
| Understanding_Subjective norms | 1429.5 | 0.00** | 0.48 | 1610 | 0.00** | 0.64 | 3665.5 | 0.12 | 0.14 | 6194.5 | 0.00** | 0.59 |
| Values_Career | 1109.5 | 0.14 | 0.18 | 1149 | 0.07. | 0.21 | 2234 | 0.00** | 0.23 | 3600 | 0.76 | 0.02 |
| Values_Social | 1259 | 0.00** | 0.32 | 1464.5 | 0.00** | 0.51 | 3890 | 0.00** | 0.27 | 5725 | 0.00** | 0.47 |
| Values_Enhancement | 985.5 | 0.61 | 0.06 | 1118.5 | 0.12 | 0.18 | 2700.5 | 0.16 | 0.13 | 3810 | 0.76 | 0.03 |
| Values_Protective | 1485.5 | 0.00** | 0.53 | 1540 | 0.00** | 0.58 | 3447 | 0.00** | 0.24 | 5995.5 | 0.00** | 0.54 |
| Values_Attitude | 813 | 0.36 | 0.11 | 1222 | 0.00** | 0.28 | 1907.5 | 0.00** | 0.26 | 5176 | 0.00** | 0.35 |
| Values_Subjective norms | 1336.5 | 0.00** | 0.39 | 1490.5 | 0.00** | 0.53 | 2759.5 | 0.32 | 0.09 | 5646.5 | 0.00** | 0.46 |
| Career_Social | 1097 | 0.18 | 0.16 | 1320.5 | 0.00** | 0.37 | 4424 | 0.00** | 0.39 | 5672 | 0.00** | 0.46 |
| Career_Enhancement | 798 | 0.34 | 0.12 | 879.5 | 0.73 | 0.04 | 3675 | 0.18 | 0.12 | 3934 | 0.51 | 0.06 |
| Career_Protective | 1361.5 | 0.00** | 0.41 | 1384.5 | 0.00** | 0.43 | 4111.5 | 0.00** | 0.42 | 5994 | 0.00** | 0.54 |
| Career_Attitude | 600.5 | 0.00** | 0.31 | 932 | 0.95 | 0.01 | 2702 | 0.72 | 0.03 | 5154 | 0.00** | 0.34 |
| Career_Subjective norms | 1178 | 0.05* | 0.24 | 1288.5 | 0.00** | 0.34 | 3695 | 0.1. | 0.15 | 5602.5 | 0.00** | 0.45 |
| Social_Enhancement | 622 | 0.02* | 0.28 | 455.5 | 0.00** | 0.44 | 1899.5 | 0.00** | 0.35 | 1761.5 | 0.00** | 0.45 |
| Social_Protective | 1199.5 | 0.03* | 0.26 | 969.5 | 0.73 | 0.04 | 2547.5 | 0.64 | 0.05 | 4325 | 0.07. | 0.15 |
| Social_Attitude | 435.5 | 0.00** | 0.46 | 451.5 | 0.00** | 0.44 | 1380.5 | 0.00** | 0.43 | 2724 | 0.00** | 0.23 |
| Social_Subjective norms | 1014 | 0.48 | 0.08 | 837 | 0.53 | 0.08 | 1963 | 0.00** | 0.31 | 3397 | 0.4 | 0.07 |
| Enhancement_Protective | 1502.5 | 0.00** | 0.54 | 1458.5 | 0.00** | 0.50 | 4012 | 0.00** | 0.34 | 5980 | 0.00** | 0.53 |
| Enhancement_Attitude | 704.5 | 0.08. | 0.21 | 992 | 0.63 | 0.06 | 2360.5 | 0.07. | 0.16 | 5088.5 | 0.00** | 0.33 |
| Enhancement_Subjective norms | 1329.5 | 0.00** | 0.38 | 1378 | 0.00** | 0.42 | 3397 | 0.72 | 0.03 | 5541 | 0.00** | 0.43 |
| Protective_Attitude | 214.5 | 0.00** | 0.67 | 392.5 | 0.00** | 0.50 | 1137 | 0.00** | 0.47 | 2120.5 | 0.00** | 0.37 |
| Protective_Subjective norms | 735 | 0.14 | 0.18 | 779 | 0.27 | 0.14 | 1766 | 0.00** | 0.32 | 2756 | 0.00** | 0.22 |
| Attitude_Subjective norms | 1496 | 0.00** | 0.54 | 1383 | 0.00** | 0.43 | 3463 | 0.03* | 0.19 | 4496.5 | 0.00** | 0.19 |
[i] Notes: ATRAP: Action Towards Reducing Aquatic Snail-Borne Parasitic Diseases, GO: Geo-Observers, p.adj: p-value after the BH correction for multiple comparisons, significant differences between the motivational factors detected at .p < 0.1 *: p < 0.05, **p < 0.01, r: effect size and W: test statistic for the Mann-Whitney U test.
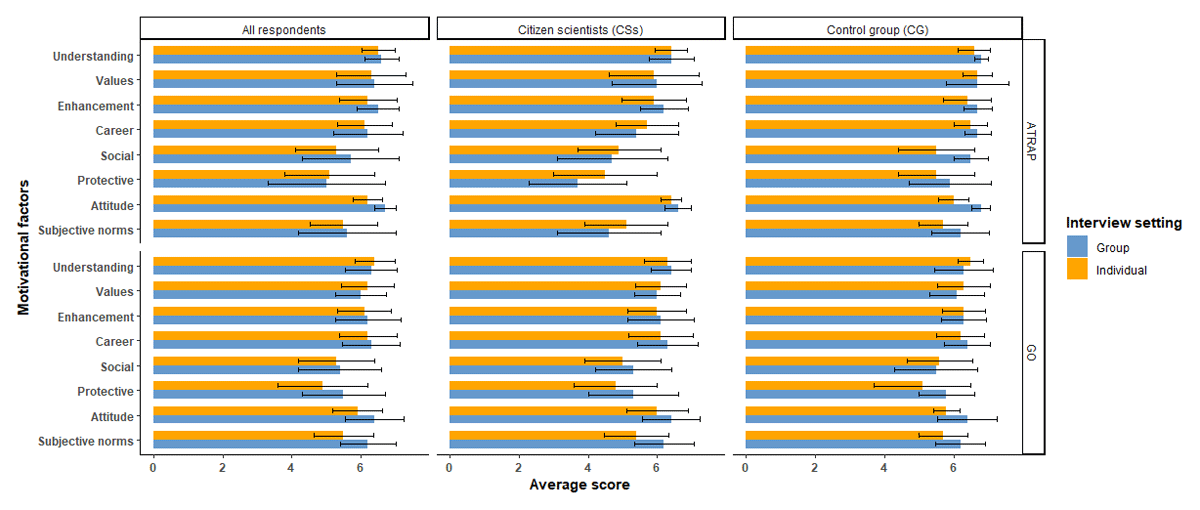
Figure 1
Mean scores of the motivational factors across citizen science networks, respondent group, and interview setting, with error bars indicating the standard deviation (Source of data: all datasets generated).
Table 4
Comparisons of motivational factors between the respondent groups per citizen science (CS) network and interview settings using the Mann-Whitney U test.
| CS NETWORK | ATRAP | GO | ||||||||||||||
|---|---|---|---|---|---|---|---|---|---|---|---|---|---|---|---|---|
| INTERVIEW SETTING | INDIVIDUAL | GROUP | GROUP | INDIVIDUAL | ||||||||||||
| COMPARISONS (CITIZEN SCIENTISTS~CONTROL GROUP) | W | P-VALUE | r | d | W | P-VALUE | r | d | W | P-VALUE | R | d | W | P-VALUE | r | d |
| Understanding | 262.5 | 0.13 | 0.21 | –0.16 | 188 | 0.00** | 0.48 | –0.49 | 1162 | 0.85 | 0.02 | 0.07 | 995 | 0.13 | 0.15 | –0.24 |
| Values | 189 | 0.00** | 0.39 | –0.79 | 219 | 0.00** | 0.43 | –0.72 | 1295.5 | 0.28 | 0.11 | –0.09 | 927.5 | 0.05* | 0.2 | –0.22 |
| Career | 167 | 0.00** | 0.44 | –0.73 | 77.5 | 0.00** | 0.69 | –1.37 | 1305.5 | 0.66 | 0.04 | –0.19 | 1172 | 0.79 | 0.03 | –0.15 |
| Social | 232.5 | 0.04* | 0.28 | –0.64 | 129 | 0.00** | 0.58 | –1.81 | 1243 | 0.45 | 0.08 | –0.14 | 794 | 0.00** | 0.29 | –0.62 |
| Enhancement | 205.5 | 0.01** | 0.35 | –0.43 | 175.5 | 0.00** | 0.49 | –0.56 | 1376.5 | 0.48 | 0.07 | –0.26 | 995 | 0.13 | 0.15 | –0.26 |
| Protective | 206 | 0.01** | 0.34 | –0.94 | 97 | 0.00** | 0.67 | –2.16 | 1038 | 0.06. | 0.21 | –0.63 | 990.5 | 0.12 | 0.15 | –0.35 |
| Attitude | 505 | 0.00** | 0.4 | 0.35 | 347 | 0.32 | 0.13 | –0.11 | 873.5 | 0.67 | 0.05 | 0.02 | 1664.5 | 0.00** | 0.32 | –0.23 |
| Subjective norms | 234 | 0.05* | 0.28 | –0.6 | 124 | 0.00** | 0.59 | –1.67 | 1223 | 0.75 | 0.03 | 0 | 1034.5 | 0.22 | 0.12 | –0.26 |
[i] Notes: ATRAP: Action Towards Reducing Aquatic Snail-Borne Parasitic Diseases, d: the difference between the mean scores of the motivational factors of the citizen scientists and control group (i.e., µCSs-µCG), GO: Geo-Observers, r: effect size, significant differences detected at .p < 0.1 *:p < 0.05, **:p < 0.01 and W: test statistic for the Mann-Whitney U test.
Table 5
Changes in motivational factor scores over time showing the differences between initial and follow-up interview settings for individuals who participated in both interviews, represented per respondent group and citizen science (CS) network.
| CS NETWORK | ATRAP | GO | ||||||||||||||
|---|---|---|---|---|---|---|---|---|---|---|---|---|---|---|---|---|
| RESPONDENT GROUP | CITIZEN SCIENTISTS | CONTROL GROUP | CITIZEN SCIENTISTS | CONTROL GROUP | ||||||||||||
| INTERVIEW SETTING/TIMESTEP | µINDIVIDUAL (INITIAL) | µGROUP (FOLLOW-UP) | dt | r | µINDIVIDUAL (INITIAL) | µGROUP (FOLLOW-UP) | dt | r | µGROUP (INITIAL) | µINDIVIDUAL (FOLLOW-UP) | dt | r | µGROUP (INITIAL) | µINDIVIDUAL (FOLLOW-UP) | dt | r |
| Understanding | 6.43 | 6.35 | –0.08 | 0.04 | 6.61 | 6.81 | 0.2* | 0.5 | 6.39 | 6.37 | –0.02 | 0.11 | 6.29 | 6.51 | 0.22 | 0.25 |
| Values | 5.88 | 5.85 | –0.03 | 0.11 | 6.69 | 6.63 | –0.06 | 0.3 | 6.06 | 6.15 | 0.09 | 0.21 | 6 | 6.29 | 0.29** | 0.49 |
| Career | 5.61 | 5.33 | –0.28 | 0.12 | 6.44 | 6.71 | 0.27* | 0.4 | 6.27 | 6.21 | –0.06 | 0.03 | 6.42 | 6.24 | –0.18 | 0.15 |
| Social | 4.87 | 4.63 | –0.24 | 0.18 | 5.56 | 6.44 | 0.9** | 0.6 | 5.46 | 5.06 | –0.4 | 0.18 | 5.59 | 5.62 | 0.03 | 0.03 |
| Enhancement | 5.91 | 6.15 | 0.24 | 0.14 | 6.37 | 6.69 | 0.32* | 0.5 | 6.17 | 6.1 | –0.07 | 0.09 | 6.29 | 6.27 | –0.02 | 0.05 |
| Protective | 4.6 | 3.7 | –0.9* | 0.52 | 5.46 | 5.77 | 0.31 | 0.2 | 5.22 | 4.76 | –0.46* | 0.29 | 5.83 | 5.12 | –0.71** | 0.48 |
| Attitude | 6.37 | 6.69 | 0.32** | 0.61 | 6.09 | 6.77 | 0.68** | 0.8 | 6.38 | 5.98 | –0.4* | 0.39 | 6.34 | 5.76 | –0.58** | 0.72 |
| Subjective norms | 5.05 | 4.43 | –0.62 | 0.33 | 5.77 | 6.18 | 0.41* | 0.4 | 6.23 | 5.47 | –0.76** | 0.59 | 6 | 5.66 | –0.34** | 0.41 |
[i] Notes: ATRAP: Action Towards Reducing Aquatic Snail-Borne Parasitic Diseases, dt: the difference between the mean scores of the motivational factors in the initial and the follow-up interview, GO: Geo-Observers, r: effect size, significant differences detected at .p < 0.1 *:p < 0.05, **:p < 0.01and µ:average score for the motivational factors.
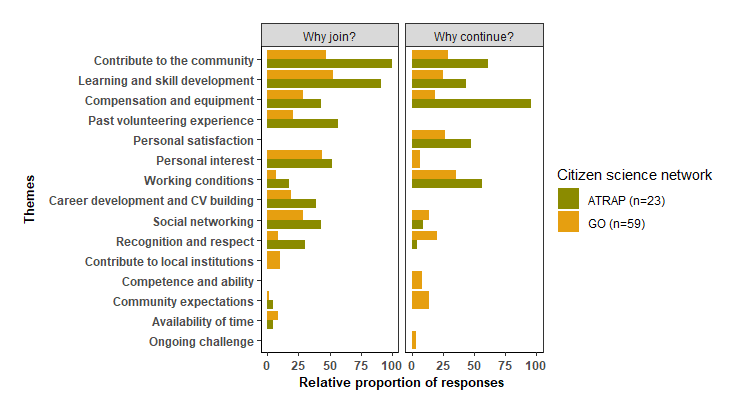
Figure 2
Themes reflecting personal motivational factors identified through thematic analysis of individual interview data with citizen scientists. ATRAP: Action Towards Reducing Aquatic Snail-Borne Parasitic Diseases, GOs: Geo-Observers.
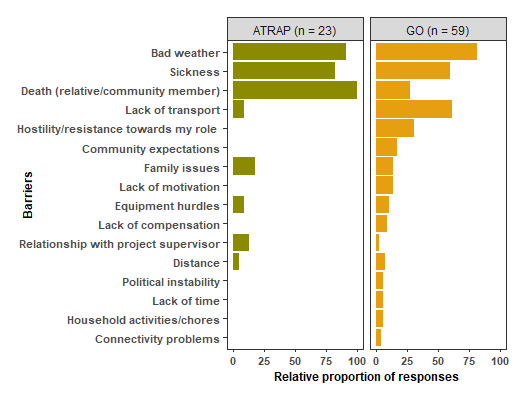
Figure 3
Proportion of citizen scientists reporting each participation barrier, based on data from individual interviews. ATRAP: Action Towards Reducing Aquatic Snail-Borne Parasitic Diseases, GOs: Geo-Observers.