
Introduction
Citizen science (CS), an approach that actively engages the public in scientific research through data collection, analysis, and/or problem-solving, has gained popularity; however, participant recruitment and retention remain significant challenges (Haklay 2013; West and Pateman 2016). Research shows that ineffective recruitment strategies could lead to low participation, high drop-out, low-quality contributions, and eventually unsuccessful CS initiatives (Nov, Arazy, and Anderson 2014; Martin et al. 2016; West and Pateman 2016). Consequently, understanding what initiates, guides, and sustains one’s actions is crucial for designing effective recruitment and retention strategies in CS initiatives (Alender 2016; Beza et al. 2017). As such, research on motivation within CS has grown, although such studies remain skewed to the Global North (Jeanmougin, Levontin and Schwartz 2016; West, Dyke, and Pateman 2021).
Despite the increase in motivational research, systematic research on motivations and barriers in the context of CS is limited. Occasionally, theories from psychology and volunteering have been applied to understand why people engage in CS (Asingizwe et al. 2020; West, Dyke, and Pateman 2021; Levontin et al. 2022). Frameworks such as Batson, Ahmad, and Tsang’s (2002) four motives (egoism, altruism, collectivism, and principlism) for community involvement and Finkelstien’s (2009) intrinsic and extrinsic motivations have offered valuable insights into participant motivations. However, the Volunteer Functions Inventory (VFI) and the Theory of Planned Behaviour (TPB) are more widely applied to understand motivations in the CS field (Wright et al. 2015; Martin et al. 2016; Wehn and Almomani 2019; Levontin et al. 2022).
The VFI, based on the functional theory, proposes six key reasons for volunteering. These include: values (concern for an important cause), understanding (a desire to gain knowledge or skills), social (building or strengthening connections), career (an opportunity to gain experience), protective (addressing negative feelings) and enhancement (to gain a sense of accomplishment) (Clary et al. 1998). As such, the VFI provides a ready framework to explore the diverse motivations behind volunteering.
Additionally, the TPB has been widely used to understand human behaviour and decision-making processes (Ajzen 2012). According to the TPB, intention to engage in a behaviour is influenced by three factors: attitude (positive or negative evaluation of the action); subjective norms (opinions and expectations of significant others like family or friends), and perceived behavioural control (PBC; ease or difficulty in engaging in the action, which can be related to one’s skills, knowledge, and available resources). Therefore, having a positive attitude, strong social influence, and a high PBC increases the likelihood of behaviour adoption (Ajzen 2002). Research shows that additional factors such as self-identity and moral obligation play a significant role in shaping intentions (Hagger and Chatzisarantis 2006; Chen 2020).
In the context of CS, research indicates that CS participants are often motivated by contributing to scientific research and acquiring new skills, which align with VFI factors of values and understanding (Beza et al. 2017; Domroese and Johnson 2017; Land-Zandstra, Agnello, and Gültekin 2021; Walker et al. 2021; Etter et al. 2023). Additionally, previous studies have observed age-related differences in motivation, with younger participants often prioritising career advancement, while older participants are driven by the selfless desire to help others or by altruism (Alender 2016; West, Dyke, and Pateman 2021). Norm-oriented factors (corresponding to subjective norms of the TPB) were found to be strongly correlated with the intention to participate in technology-mediated CS initiatives (Nov, Arazy, and Anderson 2011). Meanwhile, PBC significantly influenced the intention to contribute to marine-related CS initiatives (Martin et al. 2016).
Pioneer research on CS motivations in the Global South shows similar motivational patterns. For example, Wright et al. (2015) found that recreational or nature-related interests and personal values are important factors for individuals monitoring birds. Likewise, Asingizwe et al. (2020) noted that individuals joined a CS program for malaria control in Rwanda out of curiosity and a desire to learn.
However, several scholars note that motivation is not homogenous and may depend on cultural norms, tasks, and participant demographic characteristics (Nov, Arazy, and Anderson 2014; Domroese and Johnson 2017; Asingizwe et al. 2020). Additionally, while CS is promoted as a tool for democratizing science, various factors have been reported to hinder participation (Pateman and West 2023; Varga et al. 2023). Terenzini, Safaya, and Falkenberg (2023) pointed out that people with low economic and educational backgrounds may face unique challenges that limit their involvement in CS. In another study, Benyei et al. (2023) noted that participation is hindered by challenges like a lack of infrastructure in marginalized and indigenous communities. Therefore, insights into exclusionary processes, such as incentives and barriers to participation, are needed, particularly in the Global South, where CS is emerging and socioeconomic conditions differ from those in the Global North (Hulbert, Turner, and Scott 2019; Walker, Smigaj, and Tani 2021; Elias et al. 2023).
Therefore, we aim herein to address the knowledge gap regarding motivations and challenges faced by individuals in the Global South by learning from two CS networks established in southwest Uganda. We address two main research questions:
RQ1: What are the primary drivers of participation in CS in southwest Uganda?
Sub-question 1.1: Is there a difference in motivational factors across respondent groups of each CS network?
Sub-question 1.2: How do the motivations of citizen scientists and non–citizen scientists change over time?
RQ2: What barriers do the CS participants in southwest Uganda encounter?
To respond to these questions, this study utilized both the VFI and TPB frameworks as proposed by Brayley et al. (2015), alongside open-ended questions for a richer context. This study responds to Walker et al.’s (2021) call for motivational assessments of citizen scientists in the Global South to improve participant targeting and retention.
Methods
Study context
To explore the motivations and challenges of CS participation, the study leveraged three ongoing projects established in selected communities across Southwest Uganda. While all three projects shared the aim of engaging communities in data collection for the United Nations Sustainable Development Goals (UN SDGs), D-SIRE (Digital Science for Community-Based Resilient Environmental Management) and HARISSA (Natural Hazards, Risks, and Society in Africa) addressed environmental hazards and disaster risk reduction (SDG target 11.5); whereas ATRAP (Action Towards Reducing Aquatic Snail-Borne Parasitic Diseases) targeted the control of a neglected tropical disease, schistosomiasis (SDG target 3.3).
D-SIRE was implemented in February 2017 within three frequently affected districts of Bundibugyo, Kabarole, and Kasese, of the Rwenzori Mountains region. The project recruited 30 community members dubbed Geo-Observers (GOs) to collect data on floods and landslides, among other natural disasters. In 2019, the project expanded to the Buhweju and Bushenyi districts, recruiting 15 new GOs (Jacobs et al. 2019; Sekajugo et al. 2022). That same year, a sister project, HARISSA was initiated within the Rubanda, Kabale, and Kisoro districts in the Kigezi region. Likewise, 15 community members, also called GOs, were recruited to monitor and document natural hazards and disasters in these areas (Kanyiginya et al. 2023). ATRAP started in 2019 along the southern region of Lake Albert and nearby catchments to combat schistosomiasis, a neglected snail-borne disease. Likewise, 25 community members (dubbed “citizen researchers”) sampled snail populations weekly at fixed sites in two districts: Kagadi and Ntoroko (Brees et al. 2021; Tumusiime et al. 2024). Together, these projects formed the DATRISSA consortium, a collaboration between research institutions in Uganda, Belgium, and other East African countries.
Study participants
The study comprised two respondent groups: 1) active CS participants (individuals formally recruited, trained, equipped, and compensated by the projects) and 2) a control group of candidate citizen scientists (community members pre-identified as potential candidates but never selected to contribute to any project activities). Both groups were formed during the initial recruitment phase of the projects. Recruitment for all projects was conducted through local leaders and stakeholders who nominated potential individuals primarily from existing community structures. From this pool of nominees, project leaders selected a subset of individuals, hereafter referred to as citizen scientists, to contribute to project goals. The citizen scientists were trained and equipped with smartphones and other field gear for data collection. They also received financial compensation to cover costs incurred, like mobile data and transportation (Jacobs et al. 2019; Brees et al. 2021; Sekajugo et al. 2022; Kanyiginya et al. 2023). The remaining nominees who were not officially selected due to budgetary constraints formed the study’s control group, hereafter referred to as the control group (CG). Although not actively involved in project activities, the CG were aware of the initiatives and remained as potential backups in case replacements were needed. Including this group allowed for comparison of motivations and perceptions between those actively involved in the projects and those who were not.
Survey design and selection of motivational factors
The study adopted a mixed methods approach, primarily using the VFI and TPB as the theoretical foundation of our investigation into the motivations of individuals in Uganda. The TPB and VFI scale items (i.e., individual questionnaire statements) were generated by reviewing relevant literature, and were tailored to correspond with the specific tasks of the CS networks described earlier (Ajzen 2002; Niebuur et al. 2019; Wehn and Almomani 2019). The project-specific phrasing of each item can be found in Supplemental File 1: Appendix 1a.
The VFI section had standard inventory items suggested by Clary et al. (1998). Each VFI factor described in the Introduction was assessed using five items, totalling thirty items, rated on a seven-point Likert scale ranging from extremely inaccurate/unimportant to extremely accurate/important. The values items reflected the importance of helping others (e.g., I collect and report data on [CS activity] because I feel it is important to help others). The protective items were oriented towards alleviating guilt (e.g., collecting and reporting data on [CS activity] is a good escape from my own problems). The understanding items emphasized the pursuit of knowledge (e.g., collecting and reporting data on [CS activity] allows me to gain a new perspective on things). The enhancement items highlighted enhancing self-esteem (e.g., collecting and reporting data on [CS activity] increases my self-esteem), while the social item addressed societal influence (e.g., people who I’m close to want me to collect and report data on [CS activity]). Lastly, the career items were all about building one’s career path (e.g., collecting and reporting data on [CS activity] allows me to explore different career options).
Conversely, only two (attitudes and subjective norms) of the six TPB factors assessed are discussed here, following a rigorous internal consistency reliability evaluation as outlined in Ashepet et al. (2024). Each of the retained TPB factors was measured using six items on a seven-point Likert. Attitudes were measured using semantic scales with responses such as “foolish/wise,” while subjective norms were measured with items corresponding to the opinion of significant others (e.g., people who are important to me think that I should report [CS activity] data weekly). The response options for subjective norms items ranged from one (strongly disagree) to seven (strongly agree). To avoid bias, the VFI and TPB questions were randomly placed in the questionnaire.
The qualitative section, exclusive to the citizen scientists, consisted of three key questions: two open-ended questions exploring personal reasons for joining and continuing to participate in the CS networks, and a question identifying potential challenges using predefined response choices. This section was strategically placed before the quantitative section in the survey to minimize potential influences from the quantitative responses (Wright et al. 2015).
Data collection
Data was collected through a semi-structured questionnaire composed of three sections: 1) a quantitative section to determine participant motives based on the TPB and VFI factors, 2) a qualitative section to uncover additional motives and constraints, and 3) a section to gather demographic characteristics like age, gender, occupation status, and education level. The questionnaire was administered face-to-face by the first author (together with research assistants) to ensure clear communication and minimize misinterpretation. Since the questionnaire was only in English, in-person interviews allowed for back-translation and immediate clarification of questions (Mukherjee et al. 2018; Young et al. 2018). Researchers also recorded notes and non-verbal cues for additional context. The questions were posed in a conversational style under two interview settings: individual and group-based sessions. This was done deliberately to provide privacy for more personal responses during the individual sessions, while group sessions were designed to foster a supportive environment, helping the respondents feel less isolated (Milewski and Otto 2017). Data was collected from both citizen scientists and CG members at different moments between 2019 and 2021 (Table 1). Consequently, four data sets were generated per CS network and interview setting, that is, ATRAP (Individual: n = 53; Group; n = 58) and GO (Individual: n = 100; Group: n = 107).
Table 1
Data collection periods per respondent group, interview setting, and CS network. ATRAP: Action Towards Reducing Aquatic Snail-Borne Parasitic Diseases.
| PROJECT | RESPONDENT GROUP | NUMBER OF RESPONDENTS | DATE OF INTERVIEW | INTERVIEW SETTING |
|---|---|---|---|---|
| Geo-Observers | Citizen scientists | 51 | Aug and Nov 2019 | Group |
| 59 | Jan and Feb 2021 | Individual | ||
| Control group | 56 | Nov 2019 | Group | |
| 41 | Jan and Feb 2021 | Individual | ||
| ATRAP | Citizen scientists | 23 | Jan 2021 | Individual |
| 24 | Oct 2021 | Group | ||
| Control group | 30 | Jan 2021 | Individual | |
| 34 | Nov 2021 | Group |
Data analysis
Data analysis entailed the following steps, largely inspired by Beza et al. (2017).
To address RQ1, internal consistency reliability was first recomputed for VFI/TPB factors whose McDonald’s omega was below 0.7, the threshold for acceptable reliability (Flora 2020). Items with weak item-total correlations (r < 0.3) were removed, and only factors that approached or exceeded a McDonald’s omega of 0.7 were retained (Supplemental File 1: Appendix 1b) (Boonyaratana et al. 2021). Next, the mean scores of the retained factors were computed per CS network, respondent group, and interview setting to identify the primary motivational factors. Then, the Mann-Whitney U test was used to compare the mean scores between the factors to statistically identify the primary motivational factors. The Benjamini-Hochberg (BH) correction was applied to control for the risk of Type I errors due to multiple comparisons (Glueck et al. 2008).
To understand how motivational factors differ between the respondent groups (sub-question 1.1), the Mann-Whitney U test was used to compare the factor scores between citizen scientists and the CG within each CS network. The comparisons were performed separately for each CS network and interview setting.
For sub-question 1.2, regarding how motivational factors might change over time, the difference in scores between the two interview settings was computed for each factor (i.e., responses from the initial and follow-up interviews were compared). Only individuals who participated in both interview settings were included for meaningful analysis. To further explore changes in motivation, personal reasons for joining and continuing to participate in the CS networks were assessed using qualitative content analysis in NVivo 1.7.1 (iv). The responses to the open-ended questions were coded, aggregated, and visualized (Beza et al. 2017; Asingizwe et al. 2020).
To respond to RQ2, descriptive statistics were used to summarize data about the citizen scientists’ challenges. Similarly, the demographic variables of the respondents were summarized using descriptive statistics and presented in frequency tables. Cross-tabulations and Chi-Square tests were used to assess demographic differences between respondent groups.
Apart from the thematic analysis, all other analyses were conducted in R version 4.2.2, and the criterion for establishing statistical significance was set at p ≤ 0.1, considering the sample size. The effect size (r) was estimated using Cohen’s d formula, where higher values (> 0.5) represent strong effects (Serdar et al. 2020).
Results
Respondent demographics
Across CS networks, respondents were mostly male, aged between 30 and 39 years, held mid-level education, and were self-employed (Table 2). Significant differences were detected in respondent age and past volunteering experience. The ATRAP network was characterized by relatively older respondents with a volunteering history, whereas the GO network was characterized by higher overall levels of education.
Table 2
Demographic characteristics of the study respondents. Bolded cells represent statistically significant differences between similar groups.
| VARIABLE | CITIZEN SCIENCE NETWORK AND RESPONDENT GROUP | |||||||||||
|---|---|---|---|---|---|---|---|---|---|---|---|---|
| ATRAP_ALL | ATRAP_CSs | ATRAP_CG | GO_ALL | GO_CSs | GO_CG | |||||||
| n | % | n | % | n | % | n | % | n | % | n | % | |
| Age: mean (sd) | 36.3 (7.2) | 37.8(6.7) | 35.2 (7.4) | 32.1(8.5) | 33.1(8.8) | 31.2(8.2) | ||||||
| Age groups | ||||||||||||
| 20–29 | 7 | 13.2 | 2 | 8.7 | 5 | 16.7 | 43 | 40.2 | 20 | 39.2 | 23 | 41 |
| 30–39 | 27 | 50.9 | 9 | 39 | 18 | 60 | 46 | 43 | 19 | 37.3 | 27 | 48 |
| 40–49 | 16 | 30.2 | 11 | 48 | 5 | 16.7 | 11 | 10.3 | 8 | 15.7 | 3 | 5.4 |
| 50+ | 3 | 5.7 | 1 | 4.3 | 2 | 6.7 | 6 | 5.61 | 3 | 5.9 | 3 | 5.4 |
| Not indicated | 0 | 0 | 0 | 0 | 0 | 0 | 1 | 0.9 | 1 | 2 | 0 | 0 |
| Occupation status | ||||||||||||
| Employed | 8 | 15.1 | 3 | 13 | 5 | 16.7 | 17 | 15.9 | 6 | 11.8 | 11 | 20 |
| No income-generating activity | 5 | 9.4 | 2 | 8.7 | 3 | 10 | 14 | 13.1 | 3 | 5.9 | 11 | 20 |
| Self-employed | 40 | 75.5 | 18 | 78 | 22 | 73.3 | 76 | 71 | 42 | 82.4 | 34 | 61 |
| Gender | ||||||||||||
| Female | 12 | 22.6 | 6 | 26 | 6 | 20 | 29 | 27.1 | 12 | 23.5 | 17 | 30 |
| Male | 41 | 77.4 | 17 | 74 | 24 | 80 | 78 | 72.9 | 39 | 76.5 | 39 | 70 |
| Education level | ||||||||||||
| Primary level | 11 | 20.8 | 4 | 17 | 7 | 23.3 | 15 | 14 | 7 | 13.7 | 8 | 14.3 |
| Lower secondary | 19 | 35.8 | 10 | 44 | 9 | 30 | 25 | 23.4 | 10 | 19.6 | 15 | 26.9 |
| Upper secondary | 6 | 11.3 | 4 | 17 | 2 | 6.7 | 23 | 21.5 | 14 | 27.5 | 9 | 16.1 |
| High (University or tertiary) | 17 | 32.1 | 5 | 22 | 12 | 40 | 44 | 41.1 | 20 | 39.2 | 24 | 42.9 |
| Past volunteering experience | ||||||||||||
| Yes | 49 | 92.5 | 20 | 87 | 29 | 96.7 | 26 | 24.3 | 24 | 47.1 | 2 | 3.6 |
| No | 4 | 7.55 | 3 | 13 | 1 | 3.3 | 24 | 22.4 | 22 | 43.1 | 2 | 3.6 |
| Not indicated | 0 | 0 | 0 | 0 | 0 | 0 | 57 | 53.3 | 5 | 9.8 | 52 | 92.9 |
[i] Notes: ATRAP: Action Towards Reducing Aquatic Snail-Borne Parasitic Diseases, CSs: citizen scientists; CG: control group, GO: Geo-Observers.
Primary motivational factors
Excluding weakly correlated items resulted in improved internal consistency reliability of the factors (e.g., Understanding for the ATRAP individual interviews: ω = 0.27 before and ω = 0.58 after) (Supplemental File 1: Appendix 1b). As such, all VFI/TPB factors proposed above were retained, albeit with some modifications. Overall, the factors Understanding and Values received high mean scores while Social and Protective generally received low mean scores across CS networks, respondent groups, and interview settings (Figure 1). Statistical comparisons between the motivational factors confirmed the visual patterns observed in Figure 1, with Understanding and Values significantly more important than Social and Protective factors across the CS networks, regardless of the interview setting (Table 3; red-shaded cells). This pattern persisted even when the pooled data were split into respondent groups (Supplemental File 2: Supplemental Table 1).
Table 3
Comparisons of mean scores between motivational factors using the Mann-Whitney U test and BH correction for multiple comparisons. Significant differences between the highest-scoring factors (Understanding, Values) and the lowest-scoring factors (Social, Protective) are highlighted in bold.
| CITIZEN SCIENCE NETWORK | ATRAP | GO | ||||||||||
|---|---|---|---|---|---|---|---|---|---|---|---|---|
| INTERVIEW SETTING | GROUP(n = 58) | INDIVIDUAL(n = 53) | GROUP(n = 107) | INDIVIDUAL(n = 100) | ||||||||
| COMPARISONS | W | p.adj | r | W | p.adj | r | W | p.adj | r | W | p.adj | r |
| Understanding_Values | 964 | 0.73 | 0.04 | 1012 | 0.53 | 0.08 | 3840.5 | 0.00** | 0.23 | 4212.5 | 0.14 | 0.12 |
| Understanding_Career | 1157 | 0.07. | 0.22 | 1250 | 0.00** | 0.31 | 3026 | 0.74 | 0.03 | 4119 | 0.23 | 0.10 |
| Understanding_Social | 1334.5 | 0.00** | 0.39 | 1557 | 0.00** | 0.59 | 4445.5 | 0.00** | 0.40 | 6217.5 | 0.00** | 0.59 |
| Understanding_Enhancement | 1043.5 | 0.36 | 0.11 | 1231 | 0.00** | 0.29 | 3619.5 | 0.25 | 0.10 | 4377.5 | 0.05* | 0.16 |
| Understanding_Protective | 1579 | 0.00** | 0.61 | 1636 | 0.00** | 0.67 | 4131 | 0.00** | 0.43 | 6381.5 | 0.00** | 0.63 |
| Understanding_Attitude | 825 | 0.42 | 0.10 | 1340 | 0.00** | 0.39 | 2605.5 | 0.53 | 0.06 | 5885 | 0.00** | 0.51 |
| Understanding_Subjective norms | 1429.5 | 0.00** | 0.48 | 1610 | 0.00** | 0.64 | 3665.5 | 0.12 | 0.14 | 6194.5 | 0.00** | 0.59 |
| Values_Career | 1109.5 | 0.14 | 0.18 | 1149 | 0.07. | 0.21 | 2234 | 0.00** | 0.23 | 3600 | 0.76 | 0.02 |
| Values_Social | 1259 | 0.00** | 0.32 | 1464.5 | 0.00** | 0.51 | 3890 | 0.00** | 0.27 | 5725 | 0.00** | 0.47 |
| Values_Enhancement | 985.5 | 0.61 | 0.06 | 1118.5 | 0.12 | 0.18 | 2700.5 | 0.16 | 0.13 | 3810 | 0.76 | 0.03 |
| Values_Protective | 1485.5 | 0.00** | 0.53 | 1540 | 0.00** | 0.58 | 3447 | 0.00** | 0.24 | 5995.5 | 0.00** | 0.54 |
| Values_Attitude | 813 | 0.36 | 0.11 | 1222 | 0.00** | 0.28 | 1907.5 | 0.00** | 0.26 | 5176 | 0.00** | 0.35 |
| Values_Subjective norms | 1336.5 | 0.00** | 0.39 | 1490.5 | 0.00** | 0.53 | 2759.5 | 0.32 | 0.09 | 5646.5 | 0.00** | 0.46 |
| Career_Social | 1097 | 0.18 | 0.16 | 1320.5 | 0.00** | 0.37 | 4424 | 0.00** | 0.39 | 5672 | 0.00** | 0.46 |
| Career_Enhancement | 798 | 0.34 | 0.12 | 879.5 | 0.73 | 0.04 | 3675 | 0.18 | 0.12 | 3934 | 0.51 | 0.06 |
| Career_Protective | 1361.5 | 0.00** | 0.41 | 1384.5 | 0.00** | 0.43 | 4111.5 | 0.00** | 0.42 | 5994 | 0.00** | 0.54 |
| Career_Attitude | 600.5 | 0.00** | 0.31 | 932 | 0.95 | 0.01 | 2702 | 0.72 | 0.03 | 5154 | 0.00** | 0.34 |
| Career_Subjective norms | 1178 | 0.05* | 0.24 | 1288.5 | 0.00** | 0.34 | 3695 | 0.1. | 0.15 | 5602.5 | 0.00** | 0.45 |
| Social_Enhancement | 622 | 0.02* | 0.28 | 455.5 | 0.00** | 0.44 | 1899.5 | 0.00** | 0.35 | 1761.5 | 0.00** | 0.45 |
| Social_Protective | 1199.5 | 0.03* | 0.26 | 969.5 | 0.73 | 0.04 | 2547.5 | 0.64 | 0.05 | 4325 | 0.07. | 0.15 |
| Social_Attitude | 435.5 | 0.00** | 0.46 | 451.5 | 0.00** | 0.44 | 1380.5 | 0.00** | 0.43 | 2724 | 0.00** | 0.23 |
| Social_Subjective norms | 1014 | 0.48 | 0.08 | 837 | 0.53 | 0.08 | 1963 | 0.00** | 0.31 | 3397 | 0.4 | 0.07 |
| Enhancement_Protective | 1502.5 | 0.00** | 0.54 | 1458.5 | 0.00** | 0.50 | 4012 | 0.00** | 0.34 | 5980 | 0.00** | 0.53 |
| Enhancement_Attitude | 704.5 | 0.08. | 0.21 | 992 | 0.63 | 0.06 | 2360.5 | 0.07. | 0.16 | 5088.5 | 0.00** | 0.33 |
| Enhancement_Subjective norms | 1329.5 | 0.00** | 0.38 | 1378 | 0.00** | 0.42 | 3397 | 0.72 | 0.03 | 5541 | 0.00** | 0.43 |
| Protective_Attitude | 214.5 | 0.00** | 0.67 | 392.5 | 0.00** | 0.50 | 1137 | 0.00** | 0.47 | 2120.5 | 0.00** | 0.37 |
| Protective_Subjective norms | 735 | 0.14 | 0.18 | 779 | 0.27 | 0.14 | 1766 | 0.00** | 0.32 | 2756 | 0.00** | 0.22 |
| Attitude_Subjective norms | 1496 | 0.00** | 0.54 | 1383 | 0.00** | 0.43 | 3463 | 0.03* | 0.19 | 4496.5 | 0.00** | 0.19 |
[i] Notes: ATRAP: Action Towards Reducing Aquatic Snail-Borne Parasitic Diseases, GO: Geo-Observers, p.adj: p-value after the BH correction for multiple comparisons, significant differences between the motivational factors detected at .p < 0.1 *: p < 0.05, **p < 0.01, r: effect size and W: test statistic for the Mann-Whitney U test.
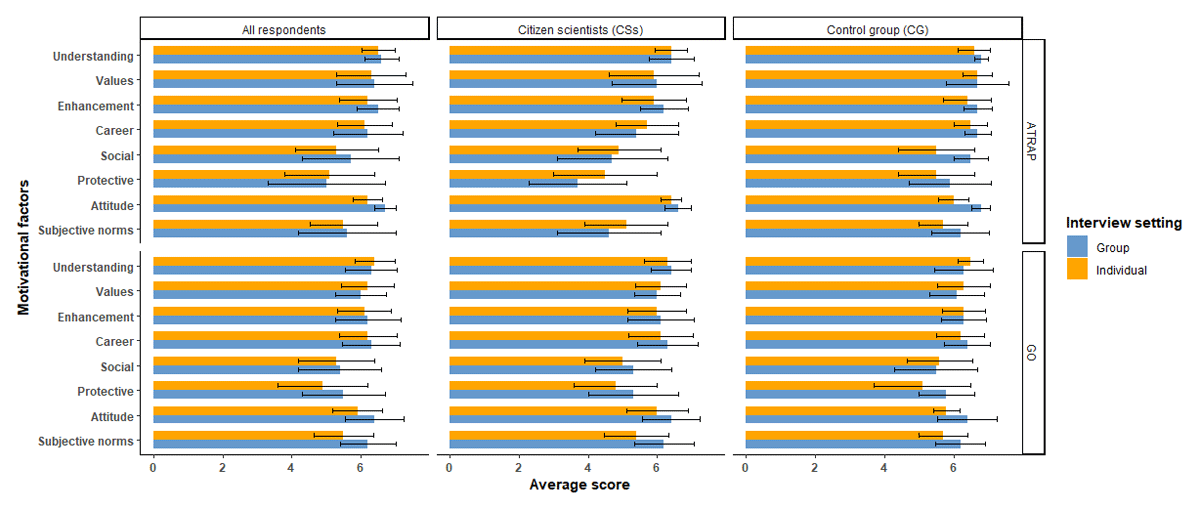
Figure 1
Mean scores of the motivational factors across citizen science networks, respondent group, and interview setting, with error bars indicating the standard deviation (Source of data: all datasets generated).
When comparing motivational factors between respondent groups (sub-question 1.1), the difference in factor scores (column d in Table 4) indicated that the citizen scientists consistently scored lower on average compared with the CG across both CS networks (see the negative values). However, significant differences between the citizen scientists’ and the CGs’ scores were found in nearly all factors within the ATRAP network, regardless of the interview setting. In contrast, significant differences between respondent groups of the GO network were rare for most factors across both interview settings (Table 4).
Table 4
Comparisons of motivational factors between the respondent groups per citizen science (CS) network and interview settings using the Mann-Whitney U test.
| CS NETWORK | ATRAP | GO | ||||||||||||||
|---|---|---|---|---|---|---|---|---|---|---|---|---|---|---|---|---|
| INTERVIEW SETTING | INDIVIDUAL | GROUP | GROUP | INDIVIDUAL | ||||||||||||
| COMPARISONS (CITIZEN SCIENTISTS~CONTROL GROUP) | W | P-VALUE | r | d | W | P-VALUE | r | d | W | P-VALUE | R | d | W | P-VALUE | r | d |
| Understanding | 262.5 | 0.13 | 0.21 | –0.16 | 188 | 0.00** | 0.48 | –0.49 | 1162 | 0.85 | 0.02 | 0.07 | 995 | 0.13 | 0.15 | –0.24 |
| Values | 189 | 0.00** | 0.39 | –0.79 | 219 | 0.00** | 0.43 | –0.72 | 1295.5 | 0.28 | 0.11 | –0.09 | 927.5 | 0.05* | 0.2 | –0.22 |
| Career | 167 | 0.00** | 0.44 | –0.73 | 77.5 | 0.00** | 0.69 | –1.37 | 1305.5 | 0.66 | 0.04 | –0.19 | 1172 | 0.79 | 0.03 | –0.15 |
| Social | 232.5 | 0.04* | 0.28 | –0.64 | 129 | 0.00** | 0.58 | –1.81 | 1243 | 0.45 | 0.08 | –0.14 | 794 | 0.00** | 0.29 | –0.62 |
| Enhancement | 205.5 | 0.01** | 0.35 | –0.43 | 175.5 | 0.00** | 0.49 | –0.56 | 1376.5 | 0.48 | 0.07 | –0.26 | 995 | 0.13 | 0.15 | –0.26 |
| Protective | 206 | 0.01** | 0.34 | –0.94 | 97 | 0.00** | 0.67 | –2.16 | 1038 | 0.06. | 0.21 | –0.63 | 990.5 | 0.12 | 0.15 | –0.35 |
| Attitude | 505 | 0.00** | 0.4 | 0.35 | 347 | 0.32 | 0.13 | –0.11 | 873.5 | 0.67 | 0.05 | 0.02 | 1664.5 | 0.00** | 0.32 | –0.23 |
| Subjective norms | 234 | 0.05* | 0.28 | –0.6 | 124 | 0.00** | 0.59 | –1.67 | 1223 | 0.75 | 0.03 | 0 | 1034.5 | 0.22 | 0.12 | –0.26 |
[i] Notes: ATRAP: Action Towards Reducing Aquatic Snail-Borne Parasitic Diseases, d: the difference between the mean scores of the motivational factors of the citizen scientists and control group (i.e., µCSs-µCG), GO: Geo-Observers, r: effect size, significant differences detected at .p < 0.1 *:p < 0.05, **:p < 0.01 and W: test statistic for the Mann-Whitney U test.
When zooming in on the changes in motivational factors over time (sub-question 1.2), most factors showed a decrease in scores for the ATRAP citizen scientists, albeit significantly for the Protective factor (column d in Table 5). However, the ATRAP CG showed significant increases in factor scores. Conversely, both respondent groups in the GO network experienced declines in several motivational factors, with significant declines observed for three factors: Attitudes, Protective and Subjective norms (Table 5). Essentially, ATRAP CG were the only group that indicated significant increases in motivational factors, whereas ATRAP citizen scientists and both GO respondent groups showed motivational declines over time.
Table 5
Changes in motivational factor scores over time showing the differences between initial and follow-up interview settings for individuals who participated in both interviews, represented per respondent group and citizen science (CS) network.
| CS NETWORK | ATRAP | GO | ||||||||||||||
|---|---|---|---|---|---|---|---|---|---|---|---|---|---|---|---|---|
| RESPONDENT GROUP | CITIZEN SCIENTISTS | CONTROL GROUP | CITIZEN SCIENTISTS | CONTROL GROUP | ||||||||||||
| INTERVIEW SETTING/TIMESTEP | µINDIVIDUAL (INITIAL) | µGROUP (FOLLOW-UP) | dt | r | µINDIVIDUAL (INITIAL) | µGROUP (FOLLOW-UP) | dt | r | µGROUP (INITIAL) | µINDIVIDUAL (FOLLOW-UP) | dt | r | µGROUP (INITIAL) | µINDIVIDUAL (FOLLOW-UP) | dt | r |
| Understanding | 6.43 | 6.35 | –0.08 | 0.04 | 6.61 | 6.81 | 0.2* | 0.5 | 6.39 | 6.37 | –0.02 | 0.11 | 6.29 | 6.51 | 0.22 | 0.25 |
| Values | 5.88 | 5.85 | –0.03 | 0.11 | 6.69 | 6.63 | –0.06 | 0.3 | 6.06 | 6.15 | 0.09 | 0.21 | 6 | 6.29 | 0.29** | 0.49 |
| Career | 5.61 | 5.33 | –0.28 | 0.12 | 6.44 | 6.71 | 0.27* | 0.4 | 6.27 | 6.21 | –0.06 | 0.03 | 6.42 | 6.24 | –0.18 | 0.15 |
| Social | 4.87 | 4.63 | –0.24 | 0.18 | 5.56 | 6.44 | 0.9** | 0.6 | 5.46 | 5.06 | –0.4 | 0.18 | 5.59 | 5.62 | 0.03 | 0.03 |
| Enhancement | 5.91 | 6.15 | 0.24 | 0.14 | 6.37 | 6.69 | 0.32* | 0.5 | 6.17 | 6.1 | –0.07 | 0.09 | 6.29 | 6.27 | –0.02 | 0.05 |
| Protective | 4.6 | 3.7 | –0.9* | 0.52 | 5.46 | 5.77 | 0.31 | 0.2 | 5.22 | 4.76 | –0.46* | 0.29 | 5.83 | 5.12 | –0.71** | 0.48 |
| Attitude | 6.37 | 6.69 | 0.32** | 0.61 | 6.09 | 6.77 | 0.68** | 0.8 | 6.38 | 5.98 | –0.4* | 0.39 | 6.34 | 5.76 | –0.58** | 0.72 |
| Subjective norms | 5.05 | 4.43 | –0.62 | 0.33 | 5.77 | 6.18 | 0.41* | 0.4 | 6.23 | 5.47 | –0.76** | 0.59 | 6 | 5.66 | –0.34** | 0.41 |
[i] Notes: ATRAP: Action Towards Reducing Aquatic Snail-Borne Parasitic Diseases, dt: the difference between the mean scores of the motivational factors in the initial and the follow-up interview, GO: Geo-Observers, r: effect size, significant differences detected at .p < 0.1 *:p < 0.05, **:p < 0.01and µ:average score for the motivational factors.
However, results from the open-ended questions revealed that motivational factors among the citizen scientists changed over time. While the initial motivational factors were contributing to the community and learning across both CS networks, corresponding to the VFI factors Values and Understanding, respectively (Figure 2), motivational factors changed over time. As time progressed, ATRAP citizen scientists were more motivated by the compensation and equipment received, whereas the working conditions, such as flexible working times, were important for the GO citizen scientists (Figure 2). Moreover, eleven additional motivational factors were identified, extending beyond but arguably overlapping with some VFI/TPB factors (Supplemental File 3: Appendix 2).

Figure 2
Themes reflecting personal motivational factors identified through thematic analysis of individual interview data with citizen scientists. ATRAP: Action Towards Reducing Aquatic Snail-Borne Parasitic Diseases, GOs: Geo-Observers.
Barriers to participation
Overall, citizen scientists in both CS networks shared common challenges, although the GO network reported more barriers than their ATRAP counterparts (Figure 3). Across both networks, life events and external conditions such as sickness (ATRAP: n = 23; GO: n = 35) and bad weather (ATRAP: n = 21; GO: n = 48) were major barriers. However, the GO citizen scientists faced additional unique challenges like a lack of transport (n = 36) and hostility towards their role (n = 18).

Figure 3
Proportion of citizen scientists reporting each participation barrier, based on data from individual interviews. ATRAP: Action Towards Reducing Aquatic Snail-Borne Parasitic Diseases, GOs: Geo-Observers.
Discussion
Participant recruitment and retention are major CS challenges (West and Pateman 2016). In many resource-constrained regions, factors such as poor infrastructure, including limited internet connectivity, further complicate recruitment and retention efforts in CS initiatives (Benyei et al. 2023; Elias et al. 2023). Here, we identify factors that drive individuals to (dis)engage with CS in such regions, offering vital insights for those wishing to mobilize CS in similar places.
Unlike most CS initiatives that typically rely on voluntary contributions from the general public, both networks in this study used targeted recruitment through local leaders based on specific criteria (Lee et al. 2018; Brees et al. 2021). This approach was necessary to identify competent community members and foster trust within the communities, with the leaders acting as “locally trusted community gatekeepers” (Chiaravalloti et al. 2022). However, the recruitment strategy may have led to selection bias, leading to an overrepresentation of individuals with certain characteristics, for instance, prior volunteering experience within the ATRAP network, and higher education levels among the Geo-observer group. (Schumann et al. 2024). Nonetheless, both networks featured relatively young individuals with mid-level education, contrasting the typical profile of older, highly educated individuals in the Global North (Duerinckx et al. 2021). Additionally, despite efforts towards gender balance, both CS networks predominantly consisted of male individuals. While gender disparity is common in the CS field in Uganda, traditional gender roles and stereotypes may have amplified this (Ibrahim, Khodursky, and Yasseri 2021; Lubaale 2022). These patterns highlight the need to critically reflect on recruitment strategies to avoid excluding certain individuals, which could undermine many diversity-related benefits ably described by Pateman and West (2023).
The relative ranking of the motivational factors was remarkably consistent, irrespective of the interview settings, respondent group, or CS network. The findings indicate high motivation levels across most VFI/TPB factors in both CS networks, supporting the functional approach theory, that individuals are often driven by multiple factors simultaneously (Clary et al. 1998). However, the skewed average scores of the motivational factors might reflect selection bias, whereby local leaders likely nominated already highly motivated individuals. For example, many ATRAP nominees were (former) Village Health Team members with a pre-existing commitment to public health and community well-being. Therefore, when interpreting motivational factors, it’s essential to account for recruitment strategies, as they may influence motivation (Schumann et al. 2024).
The major motivational factors, Understanding and Values, both from the VFI and open-ended sections, align with previous findings from the Global South (Asingizwe et al. 2020; Walker et al. 2021; Terenzini, Safaya, and Falkenberg 2023). Perhaps the training provided by both CS networks, coupled with the hands-on nature of the tasks, was perceived as an opportunity to advance the citizen scientists’ (scientific) knowledge and skills. Furthermore, normative factors (Social and Subjective norms) played a lesser role, as equally observed in the Global North (Domroese and Johnson 2017; Lee et al. 2018; Duerinckx et al. 2021). However, this observation contrasts with volunteering literature from the Global South, which often highlights social expectations as primary volunteering reasons (Strachan et al. 2015; Mati 2016). This disparity suggests that motivations for CS may differ from traditional community volunteering aimed at common good purposes like digging a community road. This calls for the development of CS-specific motivational measures, as attempted by Wehn and Almomani (2019) and Levontin et al. (2022).
The findings also suggest that the control group generally reported high average scores across most motivational factors, particularly within the ATRAP network. These elevated scores could reflect socially desirable responses, as the CG individuals might have felt the need to present themselves as highly motivated to increase their recruitment chances (Kühne 2018; Mukherjee et al. 2018). This tendency may have been amplified by the instances where four CG individuals in the ATRAP network were recruited as citizen scientists. In contrast, the general decline in motivation observed over time, especially within the GO network, may relate to the nature of tasks. Continuous reporting of natural hazards, often with devastating impacts on individuals or their livelihoods, without providing any support to those affected, likely frustrated both the community members and the citizen scientists, as noted by Sekajugo et al. (2022). The lack of tangible action likely fueled hostility or resistance from the community (see barriers), thus eroding enthusiasm over time (Sekajugo et al. 2022; Kanyiginya et al. 2023). These findings highlight the importance of pairing data collection with visible benefits for communities in the Global South.
While the quantitative data did not reveal clear shifts in motivation, the open-ended responses indicated that motivations can evolve over time. Additionally, the open-ended questions revealed more reasons for participation not captured by the VFI/TPB frameworks, underscoring that question framing can influence responses (Bible and Reza 2023). Nonetheless, the financial support provided (i.e., 17EUR/month) and project flexibility become important factors sustaining the ATRAP and GO citizen scientists, respectively (Jacobs et al. 2019; Brees et al. 2021; Sekajugo et al. 2022). The projects in this study treated financial support and equipment as a necessity tout court to enable participation, despite CS being traditionally associated with unpaid volunteering (i.e., West and Pateman 2016). Therefore, CS practitioners working in resource-constrained regions should anticipate covering participation-related costs to reduce participation barriers (Weeser et al. 2018; Benyei et al. 2023).
Finally, citizen scientists in both networks encountered external (e.g., bad weather) and personal (e.g., sickness) factors as major participation barriers. This contrasts with several studies that have identified time as the main constraint to participation, both in the Global South and the Global North (Domroese and Johnson 2017; Asingizwe et al. 2020; Constant and Hughes 2023). In the case of the GO network, where monitoring natural hazards often required travel to remote and inaccessible locations, citizen scientists encountered additional challenges like disrupted transport services caused by adverse weather conditions, leading to elevated transport costs (Sekajugo et al. 2022; Kanyiginya et al. 2023). The lack of transport, as highlighted by GO citizen scientists, underscores both the infrastructural and financial hurdles common in remote areas in the Global South (Elias et al. 2023). Perhaps involving communities in project planning could offer contextualized solutions to some participation barriers identified in this study (Chiaravalloti et al. 2022; Benyei et al. 2023).
Limitations
Our study had several data-related limitations, including the absence of a true control group, a small sample size, and a male-skewed gender distribution, which constrained detailed statistical comparisons. Additionally, our findings, while informative, may reflect more surface-level expressions of motivation, with deeper psychological or structural dynamics remaining unexplored. Ethnographic or longitudinal studies could help unpack these subtleties. Further limitations are discussed in our related paper (Ashepet et al. 2024).
Conclusion
This study adds to the sparse literature on CS motivations and barriers in the Global South. Despite differences in project goals, Understanding (gaining knowledge) and Values (concern for others) emerged as key motivators, while Social (building new or strengthening relationships) and Protective (addressing negative feelings) factors were comparatively less significant across both CS networks. Interestingly, individuals not yet engaged in CS expressed stronger motivations compared with those actively contributing. Over time, motivational factors evolved with compensation, equipment, and the working conditions, helping to sustain participation. Finally, major participation barriers included personal reasons (sickness) and external conditions (bad weather). These findings indicate that emphasizing learning opportunities and broader community impact are crucial ingredients for recruitment.
Data Accessibility Statement
Data collected for the study are freely available on the open science framework platform (https://osf.io/eg6bp/files/osfstorage/651577841bc8650387f37936).
Supplementary Files
The Supplementary files for this article can be found as follows:
Supplemental File 1:
Appendix 1a – Project-specific phrasing of each item used in the survey. Appendix 1b – Internal consistency reliability computation. DOI: https://doi.org/10.5334/cstp.773.s1
Supplemental File 2:
Supplemental Table 1 – Comparisons of mean scores between motivational factors using the Mann-Whitney U test and BH correction for multiple comparisons. DOI: https://doi.org/10.5334/cstp.773.s2
Supplemental File 3:
Appendix 2 – Additional motivational factors. DOI: https://doi.org/10.5334/cstp.773.s3
Ethics and Consent
The study was approved by two research ethics committees: Mbarara University of Science and Technology (reference number MUST-2021–56) and KU Leuven (reference number G-2019 11 1842). Furthermore, written informed consent was obtained from the respondents before the interviews. Respondents were assured of complete anonymity and that the data would be utilized solely for academic purposes. Lastly, the respondents received compensation for transport costs incurred while coming for the interviews.
Acknowledgements
We would like to thank the ATRAP, D-SIRE and HARISSA teams for their efforts in maintaining the CS networks, together with all the citizen scientists and control group individuals who availed their time to complete the surveys.
Competing Interests
LJ serves on the CSTP editorial board in a voluntary capacity. All other authors declare no competing interests.
Author Contributions
Research idea and study design: AMG, LJ, TH, CM, and LV. Data collection: AMG. Data analysis and interpretation: AMG, LV, and LJ. Manuscript draft: AM, LJ, TH, CM, and LV. Administrative support: LV, TH, CM, GKR, and CUT. Supervision: LV, TH, CM, GKR, and LJ.