
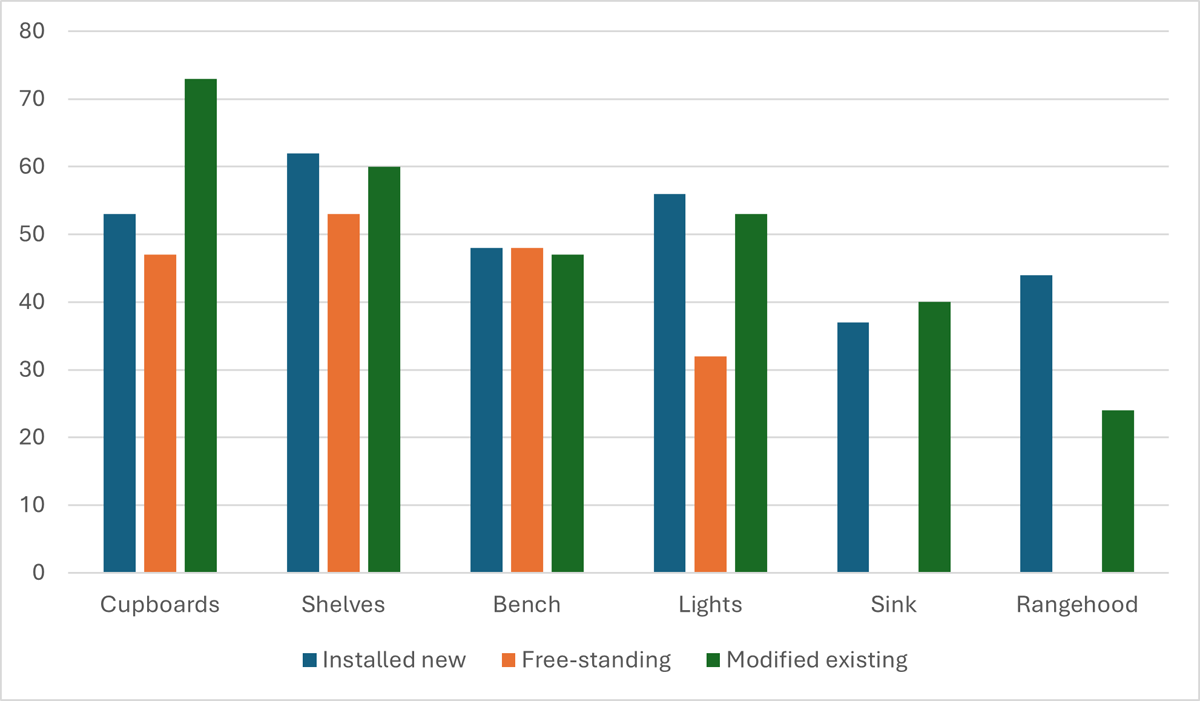
Figure 1
Percentage of residents who undertook retrofitting to specific elements of their apartment kitchen (freestanding refers to items that were removable).
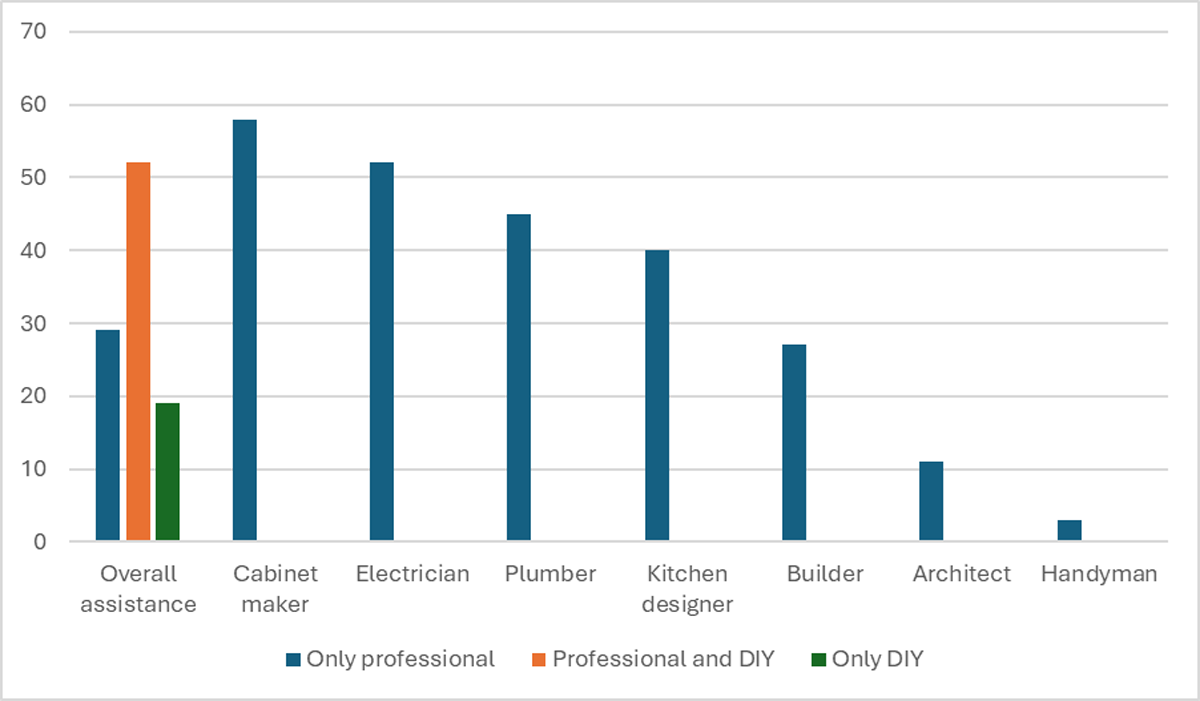
Figure 2
Percentage of residents utilising different forms of assistance in their kitchen retrofit.
Table 1
Participant demographic details
| VARIABLE | DETAILS |
|---|---|
| Gender | Female n = 13 Male n = 7 |
| Age (years) | 20–29 n = 3 30–39 n = 5 40–49 n = 8 50+ n = 4 |
| Country of birth | Australia n = 12 India n = 3 China n = 3 Brazil n = 1 Thailand n = 1 |
| Length of time living in apartment (years) | One to two n = 5 Three to five n = 3 Six to 10 n = 8 More than 10 n = 4 |
| Number of adults living in apartment | One n = 4 Two n = 12 More than two n = 4 |
| Number of children living in apartment | Zero n = 9 One n = 7 Two n = 4 |
| Tenure | Renter n = 2 Owned with mortgage n = 14 Owned outright n = 4 |
| Highest level of education | Certificate or diploma n = 6 University degree n = 14 |
| Occupation* | Professional n = 5 Manager n = 5 Administration n = 4 Community services n = 1 Sales n = 4 Technical and trades n = 1 |
| Household income per week** | $650–999 n = 3 $1000–$1,499 n = 2 $1,500–$2,999 n = 12** $3,000 or more n = 3 |
| Number of days home cooking | Two to four n = 3 Five to seven n = 17 |
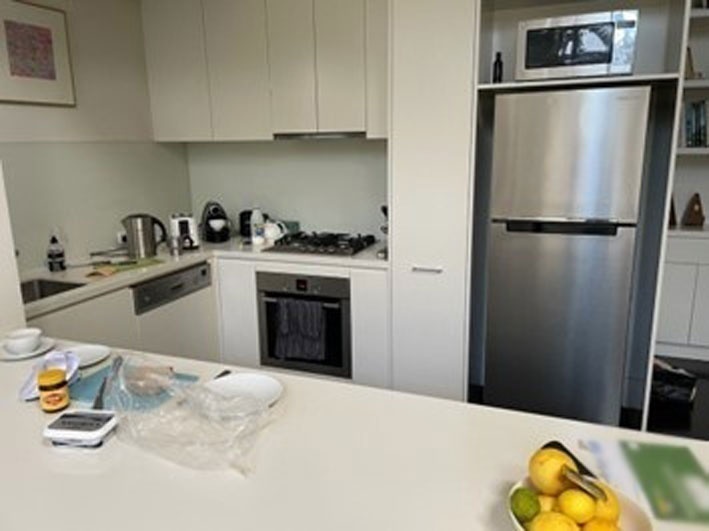
Figure 3
Newly installed pull-out pantry and larger fridge.
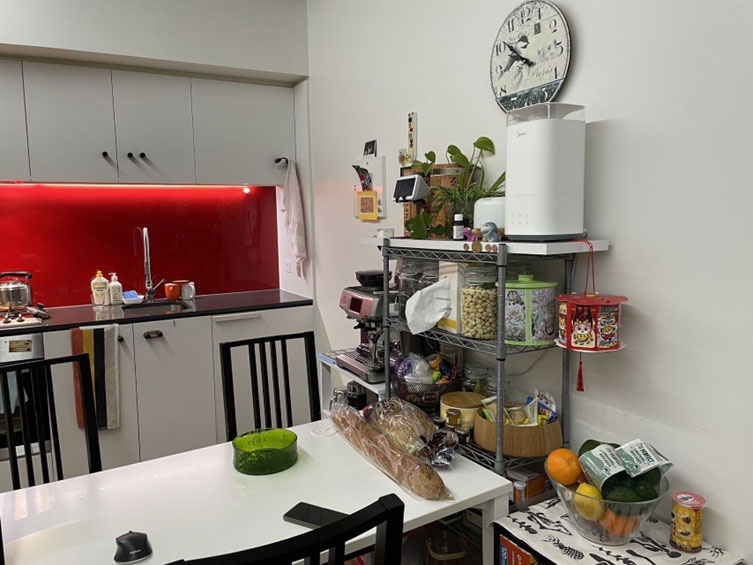
Figure 4
Freestanding shelving for children’s snacks.
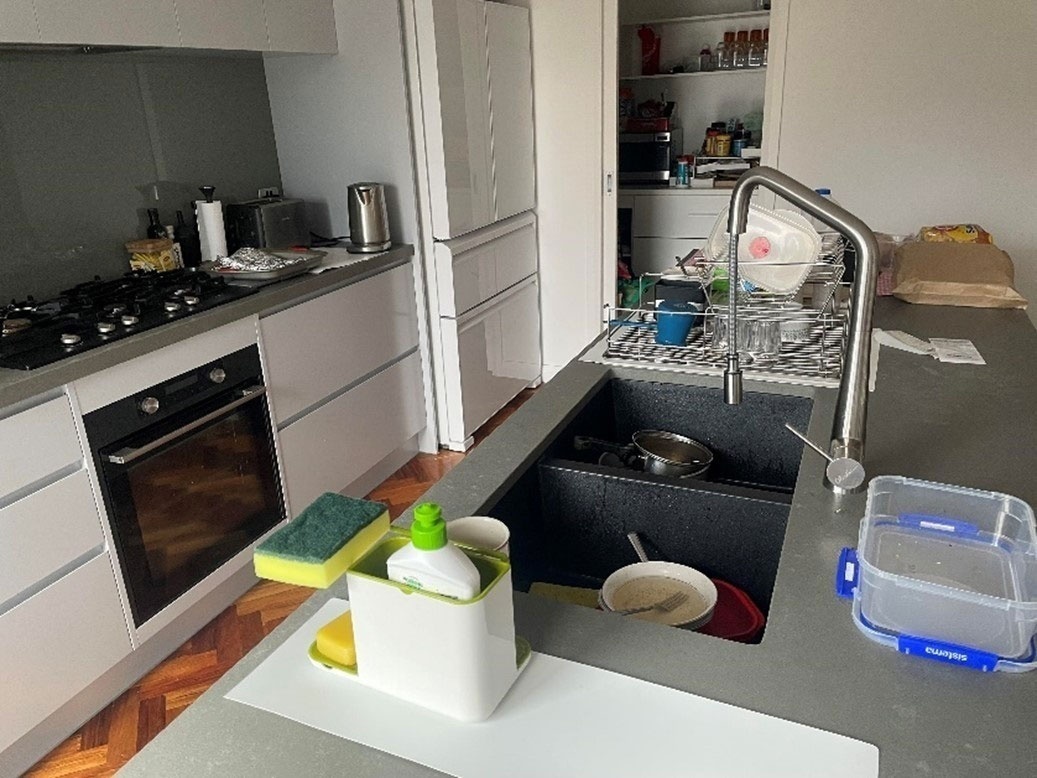
Figure 5
Newly installed double sink with hose attachment.
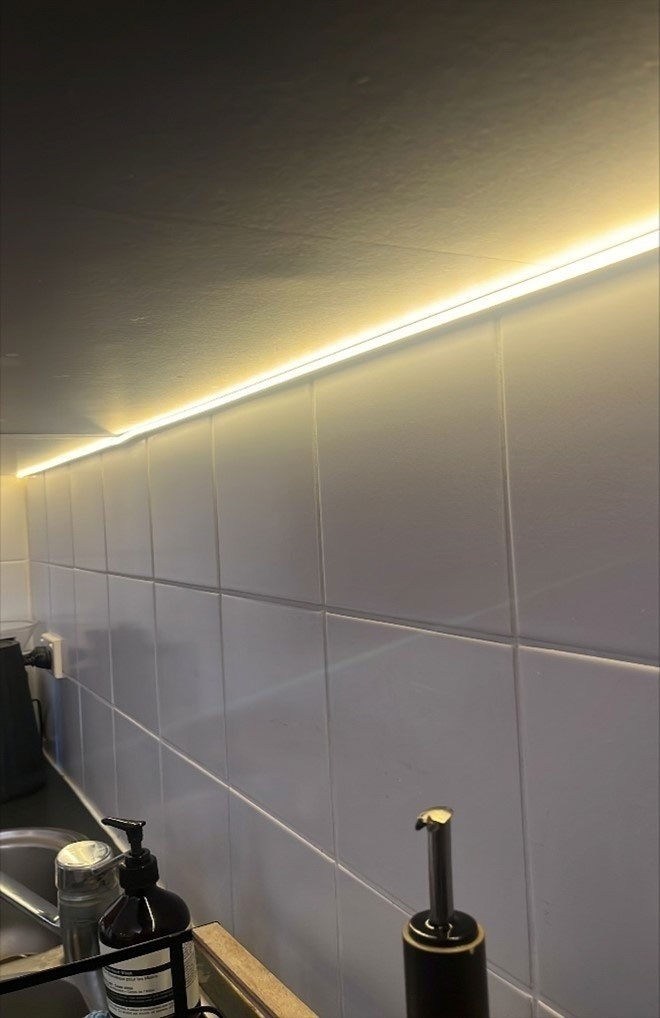
Figure 6
Installation of LED strip to illuminate food preparation area.
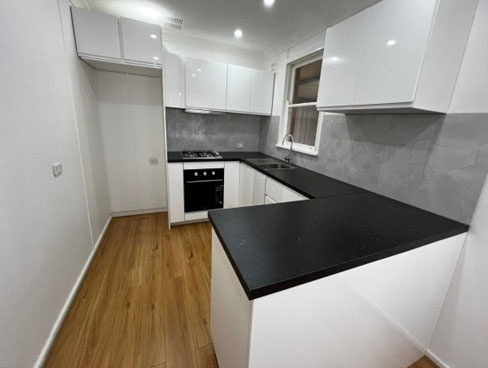
Figure 7
U-shaped design of new kitchen.
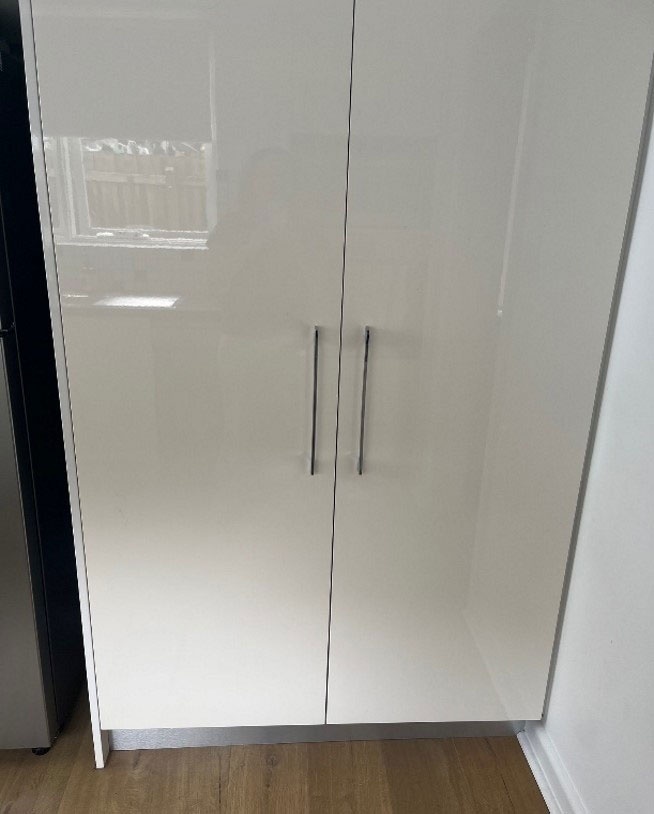
Figure 8
Newly installed attractive cupboards, an incentive to home cooking.
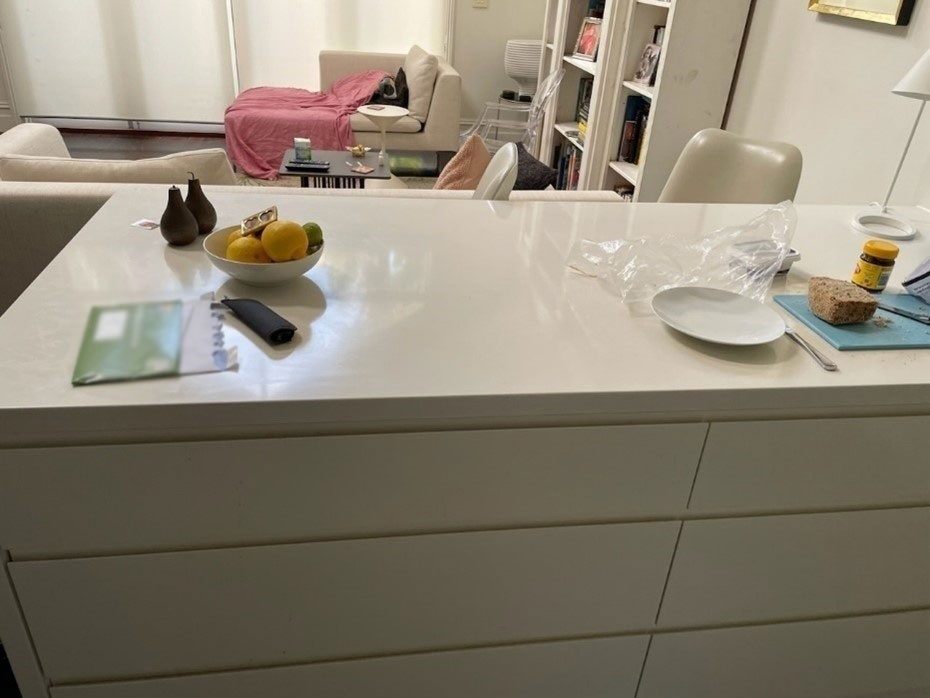
Figure 9
Newly installed island bench encourages interaction.
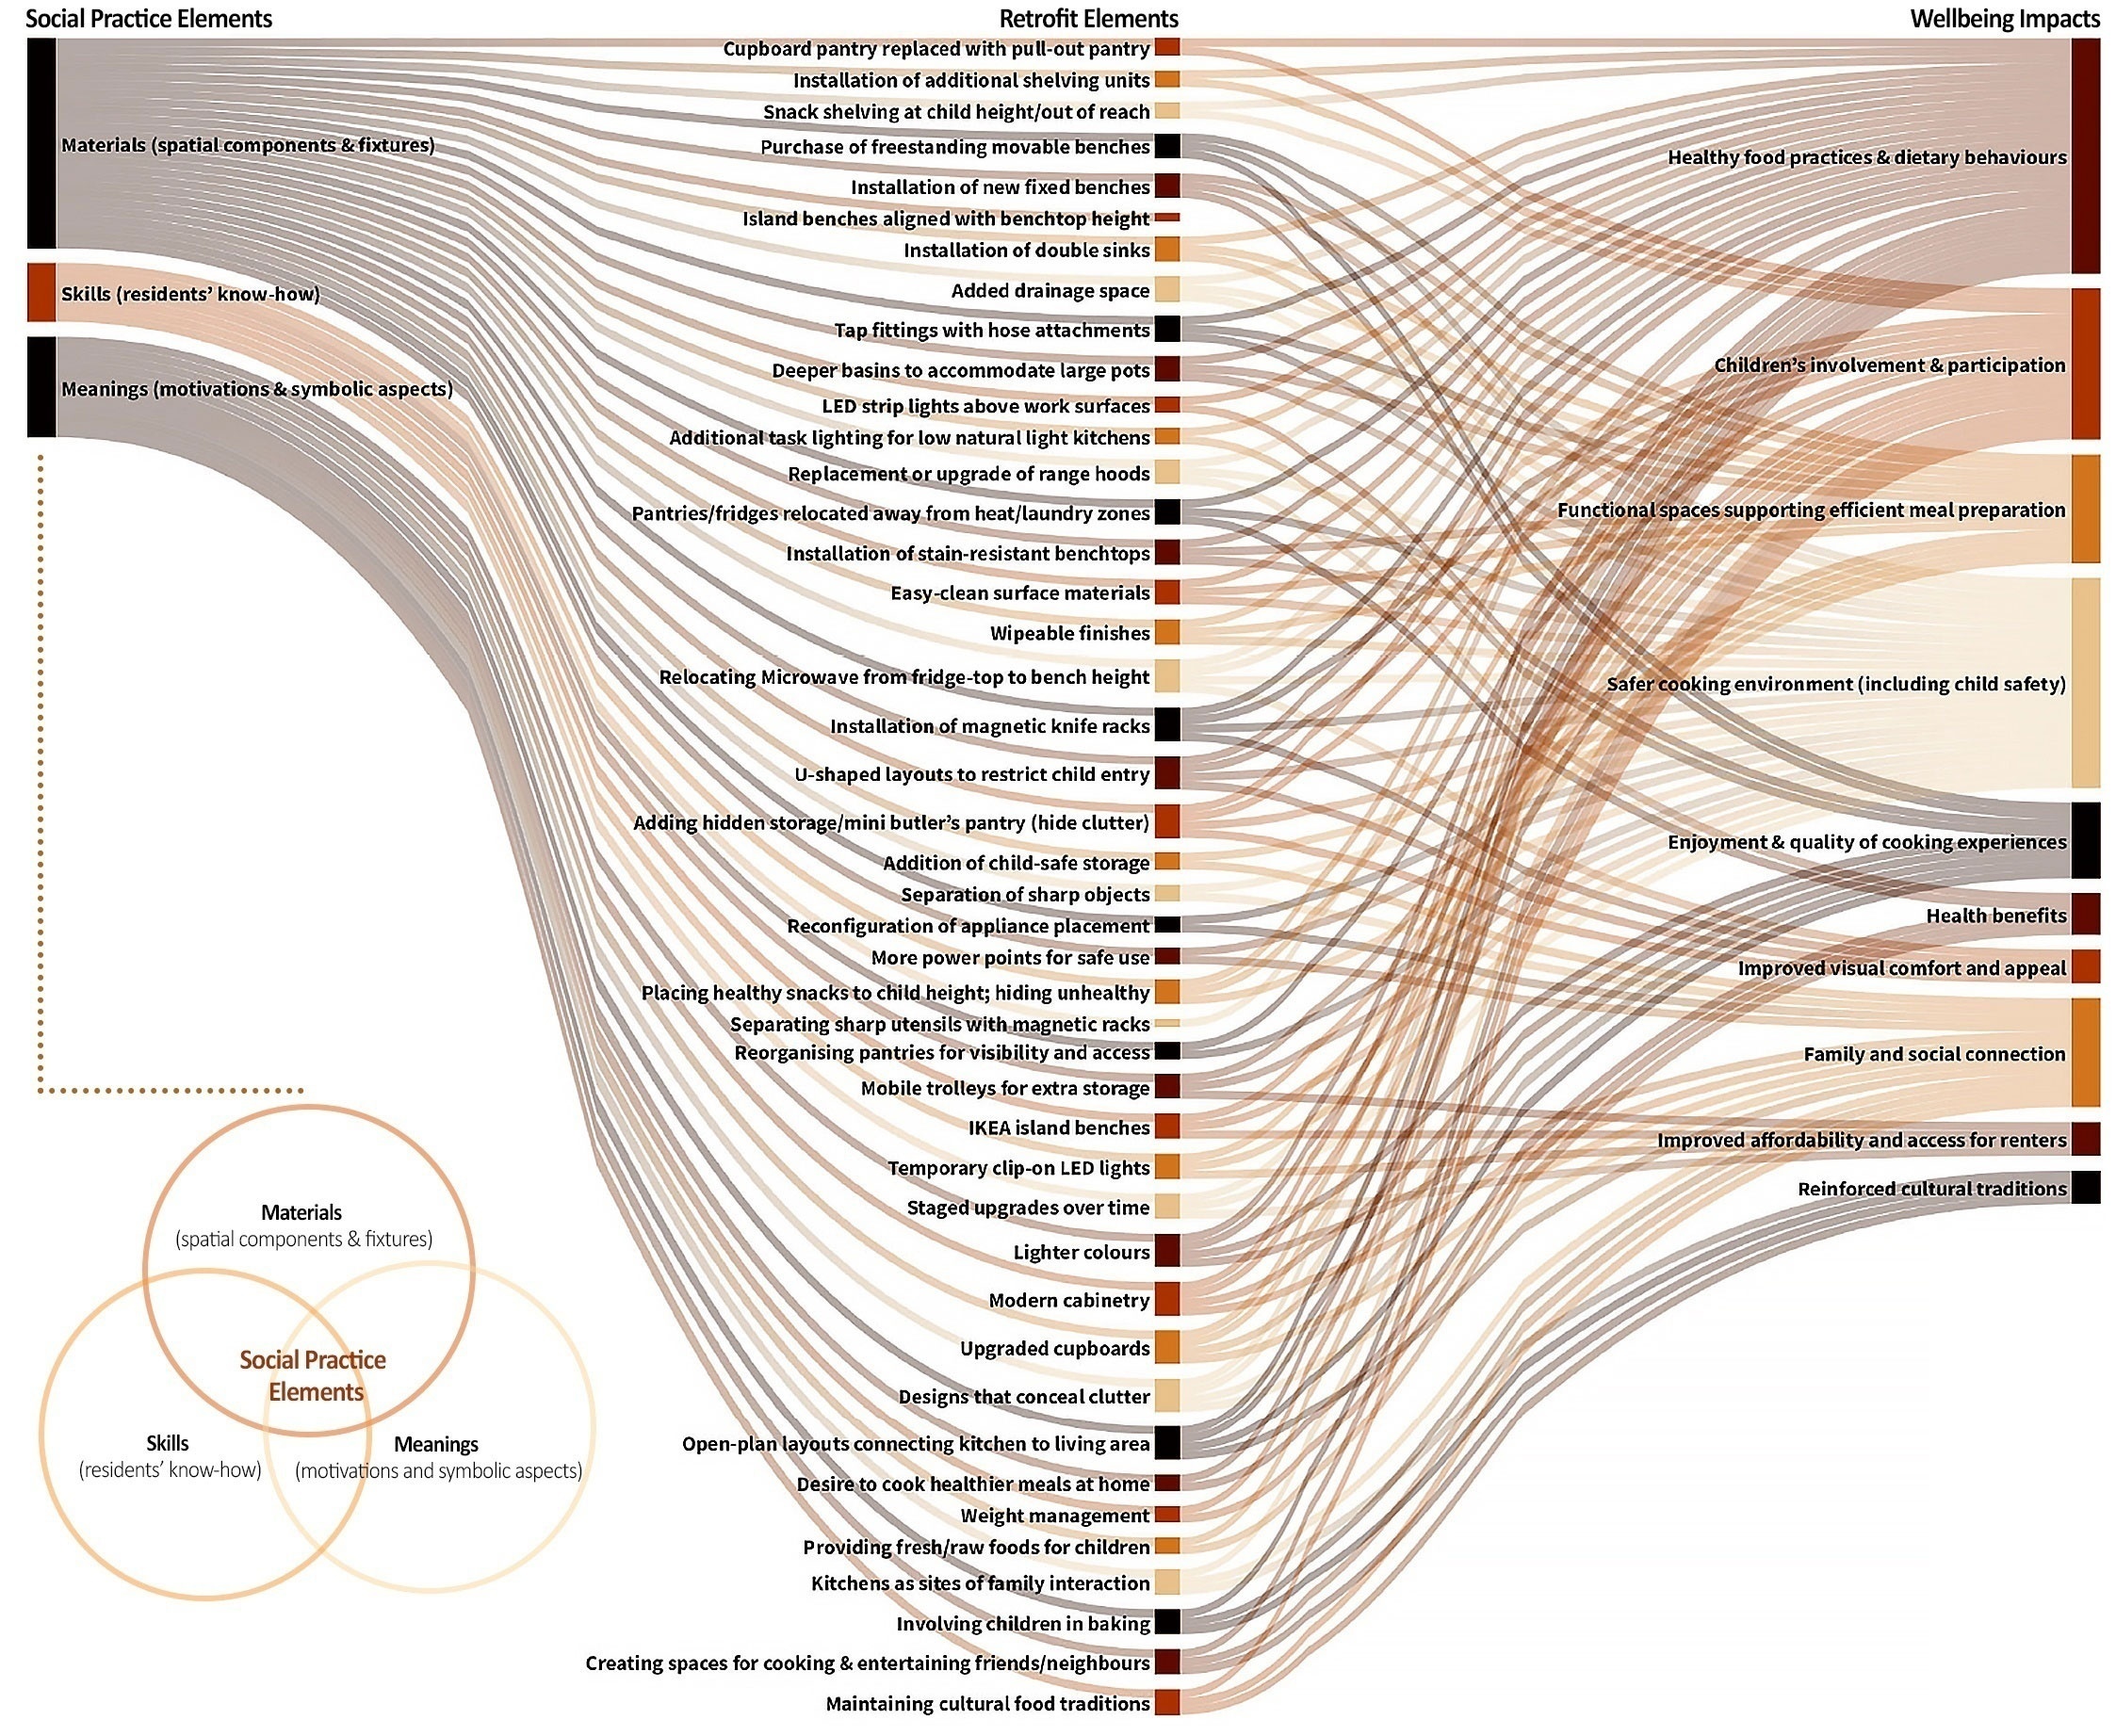
Figure 10
Summary of the relationships between kitchen retrofit elements (derived directly from participants’ interviews) and wellbeing impacts.