
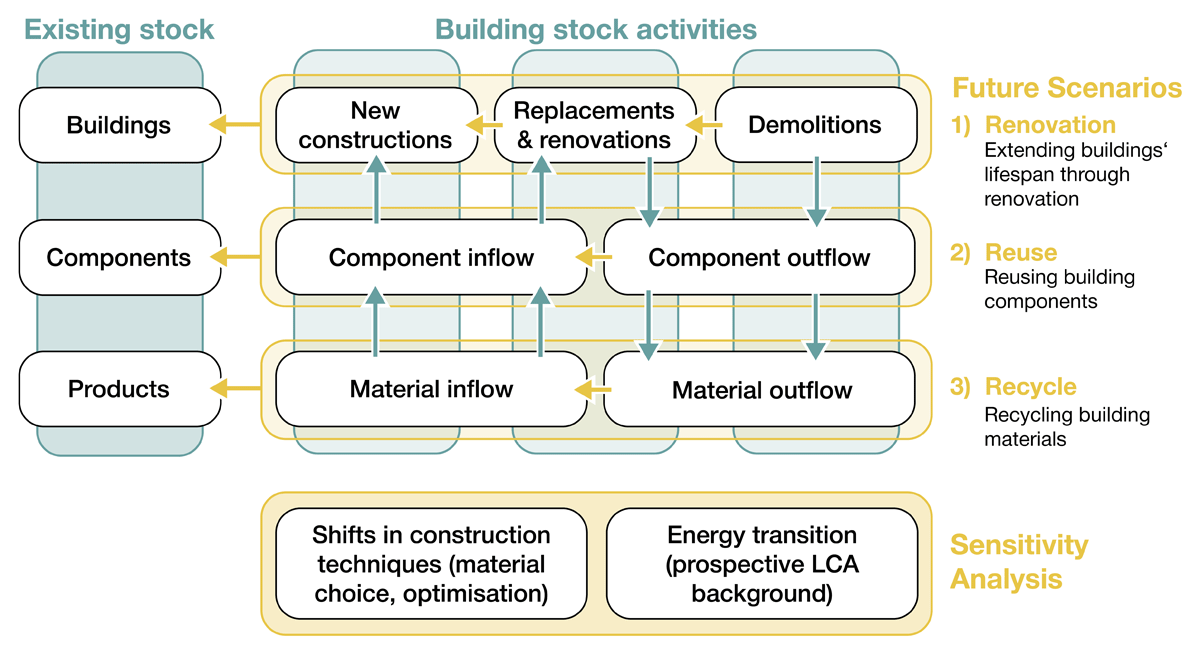
Figure 1
Overview of the methodology used in this study.
Table 1:
Overview of the main scenario parameters and their evolution until 2050
| MAIN PARAMETERS | AFFECTED SCENARIO | 2030 | 2040 | 2050 | SOURCES |
|---|---|---|---|---|---|
| Population | All scenarios | 9,348,281 | 9,632,532 | 9,825,200 | Statistik Austria (2024a) |
| Average living floor area per person | All scenarios | 48.4 | 52.3 | 55.3 | OIB (2020) |
| Share of buildings repurposed | RENOV | 30% | 60% | 90% | Metabolic (2022) |
| Share of empty buildings renovated | RENOV | 15% | 25% | 35% | Knap-Rieger et al. (2022); OECD (2022) |
| Share of materials prepared for reuse | REUSE | 70% | 90% | 100% | Council of the European Union (2008) for 2030, then assumed |
| Reduction in construction waste | REUSE | 30% | 40% | 60% | Karlsson et al. (2021) |
| Share of materials prepared for recycling | RECYCLE | 70% | 90% | 100% | Council of the European Union (2008) for 2030, then assumed |
| Share of clinker in cement | RECYCLE | 57% | 46% | 41% | VÖZ (2022) |
| Share of scrap steel in steel production | RECYCLE | 40% | 67% | 75% | Dworak et al. (2022) |
| Share of new timber buildings | Only for sensitivity analysis (OPTIMISATION) | 28% | 34% | 40% | European Commission et al. (2021); Kalt (2018) and internal calculations |
| Reduction of synthetic insulation | Only for sensitivity analysis (OPTIMISATION) | 20% | 30% | 40% | Assumption based on diffusion for timber buildings |
| Reduction of the amount of concrete and steel | Only for sensitivity analysis (OPTIMISATION) | 10% | 20% | 30% | Hertwich et al. (2019); Karlsson et al. (2021) |
| Share of renewable electricity (in production mix) | Only for sensitivity analysis (PROSPECTIVE) | 94% | 100% | 100% | Kulmer et al. (2024) |
| Share of renewable energy (incl. waste) in district heating | Only for sensitivity analysis (PROSPECTIVE) | 82% | 100% | 100% | Kulmer et al. (2024) |
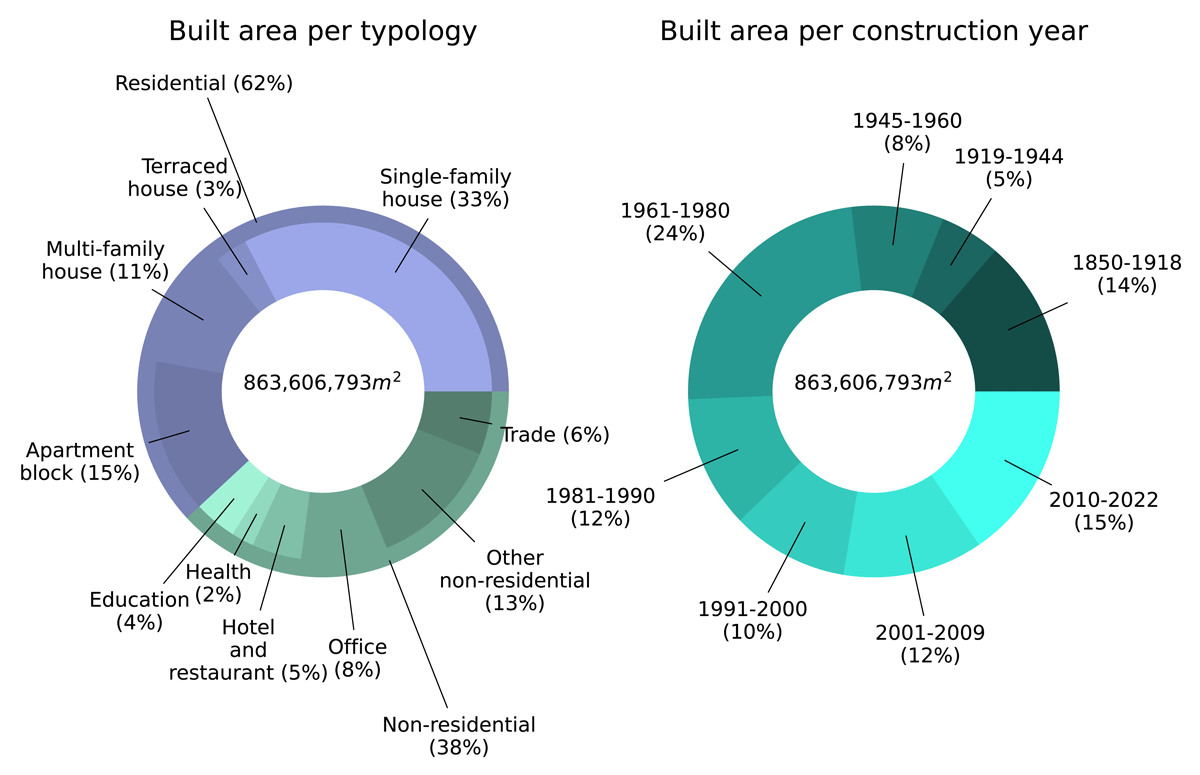
Figure 2
Composition of the building stock in 2023 in net floor area, categorised per building typology and construction period.
Source: Adapted from Alaux (2025).
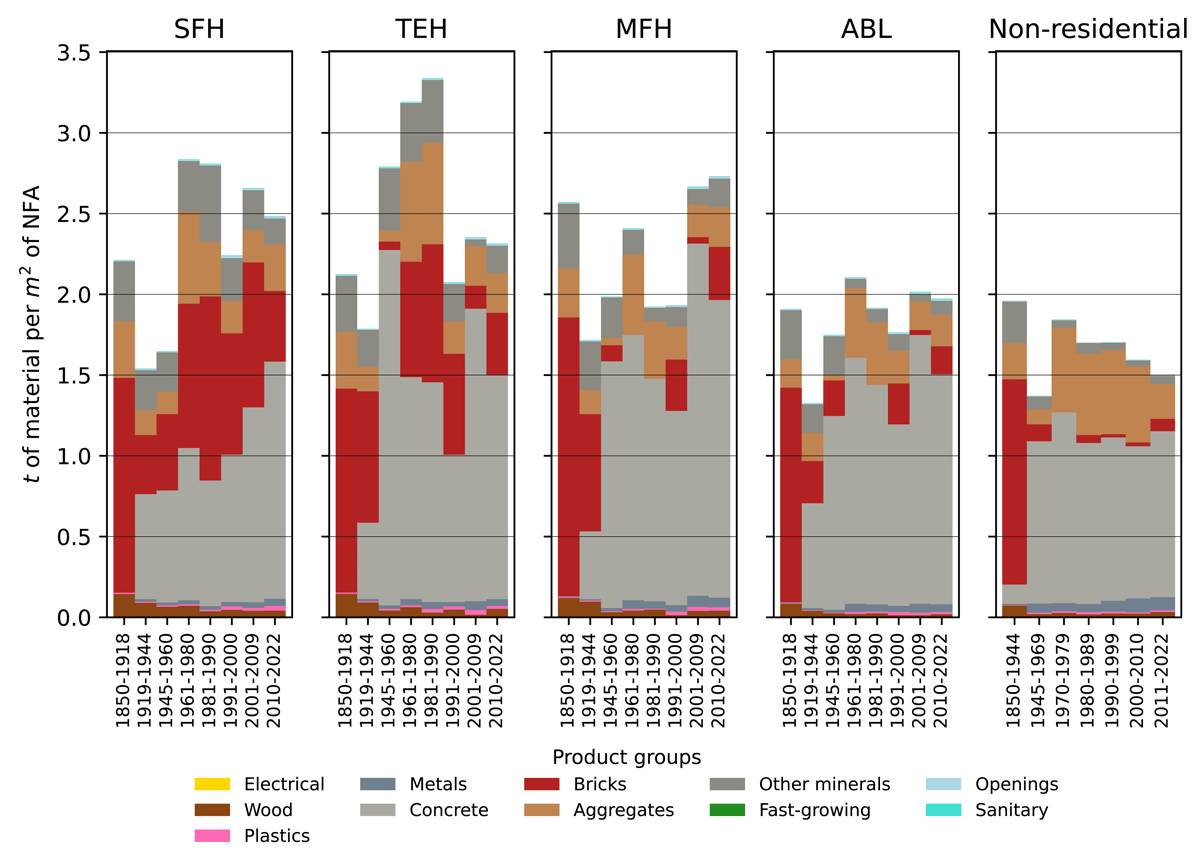
Figure 3
Material composition of the building archetypes, per typology and construction period, averaged per net floor area.
Note: SFH = single-family house; TEH = terraced house; MFH = multifamily house; ABL = apartment building.
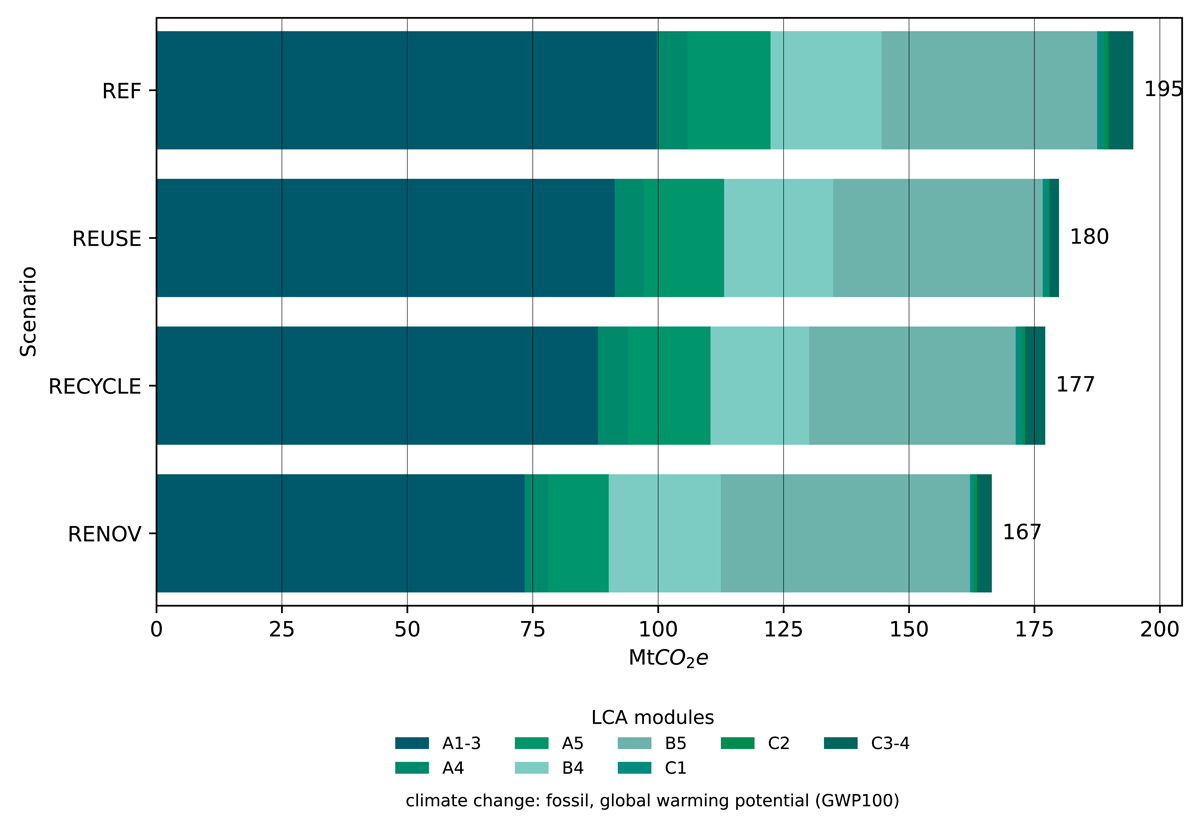
Figure 4
Cumulative embodied GHG emissions of the four future scenarios, 2023–50.
Notes: Emissions are shown for different life cycle stages. Modules A1 to A5 refer to new buildings, B4 to the replacement of materials, B5 to renovations and C1 to C4 to demolitions.
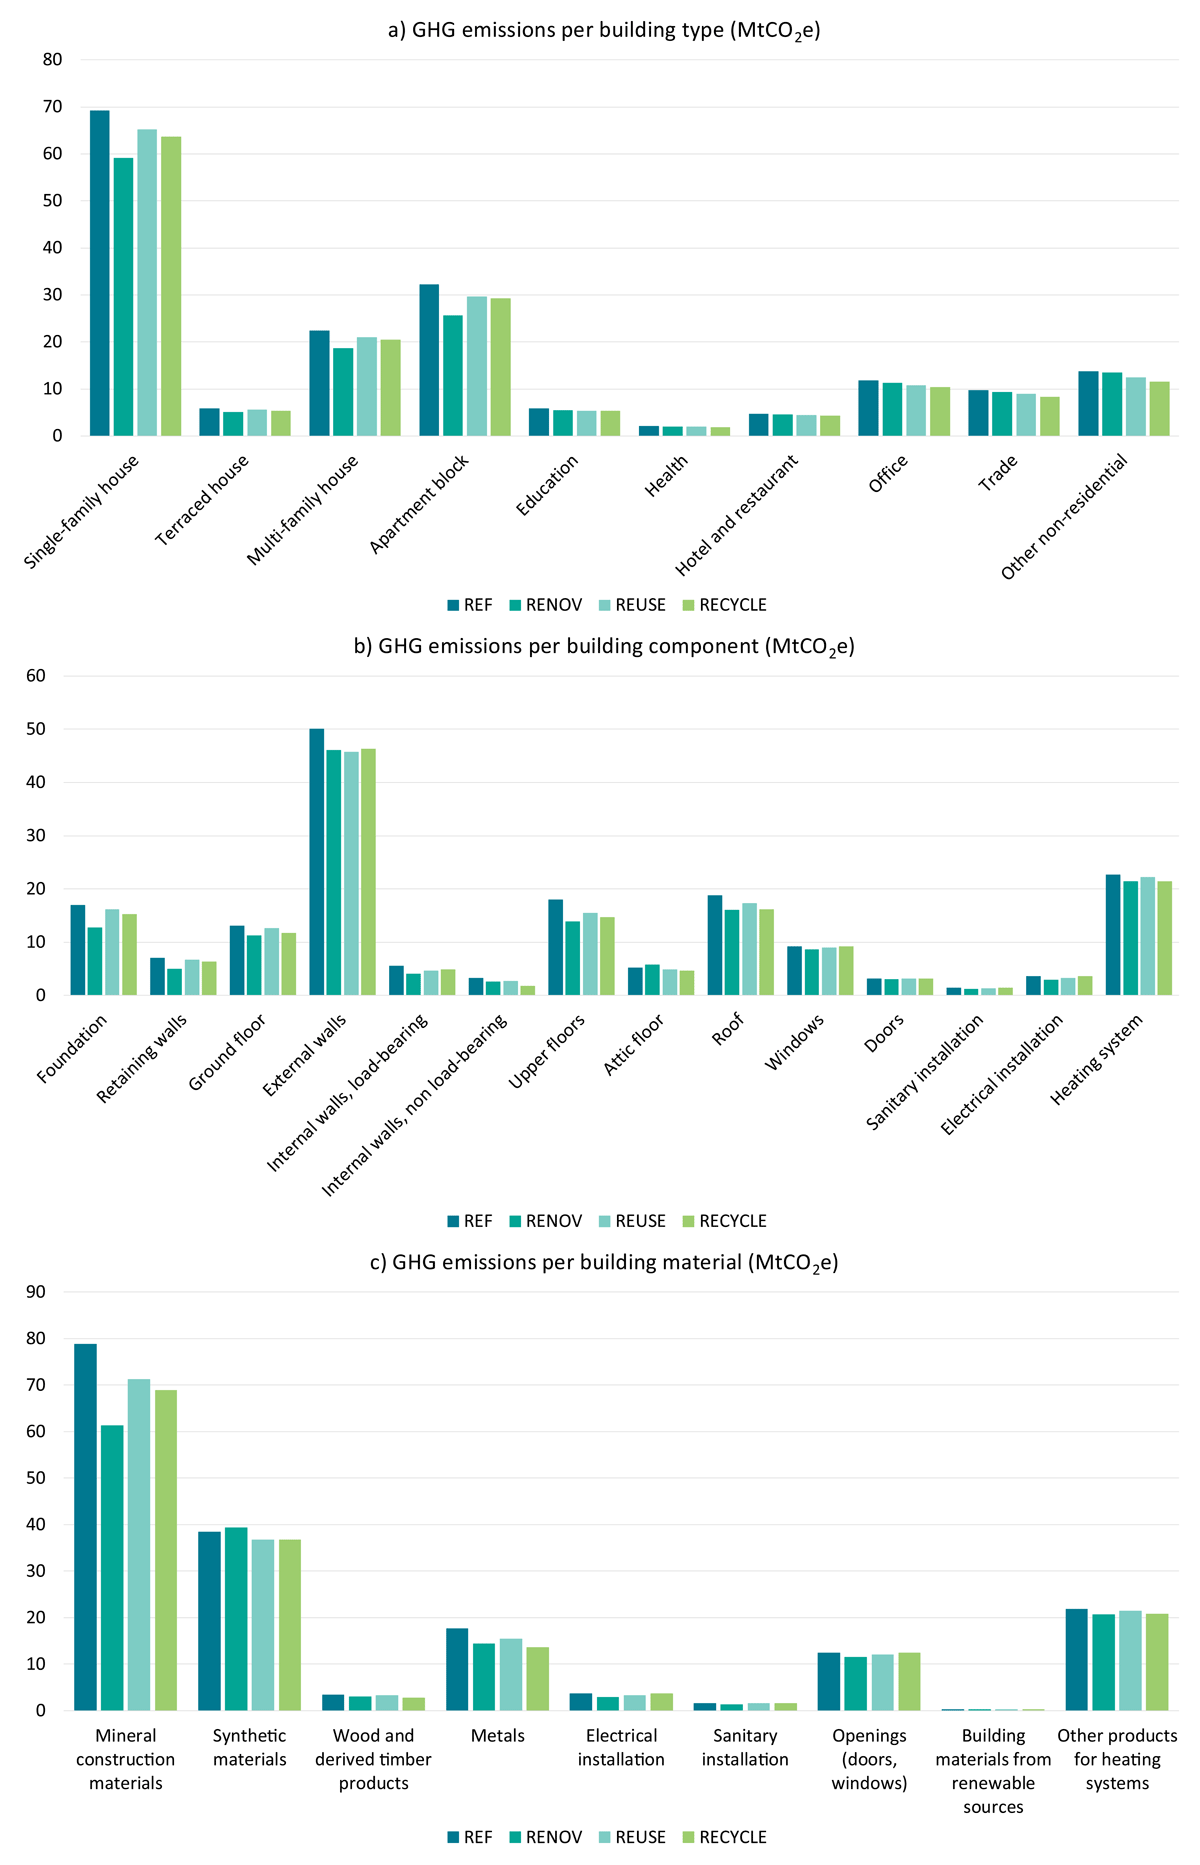
Figure 5
Cumulative embodied GHG emissions of the four future scenarios, 2023–50.
Notes: Scenarios are shown for a) building typology, b) building component and c) building material. Process emissions for construction and demolition are not included in this overview.