
1. Introduction
As Austria strives to achieve climate neutrality before 2050, it is crucial to transform the building and construction industry, which accounts for 36% of waste generation in the EU and 25% of material consumption (Papamichael et al. 2023; Y. Yang et al. 2022). Circular economy strategies can reduce material consumption, waste generation, embodied greenhouse gas (GHG) emissions and potentially energy consumption across the building’s life cycle, including material production, transportation, construction, maintenance and eventual demolition or disposal. For instance, empirical studies have demonstrated that cement recycling and the recycling of wood waste into wood panels can achieve GHG emission and energy savings of 30–40% (Sousa et al. 2023; Taskhiri et al. 2019). Reducing energy consumption is particularly important in the context of the transition to renewable energy sources: studies estimate that complete decarbonisation of all economic sectors could require between 107% and 149% of Austria’s potential renewable electricity production in 2050, depending on the scenario (WKO 2019). If energy demand grows faster than renewable integration, the overall transition to renewables may be jeopardised, which underscores the role of circular economy measures as a robust complementary strategy for facilitating Austria’s broader renewable energy and climate neutrality goals.
Implementing a circular economy in the context of the building sector comprises a wide range of measures. Nußholz et al. (2023) record 133 applications of circular strategies in the European building sector. In general, the strategies to achieve a circular economy of materials can be grouped according to three main principles (Ellen MacArthur Foundation 2019):
share, maintain, prolong
reuse, redistribute
refurbish, remanufacture, recycle.
The potential of these three types of strategies has already been emphasised in previous literature at the building level. For example, studies have shown savings in embodied GHG emissions over the life cycle at the building level of 60–70% when renovating instead of building new (Hosseini et al. 2025; Saade et al. 2020). Based on case studies of Danish buildings, Eberhardt and Birgisdottir (2022) have found that reusing building elements can save on average 49% of GHG emissions from new buildings compared with the use of virgin materials.
However, a Swedish study on precast concrete has found limited GHG emission reductions from reuse when scaled up to the building stock, due to low demolition rates and high new material demand (Al-Najjar et al. 2025). Finally, Hossain and Ng (2019) have shown that applying the principle of resource recovery can lead to a 37% reduction in GHG emissions from buildings. These types of strategies are rarely combined in one consistent case study and at a larger scale, for example at the national level, which represents a research gap addressed in this study.
When analysing circular economy strategies on a broader scale, the analysis of material stocks and their evolution through material flow analysis (MFA) is particularly useful, especially when coupled with geographical information systems (Wuyts et al. 2022). This combination enables a spatially explicit understanding of the way resources are consumed, transformed and disposed of in different locations and provides insights into material flows in cities, regions or countries. Examples can be found in Augiseau and Kim (2021) for Paris, in Kolkwitz (2025) for Vantaa and in Liang et al. (2023) for three urban agglomerations of China. However, most of these studies only aim to quantify material stocks and flows without necessarily assessing their circular economy potential. A link to life cycle assessment (LCA) to calculate the associated environmental impacts is also rare. One study that combines a geo-referenced MFA model with LCA to assess the potential of urban mining in the Dutch residential building sector is that of Yang et al. (2022), who conclude that the potential to reduce GHG emissions through urban mining is rather low. More recently, Hoxha and Birgisdottir (2025), employing a spatiotemporal building stock model for Denmark, demonstrate a higher potential for material reuse. A common aspect of these studies is that they all use aggregated material intensity factors (e.g. mass of concrete per m2 of building) to estimate material stocks and flows, which prevents an assessment of strategies such as reuse, which is more relevant at the component level (e.g. a concrete wall).
Rather than providing materials flows with geographical information, another way to increase the spatial resolution of the models is to track these flows through different levels, such as buildings, building elements and building materials, as proposed by Heeren et al. (2013), and for the results to be tracked across these different levels (Röck et al. 2024). Arora et al. (2019) argue that material stock analyses for individual materials or material categories, e.g. minerals or metals, need to be complemented by estimates of building element inventories to increase the potential for secondary resource recovery, and this is also confirmed by the literature review conducted by Wuyts et al. (2022). To address this, Ajayebi et al. (2020) created a framework for spatiotemporal mapping of building structural products that integrates external geometries and construction history and applied it at city level in the UK for brick walls only. Although machine learning methods can support this approach for specific components (Dai et al. 2025; Schmid et al. 2025), the limited data available raise doubts about its ability to scale to every building component across an entire country. To be able to analyse stock assets through integrated LCA and MFA on a larger scale, Slavkovic et al. (2022) propose using a nested archetyping approach, where each building archetype would also be divided into building components and materials. Even though the number of studies is increasing, there is still a need for research to provide high-quality information on a large scale (Stephan 2022). In particular, the existing literature lacks combined LCA–MFA approaches, with a high level of detail regarding buildings, building components and materials, which can also project future changes, such as changes in the energy mix.
The goal of this study is to assess the potential of three circular economy measures to reduce the life cycle embodied GHG emissions of the Austrian building stock, from 2023 to 2050:
extending the lifespan of existing buildings by renovation
reusing building components
recycling materials.
The novelty relies on the inclusion, in a study at the national scale, of circular economy strategies that target buildings, components and materials in an integrated MFA–LCA approach, while considering the effect of future changes such as the transition of the energy sector to achieve the climate targets of the Paris Agreement or different construction techniques, including an increased use of bio-based materials.
This paper is structured as follows. Section 2 explains the methods behind the building stock and scenario modelling. Section 3 provides quantitative, practical insights to policymakers on the contribution of circular economy measures to Austria’s climate neutrality goal. Section 4 discusses the limitations of the study, uncertainties behind the results and political relevance.
2. Methods
This study uses the open-source PULSE-AT model (version 3.0) developed for the building stock in Austria (Alaux, Schwark et al. 2024). The model projects the number of new buildings, replacements, renovations and demolitions from 2023 to 2050, as briefly described in Section 2.1. Each building is represented by an archetype (e.g. single-family houses built between 1919 and 1944) to which information about its building components (e.g. external walls) and materials (e.g. concrete) were assigned, as described in Section 2.2. The model allows material and energy flows to be analysed on an annual level across buildings and components. An LCA database is then used to calculate the environmental impacts associated with these flows, with the predicted environmental impacts considering future changes, as explained in Section 2.3. A range of circular economy scenarios were applied to the model to estimate the potential of circular economy measures to reduce GHG emissions, as outlined in Section 2.4. Figure 1 shows the methodology followed in this work.
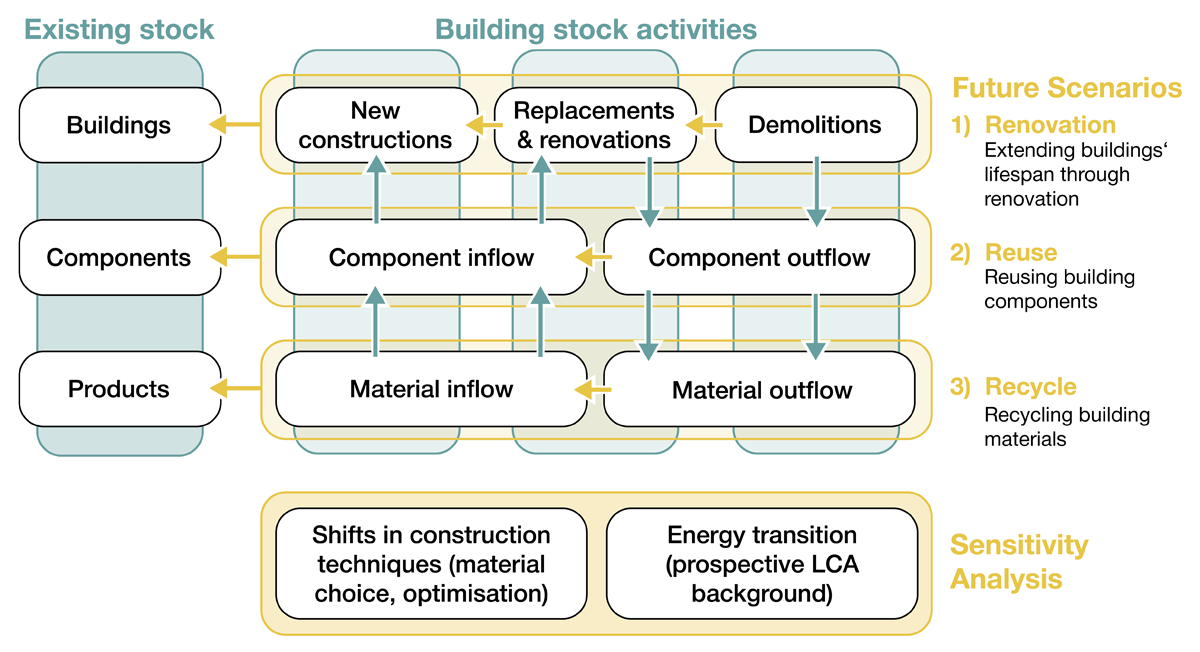
Figure 1
Overview of the methodology used in this study.
2.1 Development of the building stock (2023–50)
The development of the building stock is the same as in Alaux, Schwark et al. (2024). A description of the most important parameters is provided in this section but further details on the parameters and equations that enable the development of the building stock can be found in the previous publication.
New residential buildings are first calculated by multiplying the total population of the country in a given year (Statistik Austria 2024a) by the average per capita heated floor area of occupied residential buildings (OIB 2020), as commonly performed in building stock modelling studies (Ma et al. 2025), aligning with the finding that built-up areas are expanding faster than population (Schiavina et al. 2022). This represents the demand for housing. The current housing capacity, which is derived from the existing residential building stock in this year, is then subtracted from this demand, resulting in a number of buildings that need to be built. The current housing capacity is not static and can also be influenced by scenario parameters. For example, if fewer buildings are demolished or additional vacant buildings are put to use, this increases the housing capacity of the existing building stock, thus reducing the need for new residential buildings. The number of new residential buildings is then, unless otherwise stated in the scenarios, distributed across the four housing typologies (single-family house, terraced house, multifamily house and apartment block) in the same proportion as the latest construction period (2010–22). Relying on these past trends is reasonable because the share of each residential building typology is expected to vary by less than 5% through 2050 (OIB 2020).
The demand for non-residential buildings is more difficult to predict, as it is less researched, with most building stock models focusing on residential buildings (Slavkovic & Stephan 2025). A previous study in Germany shows that drivers for the construction of office buildings, industrial buildings and warehouses are actually a combination of demographic, economic and wealth-related influences (Kretzschmar & Schiller 2023). As a simplification, the total population of the country is used here as a coarse indicator for non-residential buildings. First, the average per capita occupied heated floor area is calculated for each typology in the latest construction period (2010–22). Then this is multiplied by the total population of the country in a given year. To account for the additional drivers, this number is multiplied by a factor that has been calibrated based on the construction rates from the past 10 years. While this represents a modelling limitation that could be improved in future developments of the model, it provides reasonable estimations for the number of new non-residential buildings based on past trends.
Renovation is calculated using renovation rates that vary depending on the scenario and the underlying assumptions. In addition, each year a number of materials are replaced when they reach the end of their reference service life. Following previous work (Heeren & Hellweg 2019), the number of demolitions is based on a Weibull function used to calculate the percentage of a typology that is demolished based on use and age. As the building stock model is static, the probability is interpreted as the proportion of buildings that are demolished.
2.2 Modelling of building components and materials
The detailed list of components and materials as well as the complete list of references can be found in the previous publication (Alaux, Schwark et al. 2024) and online updates (see the data availability statement). For each building typology, such as a single-family house or an office, and for different construction periods, such as 1919–44 or 1981–90, the authors created specific building components and materials based on a review of construction books (Giebeler et al. 2008; Hegger et al. 2005; IBO 2018; Scholz et al. 2016). The component categories included are foundations, retaining walls, ground floors, external walls, internal walls (load-bearing and non-load-bearing), upper floors (including attics), roofs, windows, doors, heating systems, sanitary installations and electrical installations. This means that the model can simulate the reuse of materials in each of these component categories, such as concrete and steel in external walls. The proportion of materials in each building component that is assumed to be potentially reused is generally specified in the scenarios (see Table 1) and provided on an annual basis (see the supplemental data online).
Table 1:
Overview of the main scenario parameters and their evolution until 2050
| MAIN PARAMETERS | AFFECTED SCENARIO | 2030 | 2040 | 2050 | SOURCES |
|---|---|---|---|---|---|
| Population | All scenarios | 9,348,281 | 9,632,532 | 9,825,200 | Statistik Austria (2024a) |
| Average living floor area per person | All scenarios | 48.4 | 52.3 | 55.3 | OIB (2020) |
| Share of buildings repurposed | RENOV | 30% | 60% | 90% | Metabolic (2022) |
| Share of empty buildings renovated | RENOV | 15% | 25% | 35% | Knap-Rieger et al. (2022); OECD (2022) |
| Share of materials prepared for reuse | REUSE | 70% | 90% | 100% | Council of the European Union (2008) for 2030, then assumed |
| Reduction in construction waste | REUSE | 30% | 40% | 60% | Karlsson et al. (2021) |
| Share of materials prepared for recycling | RECYCLE | 70% | 90% | 100% | Council of the European Union (2008) for 2030, then assumed |
| Share of clinker in cement | RECYCLE | 57% | 46% | 41% | VÖZ (2022) |
| Share of scrap steel in steel production | RECYCLE | 40% | 67% | 75% | Dworak et al. (2022) |
| Share of new timber buildings | Only for sensitivity analysis (OPTIMISATION) | 28% | 34% | 40% | European Commission et al. (2021); Kalt (2018) and internal calculations |
| Reduction of synthetic insulation | Only for sensitivity analysis (OPTIMISATION) | 20% | 30% | 40% | Assumption based on diffusion for timber buildings |
| Reduction of the amount of concrete and steel | Only for sensitivity analysis (OPTIMISATION) | 10% | 20% | 30% | Hertwich et al. (2019); Karlsson et al. (2021) |
| Share of renewable electricity (in production mix) | Only for sensitivity analysis (PROSPECTIVE) | 94% | 100% | 100% | Kulmer et al. (2024) |
| Share of renewable energy (incl. waste) in district heating | Only for sensitivity analysis (PROSPECTIVE) | 82% | 100% | 100% | Kulmer et al. (2024) |
2.3 Life cycle assessment
An attributional, process-based LCA was undertaken based on the prEN 15978 standard (CEN 2024). In terms of scope, this includes the life cycle GHG emissions of new buildings (modules A1–A5), replacement of materials (module B4), renovations (module B5) and demolitions (modules C1–C4) from 2023 to 2050. Module D (benefits and loads beyond the system boundary) was not included, because benefits from reuse or recycling are within the scope of the study and are thus considered in A1–A5. As they have already been extensively studied in the literature (Hoxha & Jusselme 2017; Monteiro et al. 2016; Shoubi et al. 2015), operational GHG emissions were excluded in this analysis. Instead, the focus is on material stocks and flows, highlighting the growing importance of embodied GHG emissions (Röck et al. 2020). The LCA calculation is carried out using the Brightway2 framework (Mutel 2017), which allows for performing LCA calculations with Python, the ecoinvent v3.9.1 cut-off as a background database (Wernet et al. 2016) and the global warming potential (fossil) of the environmental footprint method EF 3.1 EN15804 (European Commission 2022). As circularity goes beyond GHG emissions, the results for all 19 environmental impact indicators of this method are presented in the supplemental data online.
To consistently modify energy generation and supply in all foreground and background processes according to scenarios from the integrated assessment model REMIND (Regional Model of Investment and Development) (Baumstark et al. 2021), which is especially relevant for the sensitivity analysis (more details in Section 2.4), the premise Python package v2.2.4 (Sacchi et al. 2022) is used. Although operational GHG emissions are not included in the scope of the analysis, the transition towards renewable energy is still relevant as it influences, for example, the production of construction materials, which requires energy.
2.4 Future circular economy scenarios
Four explorative scenarios are investigated. Table 1 presents the main parameters used to explore the potential of circular economy measures for the Austrian building stock:
REF: A theoretical, reference scenario which follows past trends, in which no specific GHG emission reduction measures are applied. The SSP2-None background scenario from REMIND is chosen for the LCA, which extrapolates from historical developments without climate policy. The REF scenario serves as the starting point for the other three, which then additionally apply different circular economy strategies.
RENOV: This scenario models the preservation of the existing building stock by extending the lifespan of buildings that would otherwise be demolished or remain vacant. This is achieved through the renovation of a specified proportion of buildings slated for demolition and currently unoccupied buildings. Consequently, these reconditioned buildings become fit for occupancy, thereby reducing the necessity for new construction. It is assumed that these buildings are renovated with the deep thermal renovation measures defined in the TABULA project (Loga et al. 2016), which have been materialised to account for the embodied emissions from renovation.
REUSE: This scenario simulates the reuse of building components in existing buildings. Each year, at the country level, a specified proportion of components from demolition are compared with the components required for new construction. If there is a match between components and materials, for example if a concrete wall is needed and a concrete wall is demolished, then it can be assumed that it will be reused in order to assess the maximum theoretical potential of reuse. The assumptions regarding the share of waste materials prepared for reuse are provided in Table 1. This is based on the mass of the materials and assumed to take place directly on site, without any additional transport. In addition, we assume a reduction in the construction waste generated.
RECYCLE: This scenario, developed within the INTEGRATE project (Kulmer et al. 2024; Steininger 2022), models extensive material recycling, driven by circular economy principles and policy incentives. It assumes recycling of construction and demolition waste, including wood into glulam and panels (Llana et al. 2022; Risse et al. 2019; Taskhiri et al. 2019), gypsum into plaster (Pedreño-Rojas et al. 2019; Pedreño-Rojas et al. 2020), recycling of polystyrene insulation (Swisspor 2023) and continued high recycling of mineral insulation (BMK 2023). Additionally, it incorporates recycled materials from other sectors, projecting a reduction in cement clinker to 41% (from 70% in 2020) via industrial by-products (VÖZ 2022) and an increase to 75% steel scrap in steel production (from about 9% in 2020) (Dworak et al. 2022). In the model, this is simulated in a similar way to reuse by comparing inflows and outflows of materials. The difference is that each recycling process is modelled in the LCA, taking into account transport and recycling emissions.
Two sequential sensitivity analyses were performed for each of the four scenarios, resulting in a total of 12 scenarios. The first analysis (PROSPECTIVE) investigates the impact of the energy transition by replacing the SSP2-None background scenario with the prospective SSP2-PkBudg500 from REMIND, which aligns with Paris Agreement temperature targets (1.2–1.4°C) through rapid renewable energy deployment. This is further coupled with the Austrian electricity and district heating mix from the INTEGRATE project’s INT scenario (Kulmer et al. 2024). The second analysis (OPTIMISATION) explores the influence of future construction methods, assuming an increased adoption of wooden buildings, a reduction in plastic-based insulation replaced by bio-based or mineral alternatives, and optimised construction that minimises concrete and steel usage (Karlsson et al. 2021). All quantitative parameter values used for the scenarios are summarised in Table 1 and provided with more details in the supplemental data online.
3. Results
3.1 Building stock composition
In 2023, the total net floor area of the Austrian building stock was approximately 860 million m2 of net floor area (Figure 2).1 This stock is primarily composed of residential buildings, which constitute 62% of the total area, while non-residential buildings make up the remaining 38%. Within the residential category, single-family houses and terraced houses collectively account for 36% of the total stock area, followed by apartment blocks, which represent 15%. The age distribution of the building stock shows that 19% was constructed before 1945, 44% was built between 1945 and 1990, and 37% was constructed after 1990. These data were originally sourced from Austrian statistics (Statistik Austria 2024b) and then adapted to the archetypes employed in PULSE-AT.
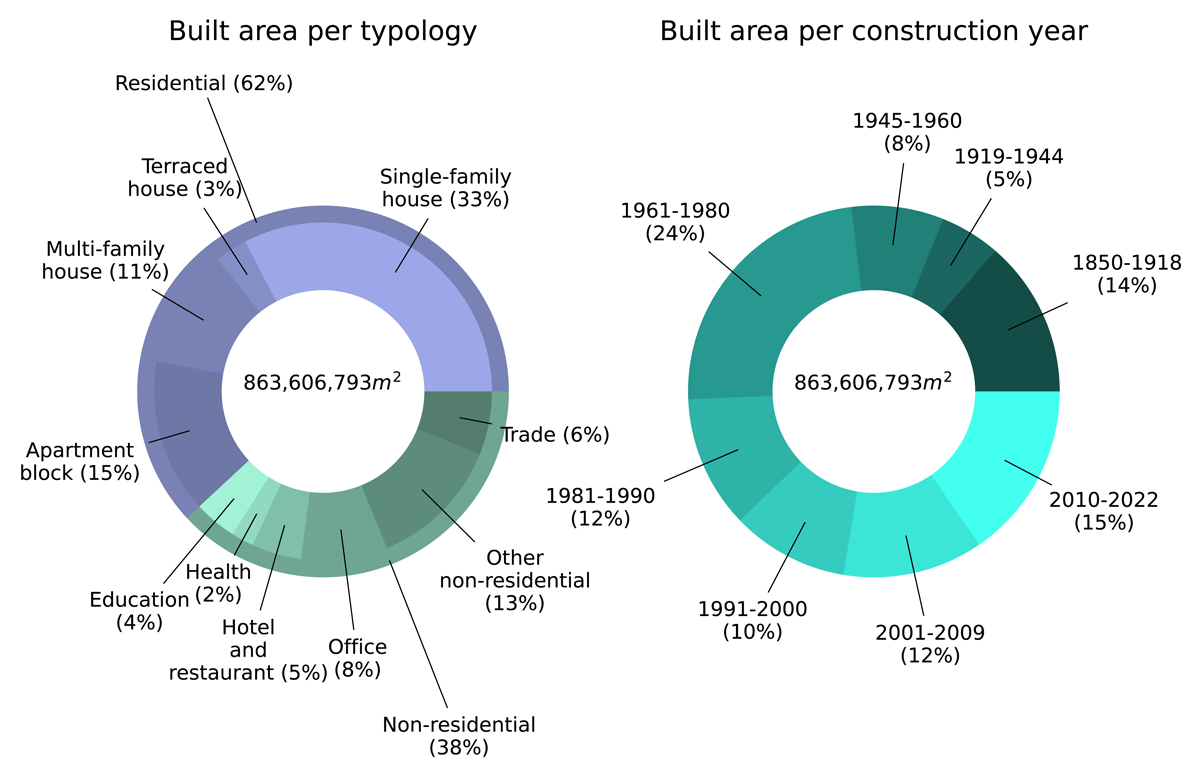
Figure 2
Composition of the building stock in 2023 in net floor area, categorised per building typology and construction period.
Source: Adapted from Alaux (2025).
In terms of material stock (Figure 3), the total estimated mass of materials in the building stock was 1.7 gigatonnes in 2023, based on the materialisation of the archetypes explained in Section 2.2, with the most common materials being minerals (94%), including concrete and cement (51%), followed by bricks (24%). However, there is a highly heterogeneous material stock characterised by a significant historical transition in construction practices. The older, pre-1960s building stock is predominantly composed of bricks and wood, with minimal concrete or metals. Conversely, the post-war and particularly the modern stock (post-1990) shows a clear shift towards a higher intensity of concrete and metals, which have become the dominant structural materials, especially in larger multifamily houses, apartment blocks and non-residential buildings. This transition is accompanied by a consistent increase in the intensity of plastics and mineral insulation across all archetypes in recent decades, reflecting the increased energy efficiency standards. This composition has significant implications for circular economy strategies, as the materials available for recovery from older buildings are fundamentally different from those in modern structures.
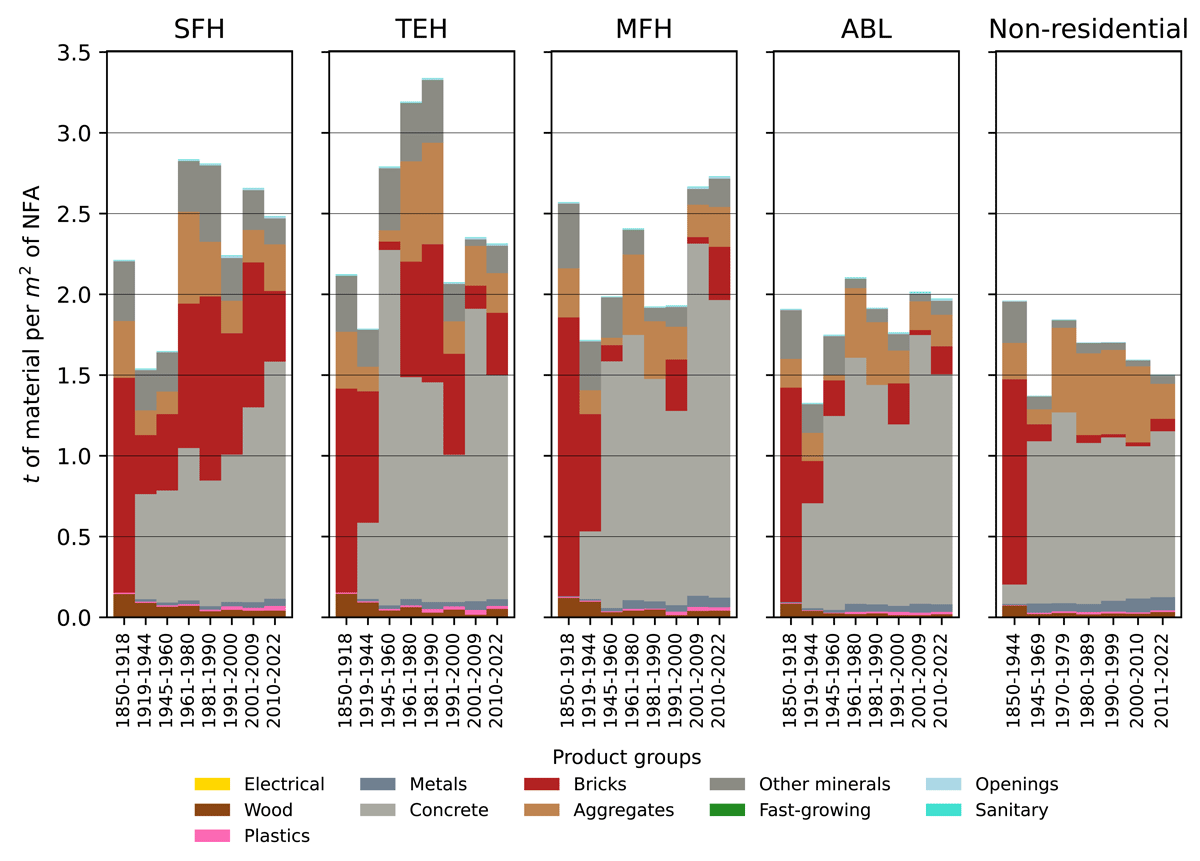
Figure 3
Material composition of the building archetypes, per typology and construction period, averaged per net floor area.
Note: SFH = single-family house; TEH = terraced house; MFH = multifamily house; ABL = apartment building.
Although the material intensity of single-family houses seems to double from 1945–60 to 1961–80, this reflects changes in net floor area between the building archetypes rather than a drastic change in construction techniques. Indeed, when analysing the material intensity per building instead of floor area (available in the supplemental data online), both building archetypes have a similar material intensity, about 353 tonnes of materials per building.
3.2 Greenhouse gas emission results
Across all scenarios, circular economy strategies achieve notable reductions in cumulative embodied GHG emissions between 2023 and 2050, as illustrated in Figure 4. In the reference (REF) scenario, emissions are dominated by new construction (A1–A5), which constitutes 63% of the total. Replacement and renovation activities (B4–B5) contribute 33%, while demolition (C1–C4) accounts for the remaining 4%. Compared to the REF scenario, the circular economy strategies yield total emission reductions of 8% in the REUSE scenario, 9% in the RECYCLE scenario, and 14% in the RENOV scenario. These reductions are primarily achieved within the new construction phase (A1–A5), where emissions decrease by 8% (REUSE), 10% (RECYCLE) and 26% (RENOV) compared to REF. The significant reduction in the RENOV scenario is attributable to avoided new construction, although this benefit is partially offset by a 16% increase in emissions from intensified renovation activities (B5). Furthermore, all scenarios reduce demolition-related emissions (C1–C4) owing to decreased demolition or waste processing activities. Compared to the REF scenario, these reductions amount to 55% for REUSE, 40% for RENOV and 18% for RECYCLE.
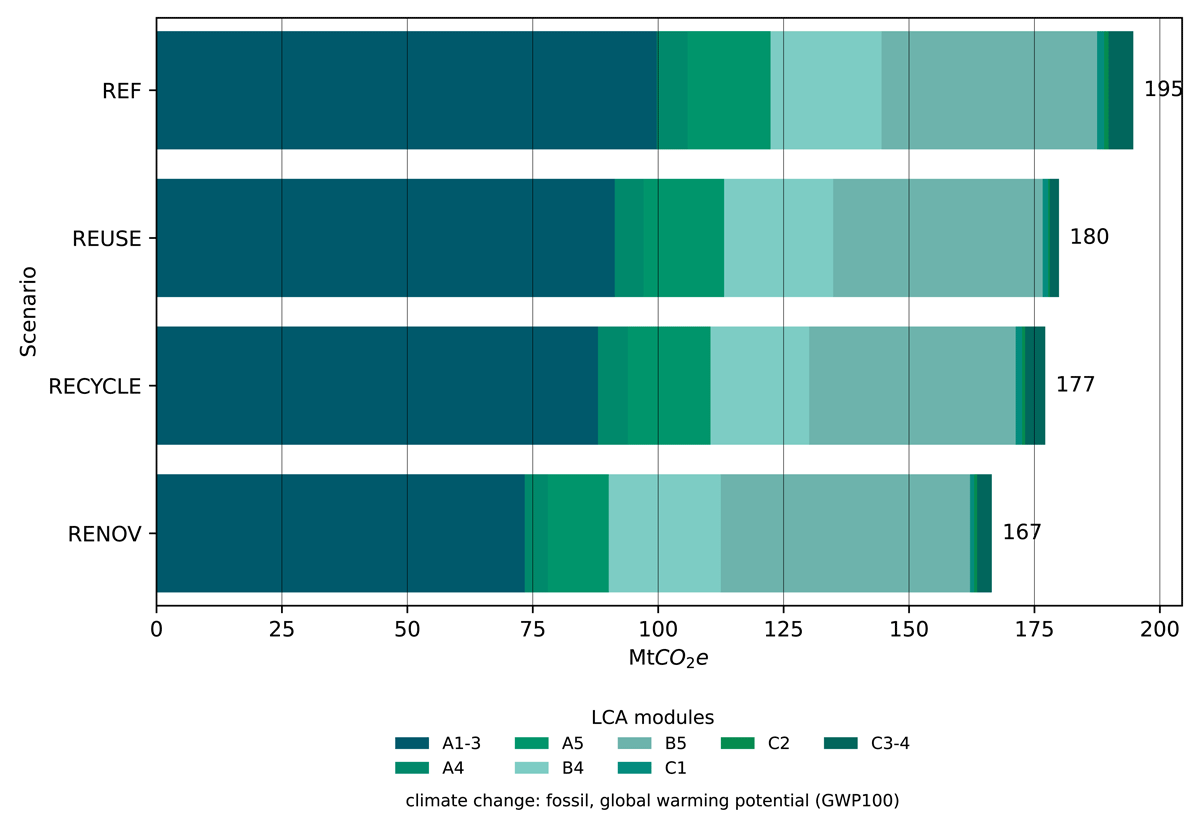
Figure 4
Cumulative embodied GHG emissions of the four future scenarios, 2023–50.
Notes: Emissions are shown for different life cycle stages. Modules A1 to A5 refer to new buildings, B4 to the replacement of materials, B5 to renovations and C1 to C4 to demolitions.
Figure 5 further shows the cumulative GHG emissions broken down by building typology, building component and building material. The largest absolute emission reductions in all scenarios come from single-family houses, because they represent the largest share of the baseline emissions owing to new constructions. Compared to the other scenarios, the RENOV scenario has a large impact on residential buildings but limited effect on non-residential buildings. Regarding components, the results clearly separate the building’s structure (walls, floors) from its services (heating, electrical). While circular economy strategies allow for tangible GHG emission reductions in the structure, they fail to address the services. The RENOV scenario drastically reduces emissions from foundations (–25%), retaining walls (–30%) and upper floors (–23%), highlighting the core strength of the strategy: avoiding new structural work. REUSE has a small impact on foundations and retaining walls but shows more effectiveness for components such as internal non-load-bearing walls. Mineral materials see their largest reduction in the RENOV scenario, reinforcing that avoiding new concrete is an effective strategy. However, a trade-off is the increase of emissions owing to synthetic insulation materials because of increased renovation needs. RECYCLE provides most effective emission reductions for metals and mineral construction materials but has a limited impact on plastics.
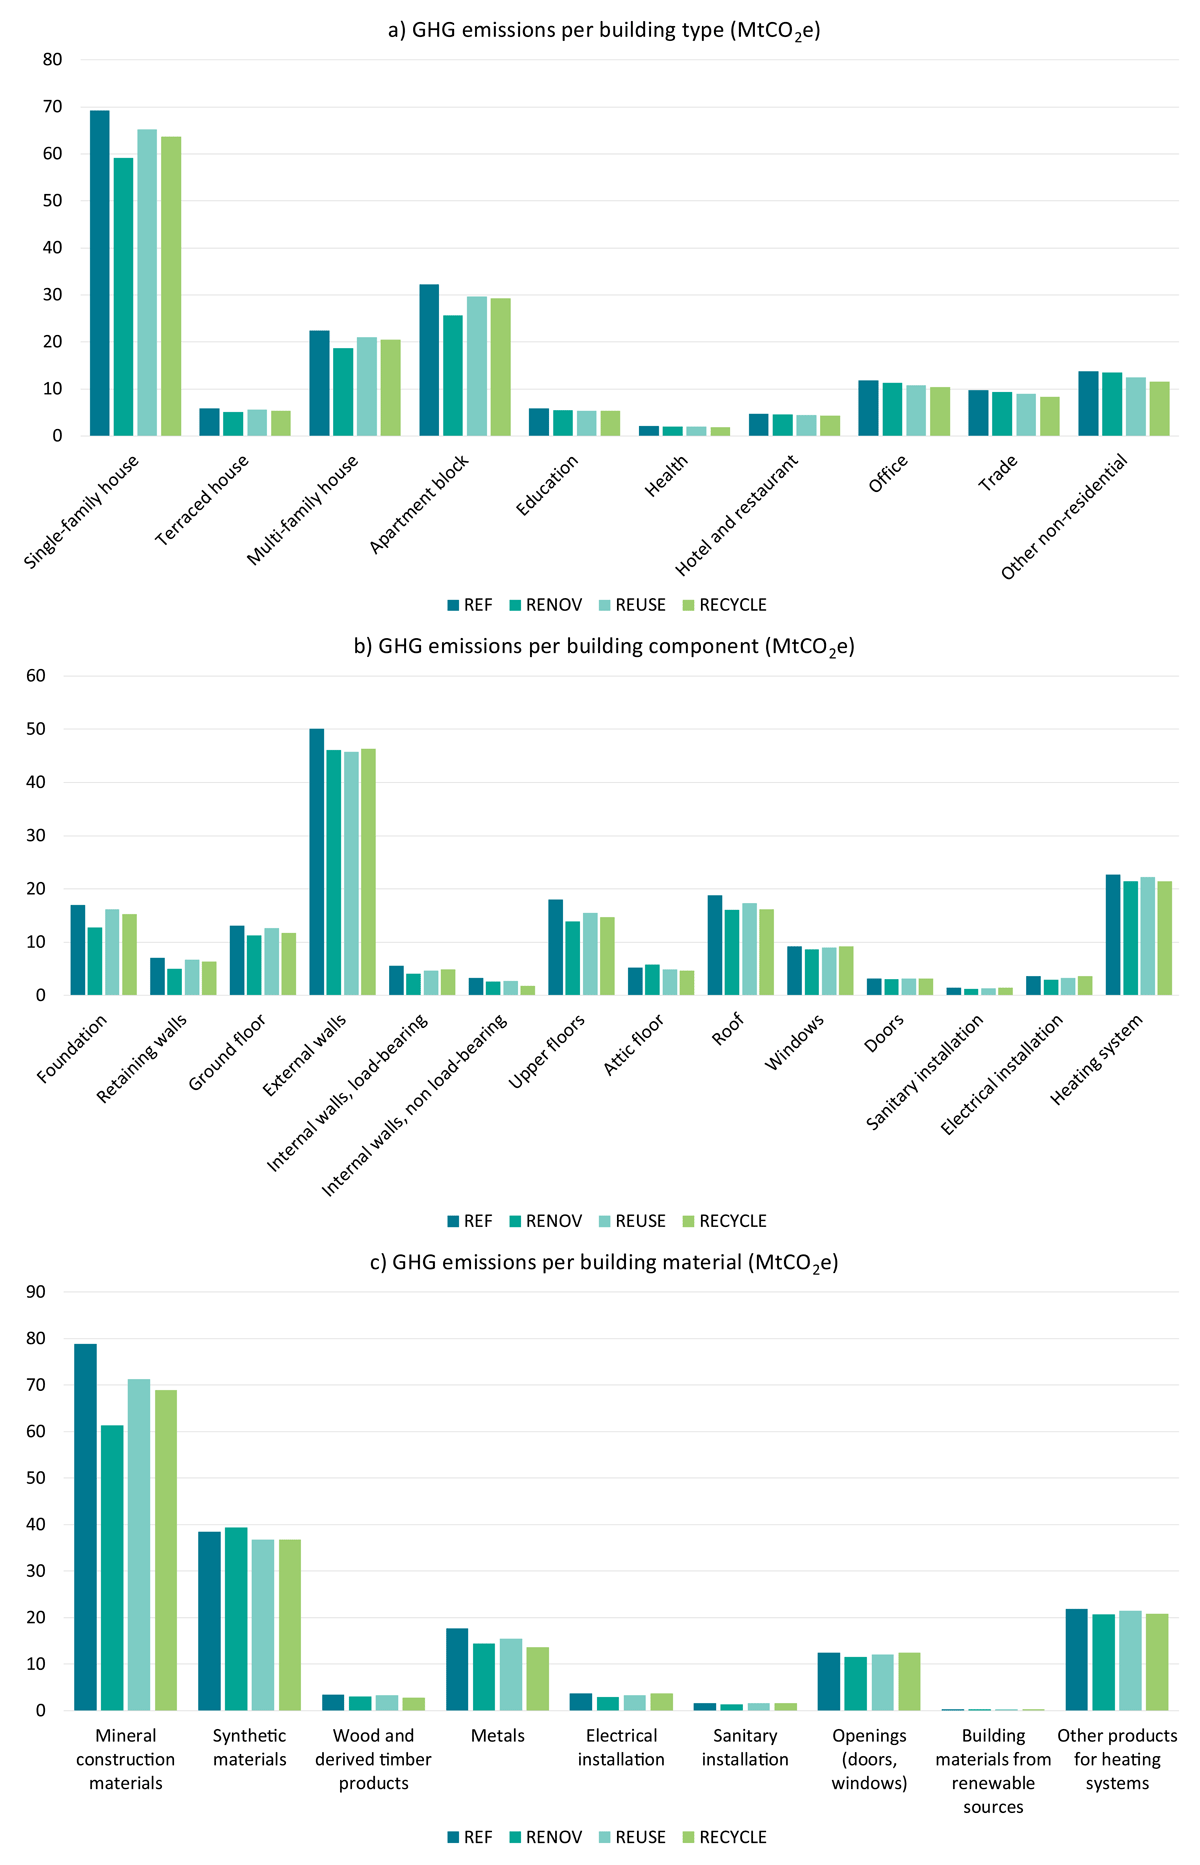
Figure 5
Cumulative embodied GHG emissions of the four future scenarios, 2023–50.
Notes: Scenarios are shown for a) building typology, b) building component and c) building material. Process emissions for construction and demolition are not included in this overview.
3.3 Sensitivity analysis
Table 2 presents a sensitivity analysis of the GHG emission reduction potentials for each circular economy scenario under three distinct future conditions. These conditions are: ‘STATIC’, which extrapolates past trends; ‘PROSPECTIVE’, which assumes an ambitious transition to renewable energy, thereby affecting energy-intensive industrial processes; and ‘OPTIMISATION’, which models a shift towards bio-based materials and an optimised use of concrete and steel (reduction in the amount used due to structural optimisation). Quantitative numbers behind these scenarios were provided in Table 1. The RENOV scenario consistently demonstrates the highest reduction potential, achieving a 13–15% decrease in GHG emissions compared to the reference scenario, irrespective of the future conditions tested. Its effectiveness is slightly enhanced under the ‘OPTIMISATION’ condition owing to the replacement of plastic-based insulation with lower-impact alternatives, which reduces the emissions trade-off from renovation activities. In contrast, the REUSE scenario is highly sensitive to future conditions. Its GHG reduction potential diminishes to just 5% under both the ‘PROSPECTIVE’ and ‘OPTIMISATION’ conditions, highlighting that the benefits of reuse are highly dependent on the material and energy intensity of the new material component it displaces. The performance of the RECYCLE scenario also varies significantly. It achieves its highest potential under the ‘PROSPECTIVE’ condition, as a low-carbon energy mix reduces the emissions from recycling processes themselves. However, its effectiveness is substantially diminished to only a 3% reduction under the ‘OPTIMISATION’ condition, where the benefits of recycling are less pronounced compared to building with lower-impact, bio-based materials.
4. Discussion
4.1 Policy and practical relevance
Three circular economy levers (longer building service lifespans through renovation, component reuse and material recycling) could together save a noticeable share of embodied GHG emissions from the Austrian building stock by 2050. Extending the lifespan of buildings through renovation stands out as the quickest lever for cutting embodied emissions, independently of the future energy mix and building construction techniques, so policymakers, designers and business models should converge on measures that simplify and incentivise such renovations, in addition to energy retrofit.
In practice, of all demolished buildings, it is estimated that only 30% are demolished because they no longer fulfil technical requirements, such as structural integrity issues or non-compliance with building codes and regulations. Demolitions are usually preferred for economic or aesthetic reasons that cannot always be remedied by renovation measures (Metabolic 2022). This shows that, in addition to the ongoing and necessary wave of energy-driven renovations, a complementary wave of preservation-focused renovations is required. To support this wave, researchers and practitioners could gather high-quality data on the buildings that are at risk of demolition, as a basis for the development of renovation solutions that could either improve the aesthetic of buildings or support new business models.
Targeted policy incentives should then shift from solely addressing energy inefficiency towards also remedying economic underperformance and aesthetic deficiencies in existing buildings. Such incentives could range from increasing attention to preservation rather than demolition towards banning the demolition of buildings that do not represent major safety concerns.
The benefits of reuse and recycling depend heavily on a decarbonised energy grid and the availability of compatible material streams, meaning that reuse and recycling initiatives must be coordinated with broader decarbonisation policies to realise their full potential. In particular, there is a material mismatch that limits its impact unless components are standardised and incorporated into early-stage design, requiring close collaboration among architects, regulators and data platform providers. A major obstacle to recycling is the quality and availability of recycled waste materials. As a result, a large part of material recycling is based on low-quality recovery, for example where concrete is downcycled as input for road construction and not recycled for the production of new concrete. To achieve full recycling of metals, separation and refining techniques need to be improved. On-site waste separation or end-of-life testing of buildings could contribute to higher recycling rates (Alaux, Marton et al. 2024). Policy measures that can enable higher recycling rates in Austria are described in detail in Vogel et al. (2025). These include, for example, reforming the tax system to incentivise circular production, research and development for circular design, monitoring and enforcing existing bans on landfilling and incineration of recyclable waste or creating new cross-sector networks between key actors along the circular value chains.
4.2 Model uncertainties and limitations
To project the future, building stock models use input data, such as information on building archetypes or life cycle scenarios, and dynamic parameters, including renovation rates and the evolution of the energy mix. Both categories are inherently uncertain and challenging to predict (Li et al. 2023; Slavkovic & Stephan 2025). The present study addressed these uncertainties through a two-step approach:
High-quality data on the Austrian building stock was compiled, thereby achieving a finer level of detail than previous investigations.
Scenario and sensitivity analyses were conducted. These are common methods for quantifying uncertainty in building stock modelling (Bischof & Duffy 2022; Röck et al. 2021).
Nonetheless, the precision of these results could be further enhanced in subsequent work by addressing the principal modelling limitations identified herein, considerations that are essential when formulating future policy recommendations.
Regarding data granularity, the spatial scope was expanded by including details and applying the circular economy strategy directly to buildings, components and materials; however, no geographical information is contained in the model. Owing to the difficulty of scaling, most studies that have geo-referenced models focus on cities (e.g. Augiseau & Kim 2021). A particular challenge is linking the archetypes from the model to existing buildings, which at least requires information about the typology and the year of construction. Existing databases such as EUBUCCO can help to make this possible (Milojevic-Dupont et al. 2023).
The level of granularity available is very country-dependent. In Austria, there is virtually no information on the age or utilisation of existing buildings at the local level. Machine learning could help and has proven its effectiveness, but it still requires a large database to train. The buildings need to be selected by the model to avoid bias (Weikert 2024), which also limits the feasibility of such matching. Geo-referencing the building stock of a whole country would also require large amounts of data, such as façade images, but many buildings are obstructed by others, which adds to the complexity. Further research is needed to obtain a full countrywide, geo-referenced model. This could support the findings regarding components reuse, for which more detailed modelling of geometries and structural constraints would improve accuracy.
Extending the lifespan of buildings through renovation measures was simulated using thermal renovation interventions drawn from earlier projects (Loga et al. 2016). These could be refined by incorporating deep structural modifications or repurposing requirements, and the compatibility of these renovation solutions with the latest provisions of the Energy Performance of Buildings Directive (EPBD) (European Parliament 2024) also warrants further investigation. It was also assumed that the buildings retain their original function. However, further work could investigate the potential for repurposing at the building stock level, such as converting office spaces into residential units. Previous studies at building level have shown that embodied GHG emissions can be reduced by up to 20–41% (Assefa & Ambler 2017).
Other trade-offs that could be further investigated are the impact of circular economy strategies on the energy efficiency of buildings. Renovations could be less likely to achieve the zero-emissions building status from the EPBD, while newly constructed buildings typically exhibit low operational GHG emissions. Moreover, the reuse of older, less energy-efficient components may also influence operational emissions.
5. Conclusions
The PULSE-AT model was used to assess the potential of circular economy measures to reduce embodied GHG emissions across the whole life cycle (spanning 2023 to 2050) of the Austrian building stock. The novelty lies in employing a prospective MFA–LCA methodology that delivers highly detailed results for the national building stock, providing quantitative insights to policymakers on the contribution of circular economy measures to Austria’s climate neutrality goal. The research shows that increasing the lifespan of buildings through renovation offers the most robust potential, consistently reducing cumulative embodied GHG emissions by 13–15% regardless of the evolution of the energy mix or construction techniques. In contrast, component reuse and material recycling provide more modest reductions of 5–8% and 3–10%, respectively, with their effectiveness highly dependent on the provision of low-carbon energy or alternative construction scenarios.
Building on the European Union’s current energy-focused renovation wave, these results suggest launching a ‘preservation-driven’ renovation effort. To back this effort, policy incentives should expand beyond their remit from improving energy-inefficient buildings and also target structures that are economically underperforming or lack aesthetic appeal. This would help Austria meet its goal of a climate-neutral building stock by reducing embodied GHG emissions, and it could offer similar benefits to other countries with mature building stocks.
As the scenario analyses are subject to intrinsic uncertainties, the robustness of the study’s conclusions could be enhanced. Future studies could focus on a) improving the granularity and parameterisation of the modelled renovation interventions and b) transitioning to a fully spatially explicit, geo-referenced modelling framework.
Notes
[1] Based on updated statistics subsequent to the publication of the model (Alaux, Schwark et al., 2024), the estimated total net floor area of the Austrian building stock has been revised (Statistik Austria 2024b), indicating an approximate 6% reduction.
Acknowledgements
The authors thank Benedict Schwark for his support in programming the building stock model and creating some of the visualisations for this article, as well as Karen Pittel for taking the time to critically review this paper before its submission.
AI declaration
During the revision process of this work, the authors used Gemini 2.5 to enhance the language and clarity. After using this tool, the authors reviewed and edited the content as needed and take full responsibility for the content of this publication.
Author contributions
NA: conceptualisation, investigation, methodology, visualisation, writing – original draft. VK: conceptualisation, validation, writing – review & editing. JV: conceptualisation, validation, writing – review & editing. AP: conceptualisation, supervision, writing – review & editing.
Competing interests
The authors have no competing interests to declare.
Data availability
The results presented in this article were generated with the open-source building stock model PULSE-AT: https://github.com/ITE-NHB/PULSE-AT. The data supporting this study are provided in the supplemental data online. Additional data are available from the authors upon reasonable request.
Supplemental data
Supplemental data for this article can be accessed at: https://doi.org/10.5334/bc.676.s1