
Table 1
Sufficiency policy measures (SPMs).
| MEASURE | |
|---|---|
| Enabling |
|
| |
| |
| Informative |
|
| Disabling |
|
| |
|
Table 2
Description of the study’s participants.
| Main occupation n (%) | Student/unemployed | Part-time employed | Full-time employed | Retired |
| 5 (12.8%) | 1 (2.6%) | 17 (43.6%) | 16 (41%) | |
| Age range (years) n (%) | 25–34 | 35–44 | 45–64 | ≥ 65 |
| 6 (15%) | 7 (18%) | 10 (26%) | 16 (41%) | |
| Level of education n (%) | Basic education | Upper secondary education | Higher education: bachelor’s degree or equivalent | Higher education: master’s degree or equivalent |
| 0 | 15 (38%) | 17 (44%) | 7 (18%) | |
| Place of residence n (%) | Uusimaa | Päijät-Häme | Central-Finland | Lapland |
| 31 (79%) | 1 (3%) | 3 (8%) | 4 (10%) | |
| Housing type n (%) | Apartment building | Terraced house | Semi-detached house | Detached house |
| 17 (43.6%) | 1 (2.6%) | 2 (5%) | 19 (48.7%) | |
| Area (m2) n (%) | 0–79 | 80–99 | 100–149 | ≥ 150 |
| 16 (41%) | 4 (10%) | 11 (28%) | 8 (21%) | |
| Permanent residents in the household n (%) | 1 | 2 | 3 | ≥ 4 |
| 10 (26%) | 23 (59%) | 2 (5%) | 4 (10%) | |
| Gross annual income of the household (€/year) n (%) | 0–39,999 | 40,000–79,999 | 80,000–99,999 | ≥ 100,000 |
| 13 (33%) | 16 (41%) | 4 (10%) | 6 (16%) |
Table 3
Acceptability of the sufficiency policy measures (SPMs).
| YES | MAYBE YES | MAYBE | MAYBE NO | NO | ||
|---|---|---|---|---|---|---|
| Enabling |
| 15 | 10 | 9 | 3 | 2 |
| 14 | 8 | 12 | 3 | 2 | |
| 22 | 4 | 8 | 2 | 3 | |
| Informative |
| 21 | 7 | 5 | 0 | 3 |
| Disabling |
| 5 | 2 | 2 | 4 | 26 |
| 19 | 5 | 10 | 2 | 3 | |
| 12 | 5 | 3 | 5 | 14 | |
| Total numbers of expressions of acceptability | 108 | 41 | 49 | 19 | 39 | |
[i] Note: Bold numbers represent the most popular reaction to each policy measure and highlight the variation of responses: most policy measures were accepted, but some with met with resistance.
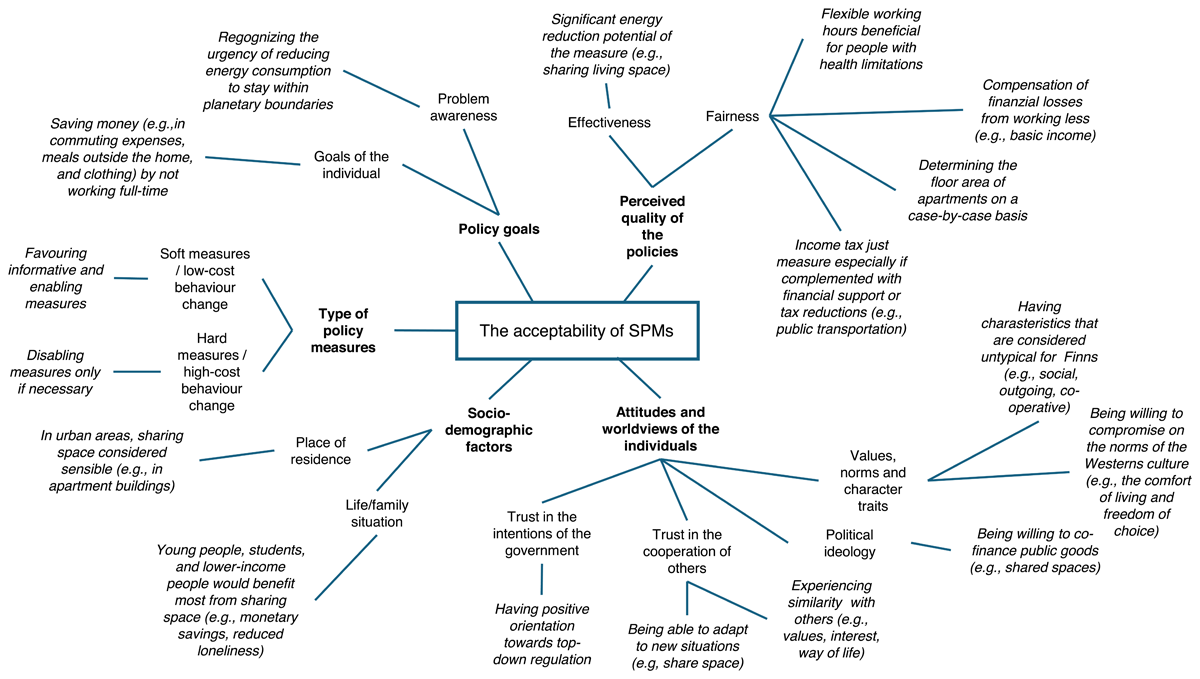
Figure 1
Factors increasing the acceptability of sufficiency policy measure (SPMs).