
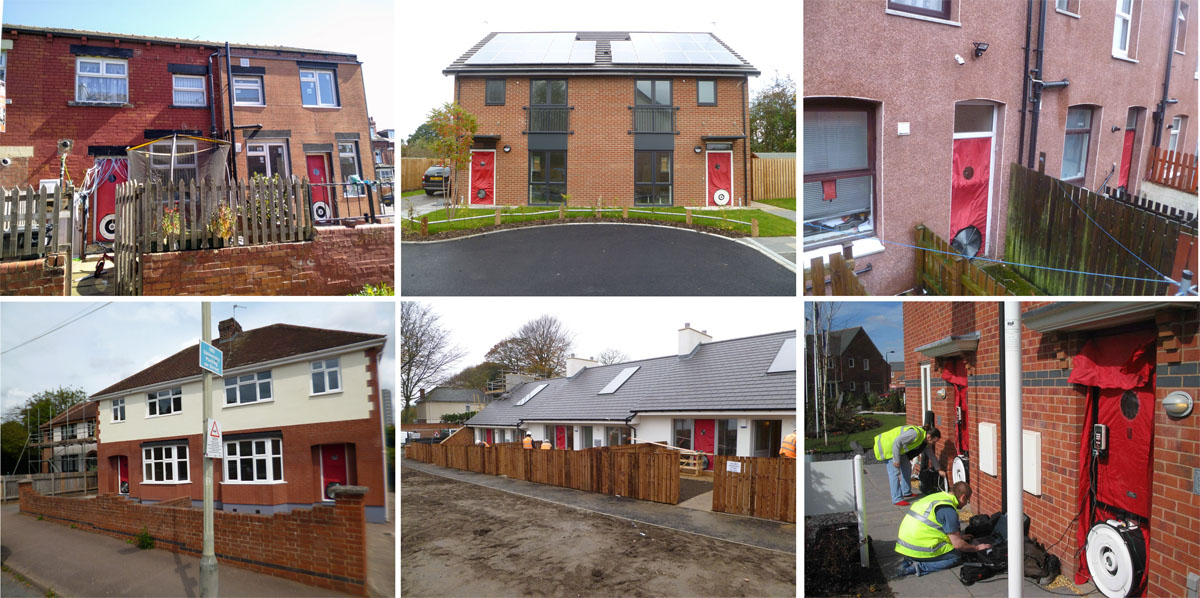
Figure 1
Co-pressurisation tests being undertaken in the case study homes.
Table 1
Co-pressurisation case study homes.
| CASE STUDY ID | HOMES (n) | TESTS (n) | NEW HOME OR EXISTING | HOME TYPE | CO-PRESSURISATION METHOD | PERIOD |
|---|---|---|---|---|---|---|
| A1–A10.2 | 10 | 24 | Existing | House | Spot 50 | 2019–23 |
| B1.1–B1.2 | 1 | 2 | New | House | Full | 2022–23 |
| C1–C2 | 2 | 2 | New | Bungalow | Full | 2012–13 |
| D1–D3 | 3 | 3 | New | House | Spot 50 | 2024 |
| E1–E2 | 2 | 2 | New | House | Full | 2012–13 |
| F1.1–F1.2 | 1 | 2 | Existing | House | Spot 50 | 2019 |
| G1–G2 | 2 | 2 | Existing | House | Full | 2024 |
| Total | 21 | 37 |
Table 2
Airtightness results for case study homes.
| CASE STUDY | CO-PRESSURISATION (m3/(m2.h) at 50 Pa) | PRESSURISATION (m3/(m2.h) at 50 Pa) | DIFFERENCE (%) | PARTY WALLS (n) | PARTY WALLS NEUTRALISED (n) | PARTY WALL CONSTRUCTIONa |
|---|---|---|---|---|---|---|
| A1.1 | 11.66 | 13.17 | 11% | 2 | 1 | Solid brick |
| A1.2 | 8.89 | 9.77 | 9% | 2 | 1 | Solid brick |
| A2.1 | 10.96 | 14.89 | 26% | 2 | 1 | Solid brick |
| A2.2 | 11.52 | 15.10 | 24% | 2 | 1 | Solid brick |
| A2.3 | 11.24 | 14.23 | 21% | 2 | 1 | Solid brick |
| A2.4 | 9.97 | 13.29 | 25% | 2 | 1 | Solid brick |
| A2.5 | 10.69 | 13.63 | 22% | 2 | 1 | Solid brick |
| A2.6 | 8.51 | 9.74 | 13% | 2 | 1 | Solid brick |
| A3.1 | 10.68 | 14.87 | 28% | 2 | 1 | Solid brick |
| A3.2 | 11.22 | 15.04 | 25% | 2 | 1 | Solid brick |
| A3.3 | 10.13 | 13.40 | 24% | 2 | 1 | Solid brick |
| A3.4 | 10.75 | 13.96 | 23% | 2 | 1 | Solid brick |
| A3.5 | 7.81 | 8.78 | 11% | 2 | 1 | Solid brick |
| A4 | 10.80 | 13.59 | 21% | 1 | 1 | Solid brick |
| A5 | 6.89 | 8.34 | 17% | 1 | 1 | No fines concrete |
| A6.1 | 11.87 | 14.61 | 19% | 1 | 1 | Solid brick |
| A6.2 | 12.02 | 13.24 | 9% | 1 | 1 | Solid brick |
| A7 | 13.52 | 15.72 | 14% | 1 | 1 | Block and Steel |
| A8.1 | 10.15 | 13.82 | 27% | 1 | 1 | Solid brick |
| A8.2 | 6.49 | 8.62 | 25% | 1 | 1 | Solid brick |
| A8.3 | 5.58 | 7.95 | 30% | 1 | 1 | Solid brick |
| A9 | 7.52 | 8.99 | 16% | 1 | 1 | Solid brick |
| A10.1 | 10.02 | 12.03 | 17% | 1 | 1 | Solid brick |
| A10.2 | 5.87 | 8.29 | 29% | 1 | 1 | Solid brick |
| B1.1 | 9.52 | 12.52 | 24% | 1 | 1 | Solid brick |
| B1.2 | 8.13 | 11.76 | 31% | 1 | 1 | Solid brick |
| C1 | 5.10 | 7.91 | 36% | 1 | 1 | Cavity blockb |
| C2 | 4.92 | 7.78 | 37% | 1 | 1 | Cavity blockb |
| D1 | 7.78 | 8.64 | 10% | 1 | 1 | Cavity block (insulated)b |
| D2 | 4.49 | 4.82 | 7% | 1 | 1 | Cavity block (insulated)b |
| D3 | 5.23 | 5.86 | 11% | 1 | 1 | Cavity block (insulated)b |
| E1 | 0.45 | 0.92 | 51% | 2 | 2 | Cavity timber (insulated)b |
| E2 | 0.61 | 0.91 | 33% | 2 | 2 | Cavity timber (insulated)b |
| F1.1 | 12.45 | 16.6 | 25% | 1 | 1 | No fines concrete |
| F1.2 | 11.1 | 14.8 | 25% | 1 | 1 | No fines concrete |
| G1 | 18.06 | 21.6 | 16% | 1 | 1 | Cavity block |
| G2 | 16.51 | 18.71 | 12% | 1 | 1 | Cavity block |
[i] Note: aNo party wall insulation or cavity sealing unless stated.
bAssumed sealed cavity.
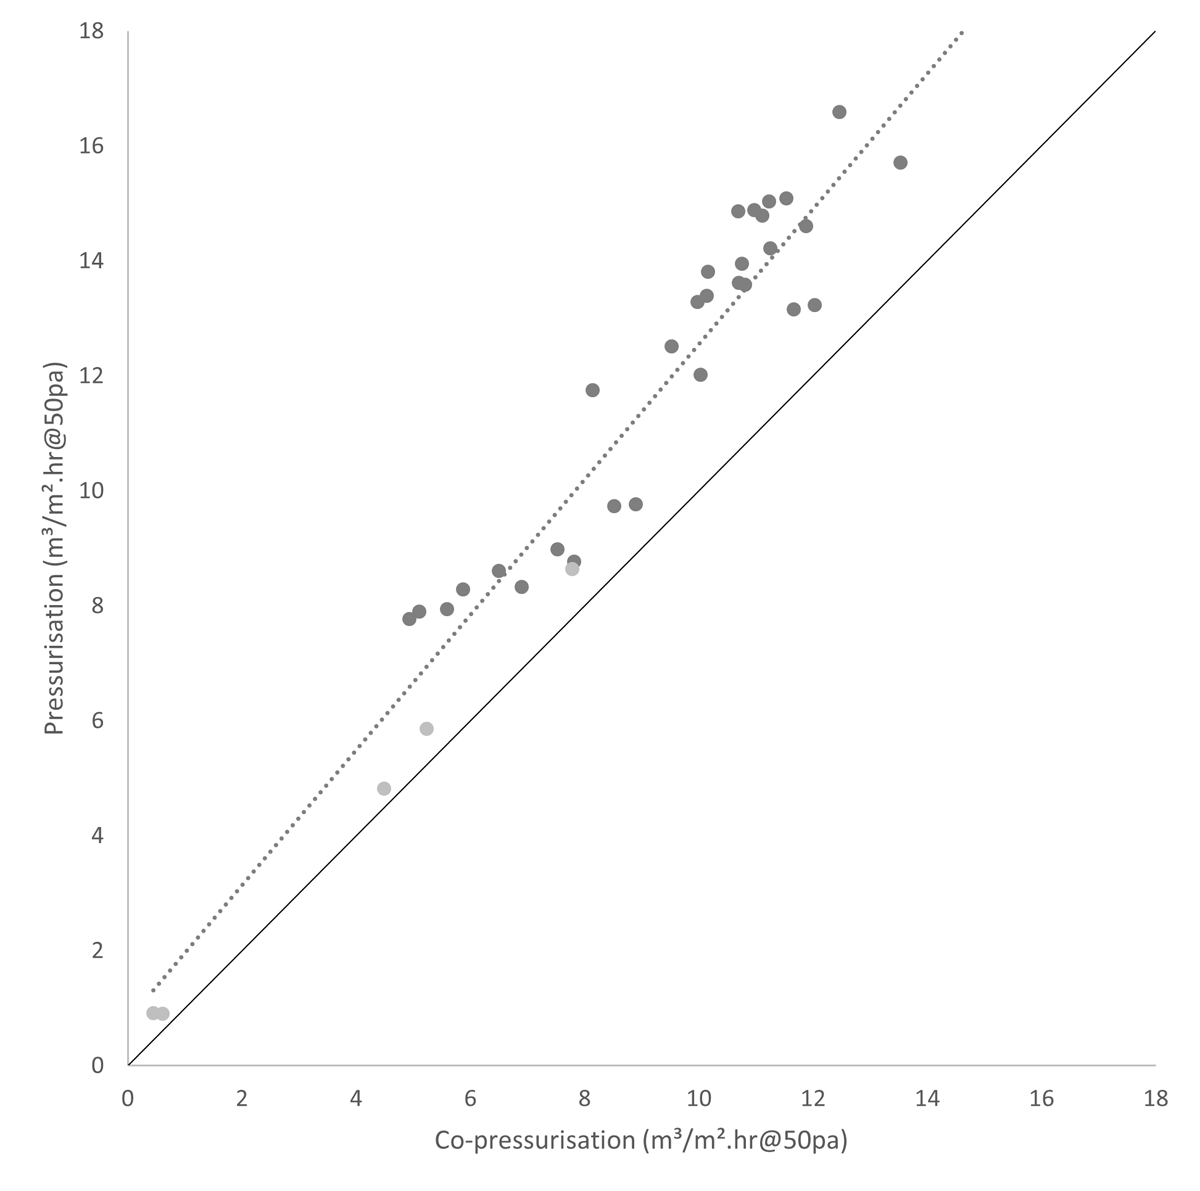
Figure 2
Comparison of the pressurisation and co-pressurisation tests results.
Note: Light grey = new build; dark grey = existing homes. The black line represents X = Y.
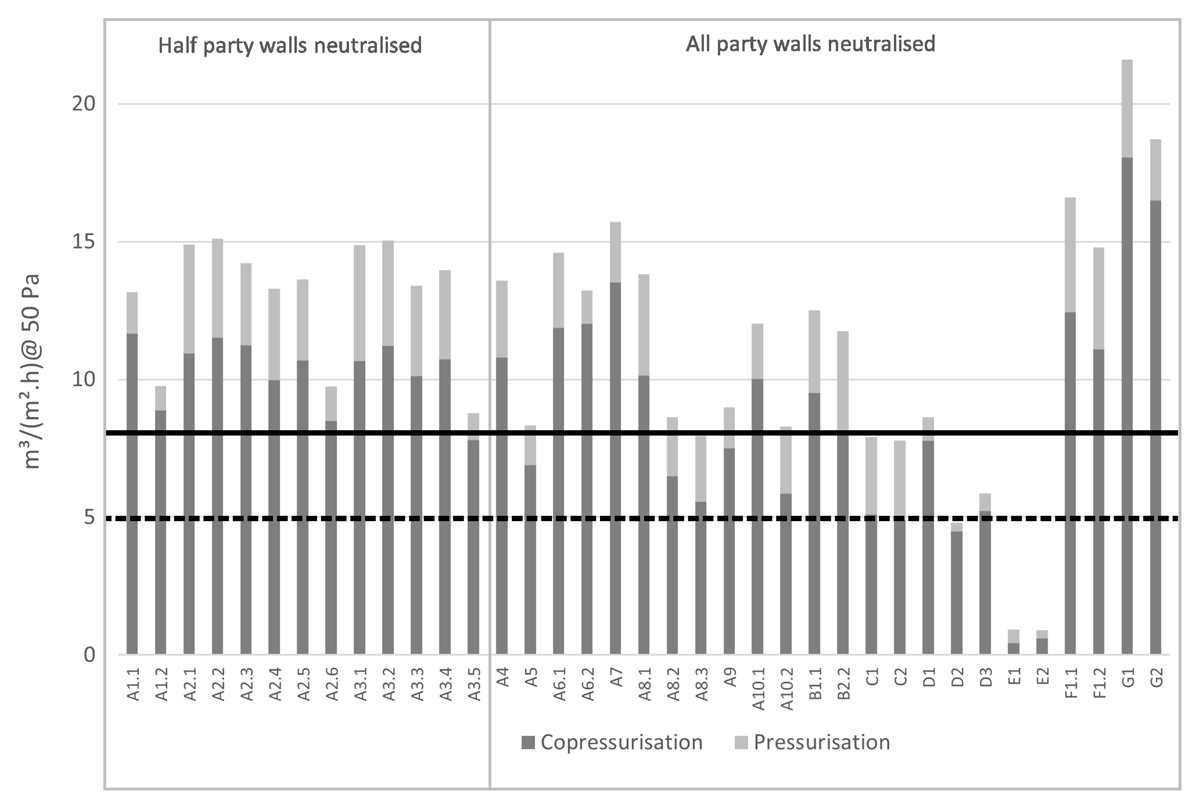
Figure 3
Comparison of the co-pressurisation and pressurisation results.
Note: Black line = maximum allowable airtightness value for new-build home England and Wales Building Regulations compliance; and dashed line = threshold under which constant mechanical ventilation is required.
Table 3
Summary of the mean co-pressurisation and individual dwelling pressurisation tests.
| TESTS (n) | CO-PRESSURISATION (m3/(m2.h) AT 50 Pa) | PRESSURISATION (m3/(m2.h) AT 50 Pa) | DIFFERENCE (m3/(m2.h) AT 50 Pa) | DIFFERENCE (%) | |
|---|---|---|---|---|---|
| All tests | 37 | 8.56 | 10.78 | 2.21 | 21% |
| All homes (excluding retrofitted stages) | 21 | 9.01 | 11.25 | 2.24 | 22% |
| All party walls neutralised | 13 | 7.78 | 9.75 | 1.97 | 21% |
| One of two party walls neutralised | 28 | 10.31 | 13.07 | 2.76 | 20% |
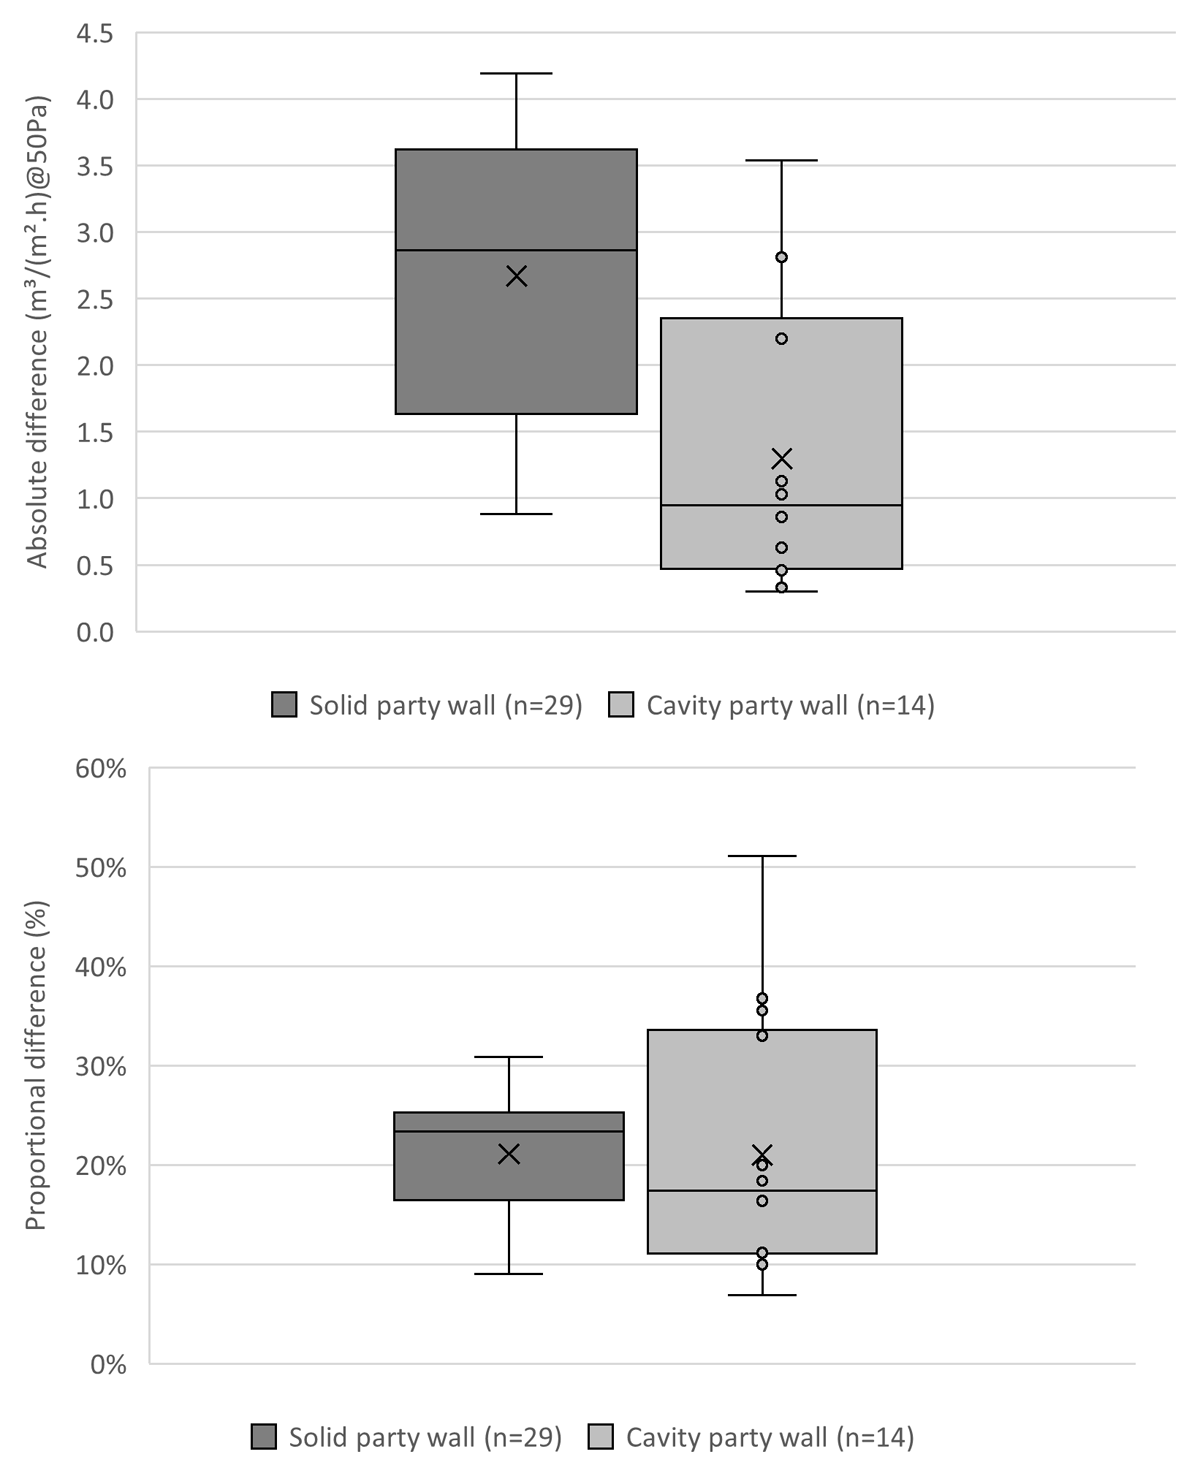
Figure 4
Comparison of inter-dwelling air exchange taking place during the fan pressurisation test in solid and cavity party walls.
Table 4
Comparison of the airtightness values derived from the Reduced Standard Assessment Procedure (RdSAP) defaults, fan pressurisation and co-pressurisation tests.
| CASE STUDY | DEFAULT RDSAP AIR LEAKAGE (m3/(m2.h) AT 50 Pa) | PRESSURISATION (m3/(m2.h) AT 50 Pa) | CO-PRESSURISATION (m3/(m2.h) AT 50 Pa) |
|---|---|---|---|
| A1.1 | 17.9 | 13.2 | 11.7 |
| A1.2 | 14.9 | 9.8 | 8.9 |
| A2.1 | 17.9 | 14.9 | 11.0 |
| A2.2 | 15.1 | 15.1 | 11.5 |
| A2.3 | 15.1 | 14.2 | 11.2 |
| A2.4 | 15.1 | 13.3 | 10.0 |
| A2.6 | 15.1 | 9.7 | 8.5 |
| A3.1 | 17.9 | 14.9 | 10.7 |
| A3.2 | 15.1 | 15.0 | 11.2 |
| A3.4 | 15.1 | 14.0 | 10.8 |
| A3.5 | 15.1 | 8.8 | 7.8 |
| A4 | 16.0 | 13.6 | 10.8 |
| A5 | 11.0 | 8.3 | 6.9 |
| A6.1 | 17.9 | 14.6 | 11.9 |
| A6.2 | 14.9 | 13.2 | 12.0 |
| A7 | 15.6 | 15.7 | 13.5 |
| A8.1 | 15.7 | 13.8 | 10.2 |
| A8.2 | 12.9 | 8.6 | 8.0 |
| A9 | 10.9 | 9.0 | 7.5 |
| A10.1 | 15.9 | 12.0 | 10.0 |
| A10.2 | 13.9 | 8.3 | 5.9 |
| Mean | 15.2 | 12.4 | 10.0 |
| Difference from the default value (%) | – | 18% | 34% |
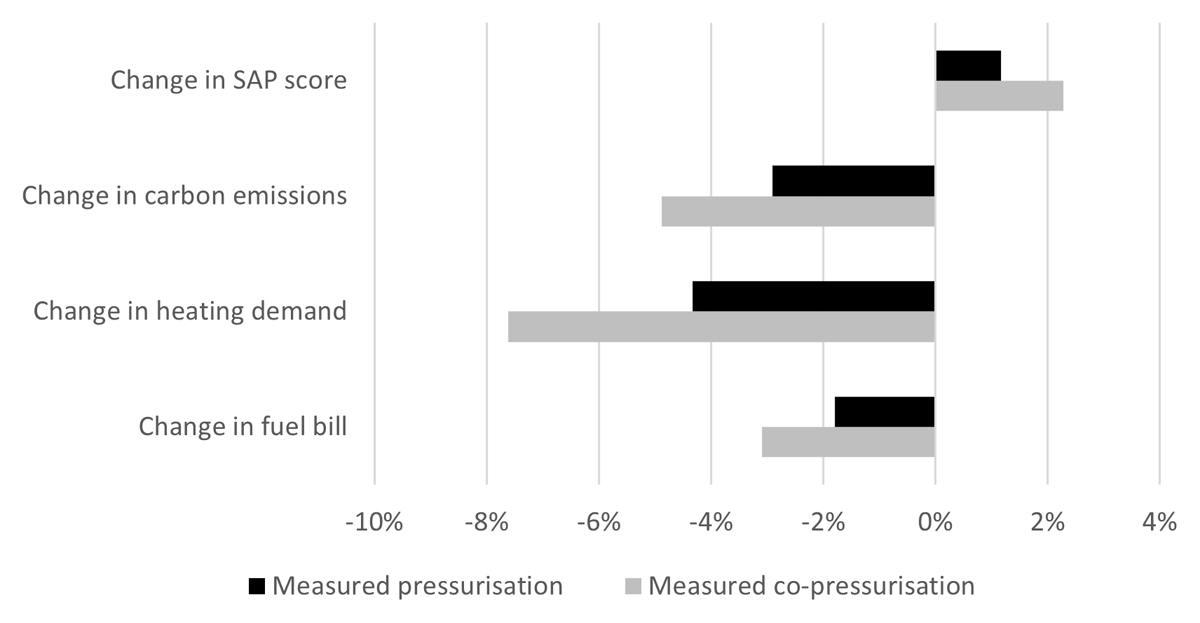
Figure 5
Impact on space heating requirement, annual fuel bills, carbon emissions and Standard Assessment Procedure (SAP) score of replacing default airtightness values used in Energy Performance Certificates (EPCs), with values derived from standard fan pressurisation and co-pressurisation tests.
Table 5
Difference between the modelled outputs when using different airtightness values.
| DEFAULT VALUE | PRESSURISATION VALUE | CO-PRESSURISATION VALUE | DIFFERENCE BETWEEN FPT AND CO-PRESSURISATION (%) | |
|---|---|---|---|---|
| SAP score | 69.7 | 70.5 | 71.3 | 1% |
| Annual fuel bills | £1,123 | £1,103 | £1,088 | 1% |
| Carbon emissions (kg CO2/year) | 4,027 | 3,910 | 3,831 | 2% |
| Space heating (kWh/m2/year) | 123 | 118 | 113 | 3% |
[i] Note: FPT = fan pressurisation tests; SAP = Standard Assessment Procedure.