
1. Introduction
1.1 Background
Energy use in buildings is responsible for just under one-fifth of global greenhouse gas emissions (Cabeza et al. 2022). In the UK, space heating is responsible for almost two-thirds of emissions from homes (IEA 2024), and policies to reduce heat loss from new and existing buildings are recognised internationally as an essential part of achieving net zero targets (European Commission 2018). In addition to reducing space heating demand, reducing heat losses is considered essential to support heat pump uptake as part of broader domestic heat decarbonisation targets (Eyre et al. 2023). Domestic energy efficiency policies also support fuel poverty reduction, improve health and comfort (Hassan et al. 2024), and contribute to a just transition (Gillard et al. 2017).
Uncontrolled ventilation, often termed ‘air leakage’ or ‘background ventilation’, is thought to be responsible for between 10% and 50% of a dwelling’s space heating demand, depending on the construction quality and state of repair of the home (EST 2006; Gorse et al. 2017; Zheng et al. 2020), though limited field trial data exist. Reducing infiltration rates not only has the potential to reduce heat loss from homes, but also it provides comfort benefits to occupants (Ganesh et al. 2021). Maximum allowable air leakage rates have therefore been incorporated into the building regulations and retrofit policies of many countries (European Commission 2018; Limb 2001).
The fan pressurisation test (FPT) is the most commonly used method to measure air leakage; it has an international standard (ISO 2015) and associated national professional bodies. In the UK, airtightness tests have been required since 2006, and currently, all new homes must be measured to have air leakage below a threshold of 8 m3/(m2.h) at 50 Pa (HM Government 2021a; Love et al. 2017). The FPT is the main method for evidencing compliance, with over 130,000 tests lodged annually (Love et al. 2017). Results from the FPT are also used in building energy models, for instance, in the As-Built Standard Assessment Procedure (SAP) calculations required to meet Part L of the England and Wales Building Regulations and to produce Energy Performance Certificates (EPCs) in the UK. However, the Reduced Standard Assessment Procedure (RdSAP) model does not allow assessors to input measured airtightness values and relies only on default values (BRE 2023; HM Government 2023; Parker et al. 2019, n.d.; Mathur & Damle 2021) to investigate the airtightness of specific architectural details (Hong & Kim 2018), to evaluate interventions to the building fabric, including retrofits (BSI 2023; Colijn et al. 2017), to identify specific air leakage pathways (Cardoso et al. 2020) and it has been used to support radon detection (Froňka & Moučka 2005). The England and Wales Building Regulations also use airtightness values to inform ventilation strategies. For instance, if air leakage is measured to be < 5 m3/(m2.h) at 50 Pa, continuous mechanical ventilation is required to ensure adequate fresh air for the occupants (HM Government 2021b).
While the airtightness of the new-build homes is relatively well-understood, for the 22 million homes (88%) in the UK built before 2006 it remains relatively unknown. Field trials suggest air leakage varies substantially, between < 1 and 30 m3/(m2.h) at 50 Pa, depending on house archetype, condition and according to the existence of specific construction details (Glew et al. 2024a; Stephen 2000). The amount of air leakage taking place in a home depends on specific internal and external environmental conditions, such as pressure differences, wind and the stack effect, etc. (Zheng et al. 2020). The pressurised conditions (e.g. 25–75 Pa) caused by the FPT disrupts these processes, though relatively little research has been undertaken to explore the specific uncertainties this causes or to query the conventions for converting the FPT result to non-pressurised conditions (Patel et al. 2011). Comparisons of the FPT with alternative airtightness testing methods such as tracer gas decay (Pasos et al. 2020; Patel et al. 2011) and low pressure testing (Glew et al. 2024b) have been inconclusive, although since these tests adopt different approaches, direct comparisons are challenging.
1.2 Inter-dwelling air exchange
The FPT value is generally interpreted as representing the amount of air movement between the inside and outside of the dwelling. However, in attached dwellings during the elevated FPT pressures, air also has the potential to move between neighbouring dwellings, i.e. inter-dwelling air exchange. The artificial pressure gradient induced by the FPT is the driving process of inter-dwelling air exchange, and so while it is possible for inter-dwelling air exchange to occur during normal (non-test) conditions, this would be trivially small.
To measure the inter-dwelling air exchange taking place during the FPT, a co-pressurisation test, sometimes called a pressure-equalisation, balanced-fan depressurisation or pressure-neutralisation test, can be undertaken (Parker et al. 2019; Uneo & Lstiburek 2015). First deployed in the US in the 1980s (Reardon et al. 1987), its use is very limited. In co-pressurisation tests, attached dwellings are pressurised to the same level, thereby removing the mechanism driving inter-dwelling air exchanges. Air leakage measured by a co-pressurisation test can therefore be considered as the actual volume air leakage between the inside and outside. The existence of inter-dwelling air exchanges during the FPT suggests that the results for terraced or semi-detached homes may be overestimates, since this air movement will not take place under normal (non-test) conditions. This has implications for the use of the FPT in energy models and informing energy efficiency and ventilation thresholds in building regulations.
Case studies using co-pressurisation tests are limited and the extent of inter-dwelling air exchange taking place has been observed to vary substantially. Measurements in no-fines concrete semi-detached homes in Ireland suggested inter-dwelling air exchanges could be around 30% of the FPT value (Parker et al. 2019). However, since no-fines concrete is a non-standard construction (i.e. fine aggregate such as sand is excluded), it may not be representative of more traditional constructions. In the US, one study using co-pressurisation tests in multi-unit residential buildings identified up to 60% of the FPT value was inter-dwelling (inter-zonal) air exchange (Modera et al. 1986). However, another study in two- and four-storey test houses found inter-dwelling air exchange to be 17% and 18%, respectively (Reardon et al. 1987). A similar method to co-pressurisation, the selective pressure neutralisation, was used to equalise pressures across corridor-suite boundaries to improve the accuracy of airtightness tests in individual apartments, and this found that nearly one-third of all leakage was inter-dwelling (Fine et al. 2021).
As might be expected, the extent of inter-dwelling air exchange taking place can be affected by the number of adjoining neighbours. A study in three-storey terrace dwellings found inter-dwelling air exchanges were up to 12% for end-of-terrace homes and up to 20% for mid-terrace homes (Uneo & Lstiburek 2015). Retrofits can also affect the extent of inter-dwelling air exchange taking place. Measurements pre and post a retrofit of a multi-unit residential buildings, which successfully reduced inside-to-outside air leakage, resulted in an increase in the proportional amount of inter-dwelling air exchange taking place from 24% to 34% (Ricketts & Finch 2013; Ricketts & Straube 2014).
1.3 Air leakage in energy models
Co-pressurisation tests are resource intensive, meaning relatively few have been undertaken previously (Lozinsky & Touchie 2020), though some studies have incorporated inter-dwelling air exchange within energy modelling and highlighted that it can have an impact on predicted heat loads and should be considered within building regulations (Diamond et al. 1986; Feustel & Sherman 1989; Herrlin & Modera 1988; Jones et al. 2013). Measured airtightness values are important model inputs for building energy models (Ji et al. 2019; Možina et al. 2024; Raftery et al. 2011), and modellers commonly use FPT to calibrate models to improve their accuracy (Coakley et al. 2014; Heo et al. 2012; Sousa et al. 2017). This is especially important for dwellings with high levels of air permeability, where heat loss via air leakage can be greater than that lost through external walls (Tsang et al. 2024). Using the co-pressurisation rather than the FPT result has also been shown to have a significant impact for evaluating fabric retrofit success, in one instance increasing payback estimates by approximately 10 years (Parker et al. 2019).
2. Method
In this paper, 37 FPT and co-pressurisation tests in were undertaken in 22 UK case study dwellings between 2012 and 2024. Guidance from successive versions of ATTMA TSL1 (ATTMA 2016) was followed when performing FPT, now superseded by CIBSE TM23 (Godefroy 2022), though no significant changes in the protocol occurred over this time. The equipment used were TEC Minneapolis apparatus, including BD3 or BD4 fans and Ductblaster mini-fans, depending on the size and anticipated airtightness of the test building. Measurements were taken with DG-700 or DG-1000 digital pressure gauges. Before testing, external openings were closed; purpose-provided ventilation, such as trickle vents and wall vents, were closed where possible or sealed with low-tac sealing film. As the effect of neutralising the party wall was undertaken under pressurisation conditions, only pressurisation FPT results were used for comparison, rather than the mean of pressurisation and depressurisation. Multiple measurements were taken at a range of internal to external pressure differentials over a minimum range of 30–70 Pa to derive the conventional 50 Pa datum point.
The co-pressurisation tests were undertaken using the same guidance as the single-building FPTs, with the exception that the pressure across a party wall was neutralised by using additional a fan-pressurisation apparatus simultaneously in the adjoining building. Operators maintained communication and matched the internal–external pressure differential for each building using 1-s average readings; a synchronised 10-s average reading was then started ensuing reads matched to within ±1 Pa. Co-pressurisation was often undertaken under pressurisation only as the simultaneous depressurisation of adjoined buildings was found to be too sensitive to environmental conditions. In some instances, a full co-pressurisation test was not possible due to time constraints or inconvenience to occupants of the adjoining dwelling, and in these instances several spot 50 Pa co-pressurisation tests were undertaken, with an average of the readings used as the co-pressurisation result. Where homes had multiple neighbours, all adjoining homes were co-pressurised where possible. Where this was not possible due to access or resource limitations, the co-pressurisation test took place across only one party wall, meaning only a partial reduction in inter-dwelling air exchanges was achieved. Images of the co-pressurisation tests in operation are shown in Figure 1.
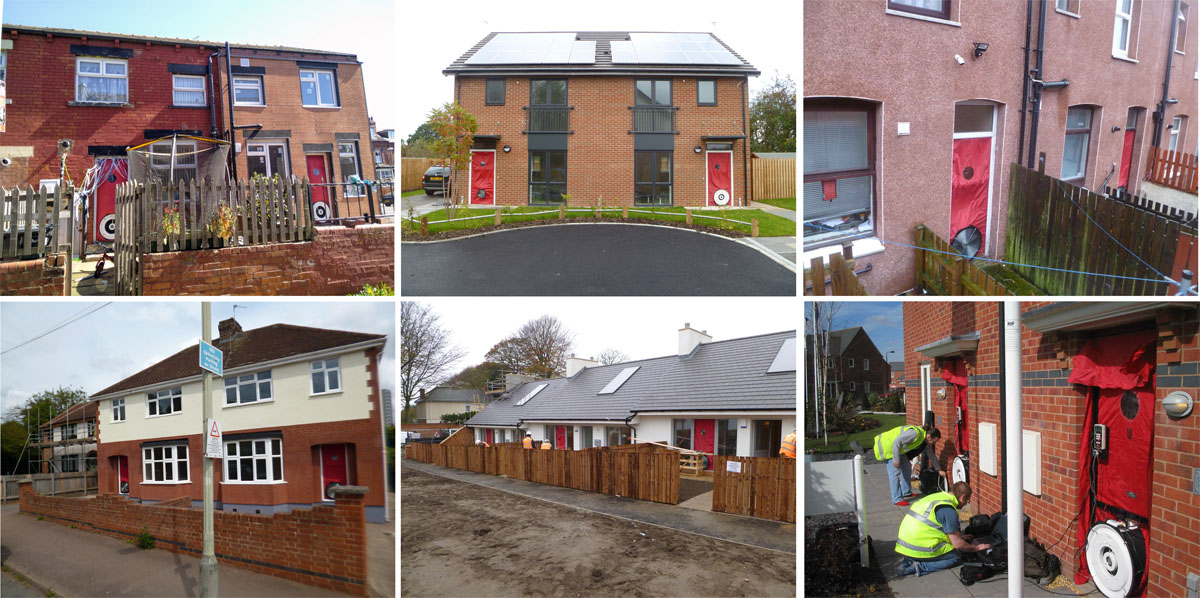
Figure 1
Co-pressurisation tests being undertaken in the case study homes.
Energy models of 11 of these case study homes were created using the Building Research Establishment Domestic Energy Model (BREDEM): the calculation method that underpins SAP, which is used to calculate a dwelling’s EPC rating in the UK. The model predictions of RdSAP’s energy efficiency rating (EER), annual energy, carbon and fuel bills for each home were compared when the infiltration rate selected was (1) the default values defined in the RdSAP methodology (BRE 2023), (2) the FPT value and (3) the co-pressurisation result.
3. Results
An overview of the case study homes shown in Table 1 identifies how many tests took place per home (i.e. pre- and post-retrofits), which homes had spot 50 compared with full co-pressurisation, when tests took place, the home type, and if homes were new or existing.
Table 1
Co-pressurisation case study homes.
| CASE STUDY ID | HOMES (n) | TESTS (n) | NEW HOME OR EXISTING | HOME TYPE | CO-PRESSURISATION METHOD | PERIOD |
|---|---|---|---|---|---|---|
| A1–A10.2 | 10 | 24 | Existing | House | Spot 50 | 2019–23 |
| B1.1–B1.2 | 1 | 2 | New | House | Full | 2022–23 |
| C1–C2 | 2 | 2 | New | Bungalow | Full | 2012–13 |
| D1–D3 | 3 | 3 | New | House | Spot 50 | 2024 |
| E1–E2 | 2 | 2 | New | House | Full | 2012–13 |
| F1.1–F1.2 | 1 | 2 | Existing | House | Spot 50 | 2019 |
| G1–G2 | 2 | 2 | Existing | House | Full | 2024 |
| Total | 21 | 37 |
While these case studies represent the largest catalogue of co-pressurisation testing to have been compiled, it is still a relatively small sample and not representative of UK housing generally, and adds to the range of construction types in which co-pressurisation tests have previously been undertaken. Further, since it includes multiple results for the same building (pre- and post-retrofit) meaning there may be a bias towards the specific characteristics of these case study homes, limiting the potential to make generalisations from the data.
Table 2 and the observed trends seen in Figures 2 and 3 show that co-pressurisation results are always lower than FPT results (i.e. above the X = Y line), confirming the presence of inter-dwelling air exchange in all cases. The results also suggest that homes with more air leakage generally may also experience more inter-dwelling air exchange during FPT. Statistical analysis suggested that the scale of the inter-dwelling air exchange did not seem to be affected by the homes’ party wall area, number of stories or floor type. Tests on a greater range of case study homes are needed to explore the observed trends further. Table 3 identifies a mean difference of 2.2 m3/(m2.h) at 50 Pa (21%) between the co-pressurisation and FPT. This ranged between 0.3 and 4.2 m3/(m2.h) at 50 Pa, and proportionally between 9% and 51%. However, proportional differences can be slightly misleading since the most airtight homes have among the lowest absolute differences but also the highest proportional difference, e.g. home E1 was Passivhaus certified and although it had the lowest infiltration rate (0.45 m3/(m2.h) at 50 Pa), and the second lowest difference between the co-pressurisation and FPT (0.45 m3/(m2.h) at 50 Pa), it also had the largest proportional difference (51%). The range excluding the two Passivhaus homes in the sample (E1 and E2) was between 0.9 and 4.2 m3/(m2.h) at 50 Pa with proportional differences of 9% and 37%, respectively.
Table 2
Airtightness results for case study homes.
| CASE STUDY | CO-PRESSURISATION (m3/(m2.h) at 50 Pa) | PRESSURISATION (m3/(m2.h) at 50 Pa) | DIFFERENCE (%) | PARTY WALLS (n) | PARTY WALLS NEUTRALISED (n) | PARTY WALL CONSTRUCTIONa |
|---|---|---|---|---|---|---|
| A1.1 | 11.66 | 13.17 | 11% | 2 | 1 | Solid brick |
| A1.2 | 8.89 | 9.77 | 9% | 2 | 1 | Solid brick |
| A2.1 | 10.96 | 14.89 | 26% | 2 | 1 | Solid brick |
| A2.2 | 11.52 | 15.10 | 24% | 2 | 1 | Solid brick |
| A2.3 | 11.24 | 14.23 | 21% | 2 | 1 | Solid brick |
| A2.4 | 9.97 | 13.29 | 25% | 2 | 1 | Solid brick |
| A2.5 | 10.69 | 13.63 | 22% | 2 | 1 | Solid brick |
| A2.6 | 8.51 | 9.74 | 13% | 2 | 1 | Solid brick |
| A3.1 | 10.68 | 14.87 | 28% | 2 | 1 | Solid brick |
| A3.2 | 11.22 | 15.04 | 25% | 2 | 1 | Solid brick |
| A3.3 | 10.13 | 13.40 | 24% | 2 | 1 | Solid brick |
| A3.4 | 10.75 | 13.96 | 23% | 2 | 1 | Solid brick |
| A3.5 | 7.81 | 8.78 | 11% | 2 | 1 | Solid brick |
| A4 | 10.80 | 13.59 | 21% | 1 | 1 | Solid brick |
| A5 | 6.89 | 8.34 | 17% | 1 | 1 | No fines concrete |
| A6.1 | 11.87 | 14.61 | 19% | 1 | 1 | Solid brick |
| A6.2 | 12.02 | 13.24 | 9% | 1 | 1 | Solid brick |
| A7 | 13.52 | 15.72 | 14% | 1 | 1 | Block and Steel |
| A8.1 | 10.15 | 13.82 | 27% | 1 | 1 | Solid brick |
| A8.2 | 6.49 | 8.62 | 25% | 1 | 1 | Solid brick |
| A8.3 | 5.58 | 7.95 | 30% | 1 | 1 | Solid brick |
| A9 | 7.52 | 8.99 | 16% | 1 | 1 | Solid brick |
| A10.1 | 10.02 | 12.03 | 17% | 1 | 1 | Solid brick |
| A10.2 | 5.87 | 8.29 | 29% | 1 | 1 | Solid brick |
| B1.1 | 9.52 | 12.52 | 24% | 1 | 1 | Solid brick |
| B1.2 | 8.13 | 11.76 | 31% | 1 | 1 | Solid brick |
| C1 | 5.10 | 7.91 | 36% | 1 | 1 | Cavity blockb |
| C2 | 4.92 | 7.78 | 37% | 1 | 1 | Cavity blockb |
| D1 | 7.78 | 8.64 | 10% | 1 | 1 | Cavity block (insulated)b |
| D2 | 4.49 | 4.82 | 7% | 1 | 1 | Cavity block (insulated)b |
| D3 | 5.23 | 5.86 | 11% | 1 | 1 | Cavity block (insulated)b |
| E1 | 0.45 | 0.92 | 51% | 2 | 2 | Cavity timber (insulated)b |
| E2 | 0.61 | 0.91 | 33% | 2 | 2 | Cavity timber (insulated)b |
| F1.1 | 12.45 | 16.6 | 25% | 1 | 1 | No fines concrete |
| F1.2 | 11.1 | 14.8 | 25% | 1 | 1 | No fines concrete |
| G1 | 18.06 | 21.6 | 16% | 1 | 1 | Cavity block |
| G2 | 16.51 | 18.71 | 12% | 1 | 1 | Cavity block |
[i] Note: aNo party wall insulation or cavity sealing unless stated.
bAssumed sealed cavity.
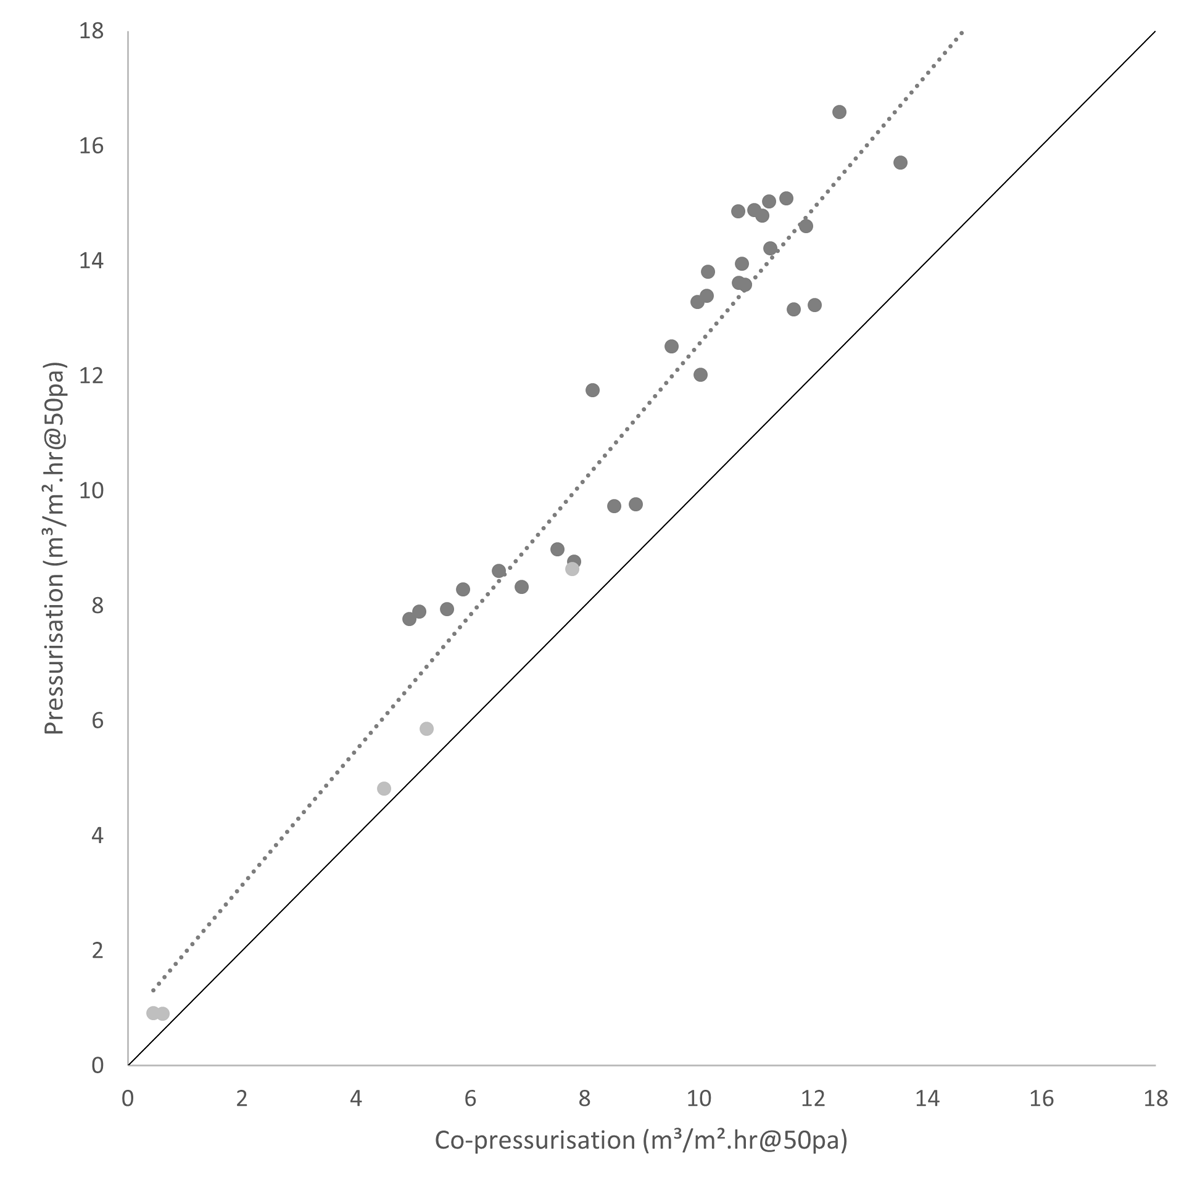
Figure 2
Comparison of the pressurisation and co-pressurisation tests results.
Note: Light grey = new build; dark grey = existing homes. The black line represents X = Y.
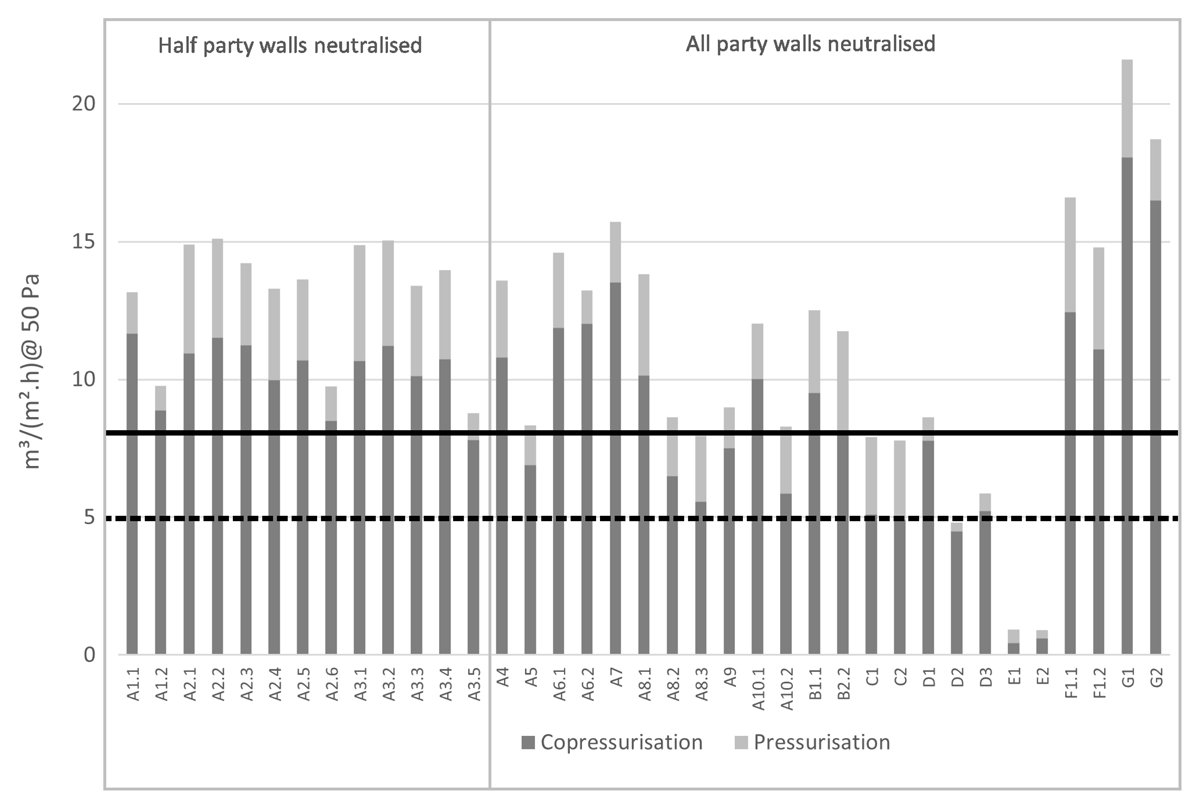
Figure 3
Comparison of the co-pressurisation and pressurisation results.
Note: Black line = maximum allowable airtightness value for new-build home England and Wales Building Regulations compliance; and dashed line = threshold under which constant mechanical ventilation is required.
Table 3
Summary of the mean co-pressurisation and individual dwelling pressurisation tests.
| TESTS (n) | CO-PRESSURISATION (m3/(m2.h) AT 50 Pa) | PRESSURISATION (m3/(m2.h) AT 50 Pa) | DIFFERENCE (m3/(m2.h) AT 50 Pa) | DIFFERENCE (%) | |
|---|---|---|---|---|---|
| All tests | 37 | 8.56 | 10.78 | 2.21 | 21% |
| All homes (excluding retrofitted stages) | 21 | 9.01 | 11.25 | 2.24 | 22% |
| All party walls neutralised | 13 | 7.78 | 9.75 | 1.97 | 21% |
| One of two party walls neutralised | 28 | 10.31 | 13.07 | 2.76 | 20% |
Table 2 presents the results for eight homes with pre- and often multiple post-retrofit stages described via the case study code (1.1 = pre-retrofit, 1.2 = first retrofit, 1.3 = second retrofit, etc.). Retrofits affect the fabric performance and often, therefore, air leakage in homes, and so the result for each new retrofit has been included. However, the pre- and post-retrofit home may have underlying similarities in air leakage pathways, which the retrofits have not affected. Table 3 therefore explores the impact of excluding the post-retrofit results from the analysis. More data are required to explore the impact of retrofits on inter-dwelling air leakage taking place during the FPT.
Co-pressurisation results for homes where all party walls were neutralised had results that were 21% lower than the FPT. A negligible difference was observed for homes with only one of two party walls neutralised (20% lower), and when the post-retrofit test results are excluded from the sample (22% lower). Further investigation is needed to explore inter-dwelling air exchanges in homes with differing levels of air permeability, construction types, differing levels of fabric insulation (retrofit), as well as the impact of multiple party walls, and of neutralising some or all of these during co-pressurisation tests.
Figure 3 illustrates that the co-pressurisation test always yields a lower value than the FPT, but that this varies significantly, with a range between 5% and 51% in the case study homes (5–37% lower excluding Passivhaus homes), depending on specific construction and the condition of the home and party walls, and the test conditions and number of party walls neutralised.
Also plotted on Figure 3 for reference is the England and Wales Building Regulations threshold value below which homes must have some form of constant mechanical ventilation to provide sufficient fresh air for occupants and the allowable airtightness threshold for new-build homes to minimise heat loss. When the co-pressurisation result is used in place of the FPT, air leakage reduces, and many of the homes fall close to the mechanical ventilation threshold (A8.3, C1, C2, D1 and D3). This is significant when considering the assumed 10% accuracy of the FPT, and this highlights the potential risks of underventilation in homes if the FPT is used to inform when continuous mechanical ventilation is required. Similarly, some homes (A3.5, A5, A8.2, A9, A10.2 and D1) drop below the compliance threshold for maximum allowable infiltration rate, i.e. using the co-pressurisation test for Building Regulation compliance is a lower risk approach to assessing the need for mechanical ventilation and could result in improved air quality in new homes. The use of thresholds is therefore problematic where inter-dwelling air exchange is not considered.
Figure 4 shows that there may be less absolute inter-dwelling air exchange taking place in cavity-walled homes than solid-walled homes, though the proportional difference may be similar. This is intuitive since cavity party walls are associated with new-build homes, which were built to comply with minimum airtightness standards in modern building regulations, though a larger sample is needed to explore this point. Moreover, the research suggests that any house type may be subject to inter-dwelling air exchange during FPT, i.e. sealed insulated cavity party walls may not always be completely effective, and air pathways other than the party wall exist between the homes, for instance, via ground floor voids and loft spaces.
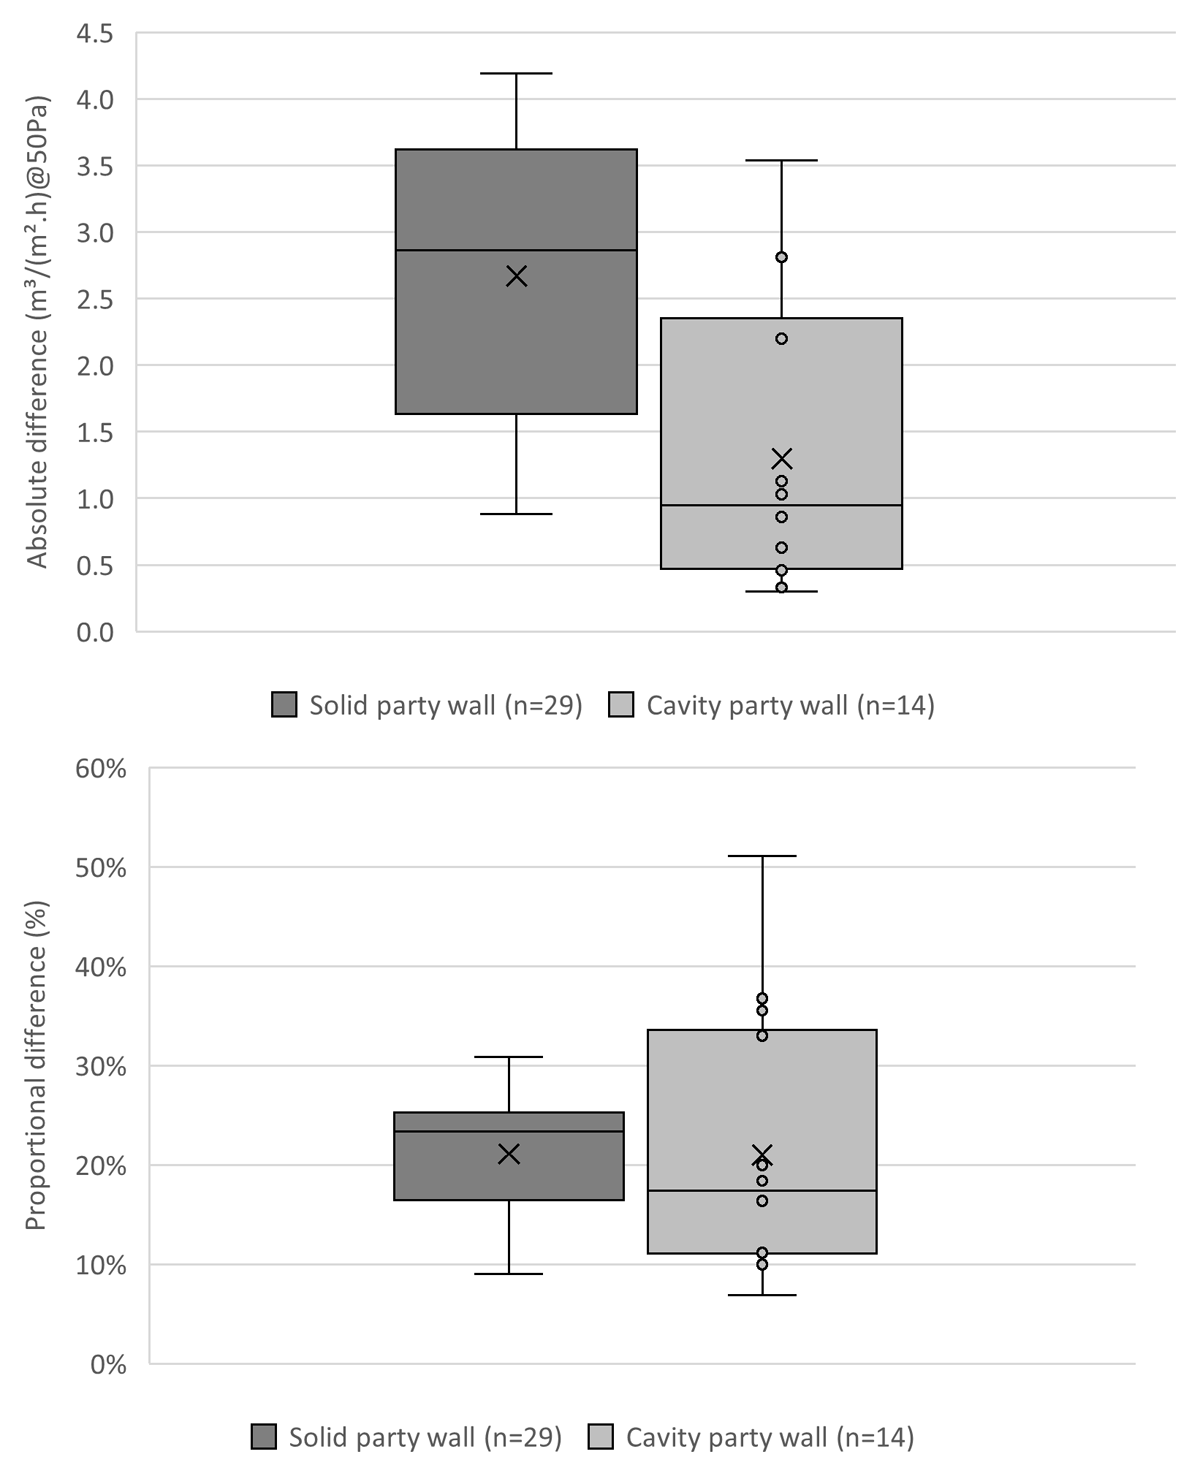
Figure 4
Comparison of inter-dwelling air exchange taking place during the fan pressurisation test in solid and cavity party walls.
No significant difference was found in the amount of inter-dwelling air exchanges recorded between the results of a spot 50 Pa or a full co-pressurisation test. More investigation of the different co-pressurisation methodologies is needed to explore this point; however, given the practical difficulties associated with performing a full co-pressurisation test, if spot 50 Pa tests are found to be robust, it may be beneficial in encouraging more co-pressurisation field test data to be collected.
3.1 Modelling results
Three versions of a BREDEM model were made for 11 case study homes (A1–A10) in the sample at different retrofit stages (21 in total) to compare predictions of SAP score (EER), annual carbon, space heating demand and fuel bills, when using (1) the default airtightness values assumed by the RdSAP, (2) the airtightness value measured by the FPT and (3) the co-pressurisation test result.
Table 4 shows the FPT and co-pressurisation results compared with the default air leakage rate assumed in the model. This identifies that there was a substantial variation between the default and measured air leakage values measured, with the FPT and co-pressurisation tests being on average 18% and 34%, respectively, lower than the default. This is significant since it indicates that EPCs, and other models which do not account for inter-dwelling air leakage taking place during the FPT, are overestimating air leakage for these homes.
Table 4
Comparison of the airtightness values derived from the Reduced Standard Assessment Procedure (RdSAP) defaults, fan pressurisation and co-pressurisation tests.
| CASE STUDY | DEFAULT RDSAP AIR LEAKAGE (m3/(m2.h) AT 50 Pa) | PRESSURISATION (m3/(m2.h) AT 50 Pa) | CO-PRESSURISATION (m3/(m2.h) AT 50 Pa) |
|---|---|---|---|
| A1.1 | 17.9 | 13.2 | 11.7 |
| A1.2 | 14.9 | 9.8 | 8.9 |
| A2.1 | 17.9 | 14.9 | 11.0 |
| A2.2 | 15.1 | 15.1 | 11.5 |
| A2.3 | 15.1 | 14.2 | 11.2 |
| A2.4 | 15.1 | 13.3 | 10.0 |
| A2.6 | 15.1 | 9.7 | 8.5 |
| A3.1 | 17.9 | 14.9 | 10.7 |
| A3.2 | 15.1 | 15.0 | 11.2 |
| A3.4 | 15.1 | 14.0 | 10.8 |
| A3.5 | 15.1 | 8.8 | 7.8 |
| A4 | 16.0 | 13.6 | 10.8 |
| A5 | 11.0 | 8.3 | 6.9 |
| A6.1 | 17.9 | 14.6 | 11.9 |
| A6.2 | 14.9 | 13.2 | 12.0 |
| A7 | 15.6 | 15.7 | 13.5 |
| A8.1 | 15.7 | 13.8 | 10.2 |
| A8.2 | 12.9 | 8.6 | 8.0 |
| A9 | 10.9 | 9.0 | 7.5 |
| A10.1 | 15.9 | 12.0 | 10.0 |
| A10.2 | 13.9 | 8.3 | 5.9 |
| Mean | 15.2 | 12.4 | 10.0 |
| Difference from the default value (%) | – | 18% | 34% |
Figure 5 shows that replacing the default values with the FPT and co-pressurisation reduced the homes’ predicted carbon emissions by, on average, 2.9% and 4.9%, respectively; for heat demand, the reduction was 4.3% and 7.6% and for fuel bill this was 1.8% and 3.1%, respectively). These improvements are in the same order of magnitude as the savings observed from installing loft insulation or a new condensing boiler in homes (HM Government 2024). Further, these changes in the homes’ predicted energy efficiency were reflected in a small improvement in SAP score on average across the sample of 1.2% and 2.3% for the FPT and co-pressurisation values, respectively. However, small changes to scores can have large significance for homes at EPC band thresholds; specifically, using the co-pressurisation result rather than the FPT result could see homes move up a band. This occurred in two of the case study homes: A1.1 moved from band D to C, and A6.1 moved from band E to D. Table 5 highlights that using values derived by the co-pressurisation test has a larger impact on modelled predictions for fuel bills, carbon emissions and space heating requirement than using outputs from FPT by 1%, 2% and 3%, respectively.
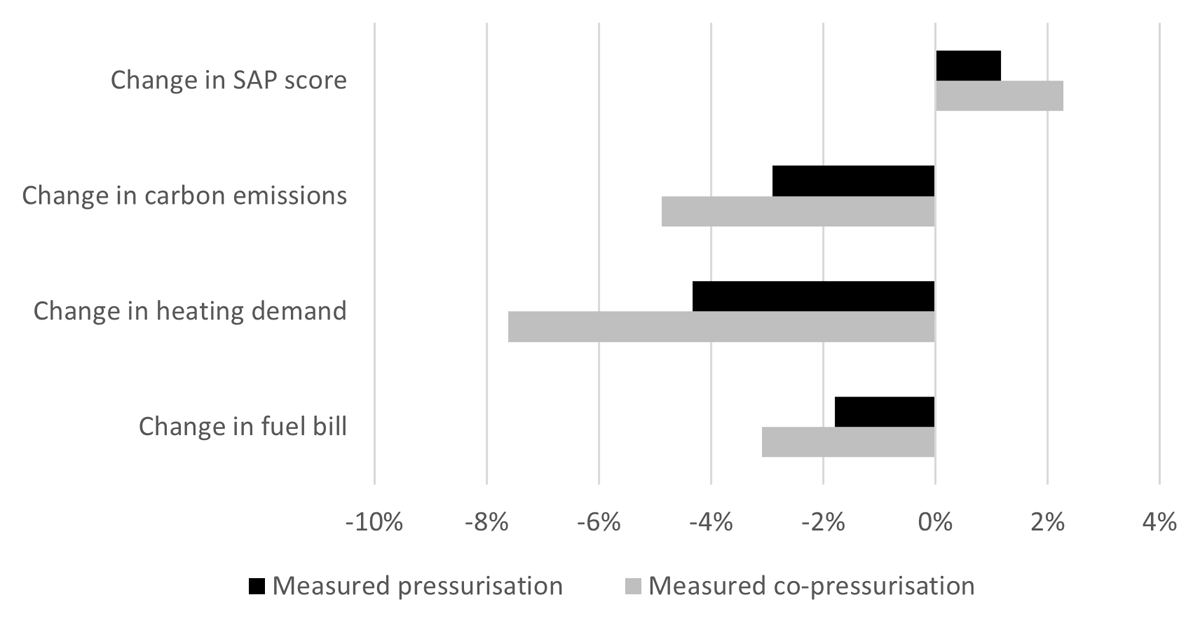
Figure 5
Impact on space heating requirement, annual fuel bills, carbon emissions and Standard Assessment Procedure (SAP) score of replacing default airtightness values used in Energy Performance Certificates (EPCs), with values derived from standard fan pressurisation and co-pressurisation tests.
Table 5
Difference between the modelled outputs when using different airtightness values.
| DEFAULT VALUE | PRESSURISATION VALUE | CO-PRESSURISATION VALUE | DIFFERENCE BETWEEN FPT AND CO-PRESSURISATION (%) | |
|---|---|---|---|---|
| SAP score | 69.7 | 70.5 | 71.3 | 1% |
| Annual fuel bills | £1,123 | £1,103 | £1,088 | 1% |
| Carbon emissions (kg CO2/year) | 4,027 | 3,910 | 3,831 | 2% |
| Space heating (kWh/m2/year) | 123 | 118 | 113 | 3% |
[i] Note: FPT = fan pressurisation tests; SAP = Standard Assessment Procedure.
4. Discussion
These results suggest that the FPT routinely incorporates inter-dwelling air movement in its measured value due to the elevated pressures the test creates. Since this bulk inter-dwelling air movement is not likely to occur under normal pressures experienced outside of tests, this means that the FPT result can overstate inside-to-outside air leakage in attached homes. This overestimation could be significant (21% in this sample), though a larger sample is required to explore how this may vary in homes of different form, construction and condition. This has implications for the use of the FPT to inform building regulations compliance for energy efficiency (i.e. attached homes may be more energy efficient than predicted) and ventilation strategies (i.e. attached homes may be more at risk of underventilation), and more research is needed to explore this topic.
The research suggests that default airtightness values used in generating EPCs in the UK may be overestimating air leakage taking place in some existing homes values. Having the function to incorporate a measured airtightness value may improve the accuracy of models. Further, since the FPT may be an overestimate of inside-to-outside air leakage in a home, model accuracy could be further improved if the co-pressurisation value is used. This can give an uplift in a home’s SAP score and, in some instances, result in being awarded a higher EPC band. This is important since EPC bands have multiple uses in UK government policy for identifying eligibility for retrofit support, target energy efficiency levels and defining fuel poverty, and a lack of trust in the accuracy of EPCs can undermine their use (Few et al. 2023). Additionally, since energy ratings affect sale and rental values (as well as landlords now only allowed to rent properties with an EPC rating of C or above), this finding could have financial implications for homeowners, although the extent to which EPCs affect house prices is not well understood (Marmolejo-Duarte & Chen 2022; Olaussen et al. 2017). Overpredicting the air leakage in a home could also contribute to the prebound effect, i.e. energy consumption and fuel bill savings achieved through retrofitting homes may be less than they were predicted to be, which has implications for retrofit finance models and payback rates (Galvin & Sunikka-Blank 2016; Parker et al. 2019).
The research highlights a problem with using thresholds for compliance purposes where there is uncertainty around the airtightness values. Inter-dwelling air exchanges could result in ventilation strategies being incorrectly designed in attached homes, potentially leading to under-ventilation. For instance, using the co-pressurisation values to assess compliance could mean homes that have FPT values marginally above the mechanical ventilation threshold may drop below the threshold. Even if some inter-dwelling air does take place under non-test conditions, this air cannot be considered fresh. This also has implications for air quality, damp and moisture management in the homes and, given the tendency for the airtightness of new-build homes to cluster just above ventilation-compliance thresholds, this problem may be relatively widespread (Love et al. 2017).
More co-pressurisation tests on a greater number of homes with a greater variety of constructions, ages, party wall configurations, ground floor types, etc., and in other countries, are needed to approximate the scale of inter-dwelling air exchange taking place when FPTs are performed. Undertaking co-pressurisation tests, especially in existing occupied homes, is resource intensive and complex and therefore there may need to be a trade-off between accuracy and practicality for testing. For instance, where FPT continues to be used without co-pressurisation, a safety margin could be added to airtightness energy efficiency and ventilation thresholds in the regulations for attached homes (not detached homes) to account for potential inter-dwelling air exchanges. For instance, in this paper, 21% of the air permeability reported by FPT was found to be inter-dwelling air exchange; thus, if natural ventilation is only permitted for homes > 5 m3/(m2.h) at 50 Pa, adding a safety margin could increase this to approximately 6 m3/(m2.h) at 50 Pa for attached homes and may reduce the risk of under-ventilation occurring.
Alternatively, future work may be able to identify a correction factor that could be applied to FPT results in attached homes depending on their building characteristics to account for an assumed amount of inter-dwelling air exchanges. This approach is already adopted in the form of a shelter factor currently used in SAP and RdSAP to correct the default air permeability values used, though the impact of the shelter factor on the model predictions is smaller than that identified for inter-dwelling air exchanges identified in this paper. More research would be needed to understand what an appropriate correction would be to apply to different house types.
Moreover, the use of co-pressurisation as a technique to measure inter-dwelling air exchange could be incorporated as optional or mandatory within FPT practice, protocols and policy. Greater exploration of spot 50 Pa compared with full co-pressurisation tests would be needed to investigate the robustness of the two approaches, though since the spot 50 test is quicker, this would reduce the burden on testing. If co-pressurisation is adopted, there may be a more appropriate metric to describe the co-pressurisation test results to reflect the air volume lost per area of non-neutralised envelope area, i.e. removal of the party wall from the measurements in the assessment. Further detailed assessments of air leakage through party walls and external elements are needed to develop such a metric. Low-pressure alternative tests may be less affected by inter-dwelling air exchanges than the FPT since they do not operate at elevated pressures; however, more research is required to explore this point.
Under normal (non-pressurised) conditions, some inter-dwelling air exchanges may take place, e.g. smells (and therefore air) travelling between adjoining properties are relatively common, though the extent of this air movement is unknown. More investigations are needed to understand this point, and any implications this has for air quality, acoustics and fire risks.
5. Conclusions
The results from 37 fan pressurisation tests (FPTs) and co-pressurisation tests found that around 21% of the air leakage reported by the FPT is inter-dwelling, not inside-to-outside air movement.
Default airtightness values assumed in energy models were found to be overpredicted, and using the FPT value resulted in reductions in average annual fuel bills (1.8%), carbon emissions (2.9%) and space heating requirements (4.8%) of the sample, and the addition of a Standard Assessment Procedure (SAP) point in their Energy Performance Certificate (EPC). Further, when co-pressurisation results are used instead of FPT to account for this inter-dwelling air exchange, the savings are even greater at 3.1%, 4.9% and 7.6%, respectively. Additionally, using co-pressurisation test values in place of FPTs result in homes being awarded on average a further SAP point. Since co-pressurisation tests are resource intensive, alternative approaches may be needed to measure or estimate this, for instance, using spot 50 tests, or applying correction factors in energy models or FPT protocols.
Not accounting for inter-dwelling air exchanges poses a risk of under-ventilation and misclassification of homes deemed suitable for natural ventilation. It may be possible to incorporate safety margins to ventilation compliance thresholds for attached homes to account for this.
While this research represents the largest sample of co-pressurisation tests undertaken, it is not possible to generalise from the findings. More co-pressurisation testing is needed in different types of home forms, constructions, conditions and building features, as well as homes built in other countries. However, it is important to note that all co-pressurisation tests that have been undertaken have always recorded some inter-dwelling air exchange taking place, highlighting the need for further investigation.
Author contributions
DG: conception; interpretation; data analysis; drafting; editing. FT: conception; data acquisition; data analysis; interpretation; drafting; editing. DMS: conception; data acquisition; data analysis; interpretation; drafting; editing. JP: conception; data acquisition; data analysis; drafting; editing.
Competing interests
The authors have no competing interests to declare. David Glew is an associate editor of Buildings and Cities, but had no role in the review and decision processes for this manuscript.
Data availability
The data are available from the corresponding author upon request.