
Table 1
Summary statistics from personal weather stations (PWS) and reference automatic weather stations (AWS).
| HELSINKI | ESPOO | VANTAA | TAMPERE | ||
|---|---|---|---|---|---|
| PWS count | |||||
| Within administrative boundaries | 202 | 137 | 75 | 78 | |
| Urban | 199 | 129 | 72 | 72 | |
| Peri-urban | 2 | 0 | 3 | 0 | |
| Rural | 1 | 8 | 0 | 6 | |
| Within buffera | 677 | 719 | 695 | 274 | |
| Urban | 509 | 517 | 517 | 136 | |
| Peri-urban | 118 | 119 | 119 | 24 | |
| Rural | 50 | 83 | 59 | 114 | |
| Average distance (nearest) (km) | Reference | 3.1 | 5.4 | 5.9 | 4.7 |
| PWS | 0.26 | 0.35 | 0.36 | 0.52 | |
| Seasons | |||||
| Winter daily average (°C) | Reference | –2.9 | –3.7 | ||
| Urban PWS | –1.7 | –2.0 | –2.4 | –3.5 | |
| Rural PWS | –2.8 | –2.7 | –3.0 | –3.8 | |
| Spring daily average (°C) | Reference | 4.9 | 4.9 | ||
| Urban PWS | 6.1 | 5.4 | 5.7 | 5.5 | |
| Rural PWS | 4.9 | 5.0 | 4.9 | 4.9 | |
| Summer daily average (°C) | Reference | 17.7 | 17.1 | ||
| Urban PWS | 18.9 | 18.6 | 18.6 | 17.9 | |
| Rural PWS | 17.8 | 17.8 | 17.8 | 17.3 | |
| Autumn daily average (°C) | Reference | 6.8 | 6.0 | ||
| Urban PWS | 7.9 | 7.5 | 7.1 | 6.3 | |
| Rural PWS | 6.8 | 6.9 | 6.6 | 5.9 | |
[i] Note: aDue to shared administrative borders, these contain overlapping PWS.
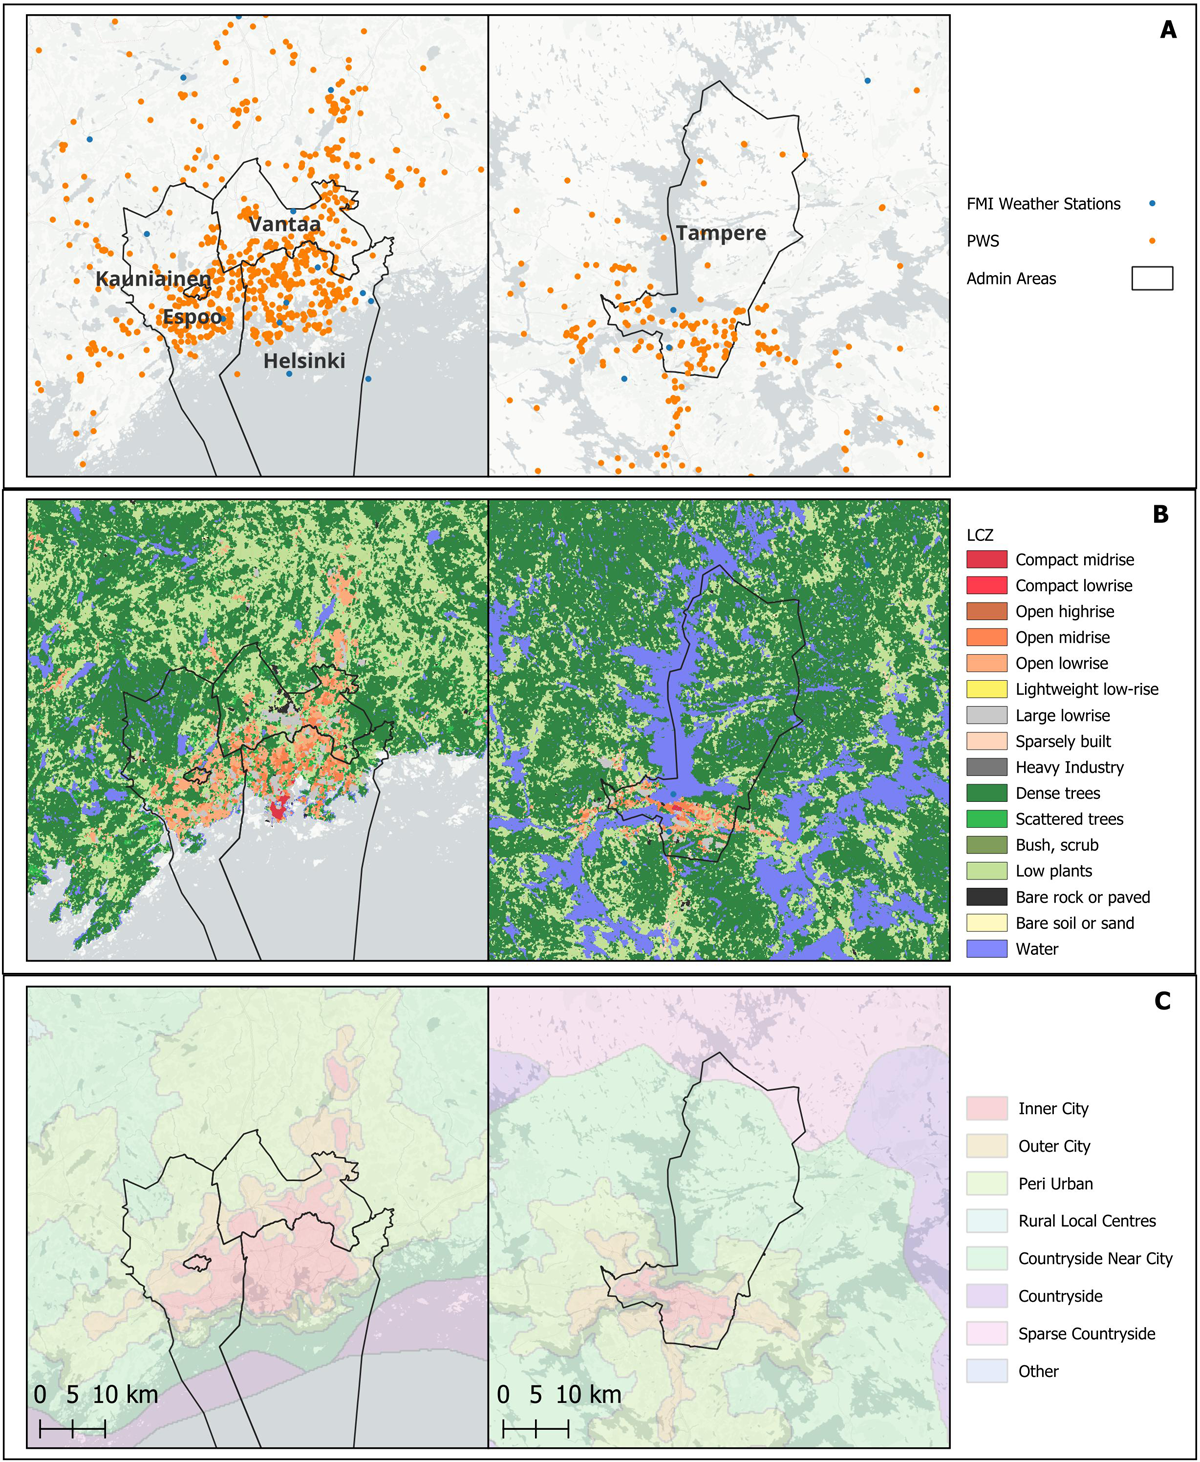
Figure 1
(a) Locations of personal weather stations (PWS) and official stations for the different study areas, as well as the administrative boundaries; (b) their local climate zone (LCZ) classifications; and (c) their urban–rural classifications.
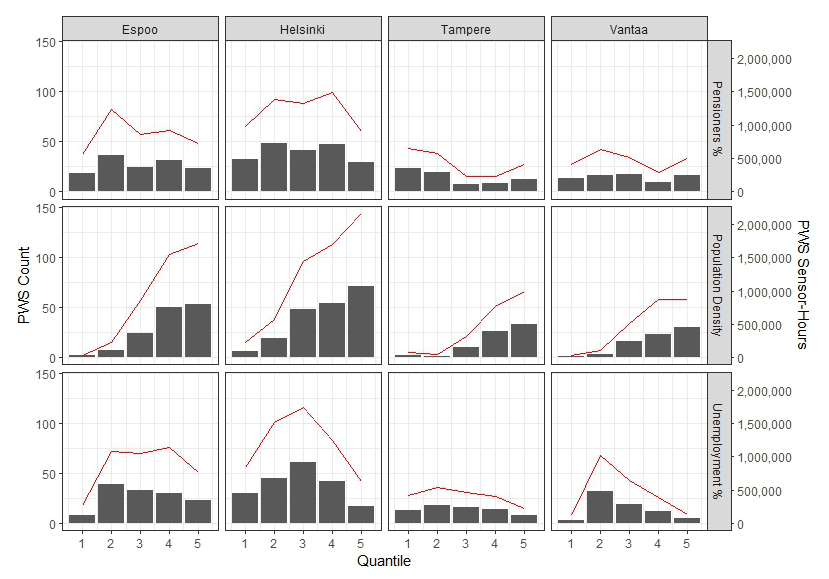
Figure 2
Counts of personal weather stations (PWS) by 250-m grid cell according to the percentage of pensioners in the population, population density and unemployment rates, where 1 is the lowest and 5 is the highest.
Note: Counts are shown in bars; sensor-hours are shown with a red line.
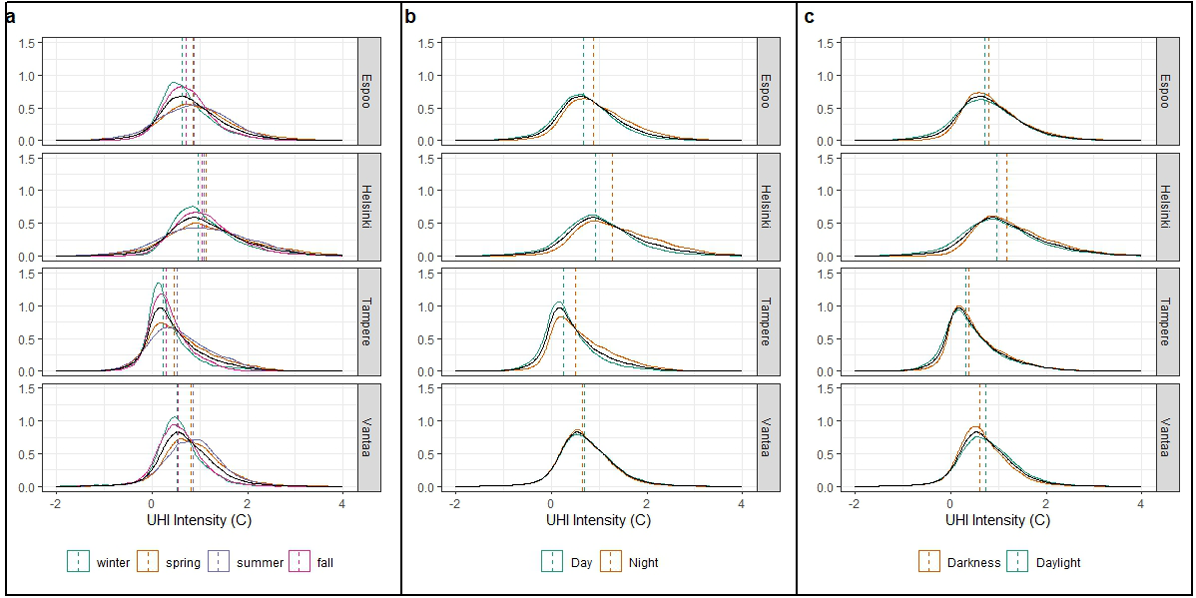
Figure 3
Density plots of the distributions of hourly urban heat island (UHI) intensity for (a) seasons; (b) day (07.00–20.00 hours) and night (21.00–06.00 hours); and (c) daylight or dark hours.
Note: Black lines show the density for all groups as a reference; vertical lines show the median for each distribution.
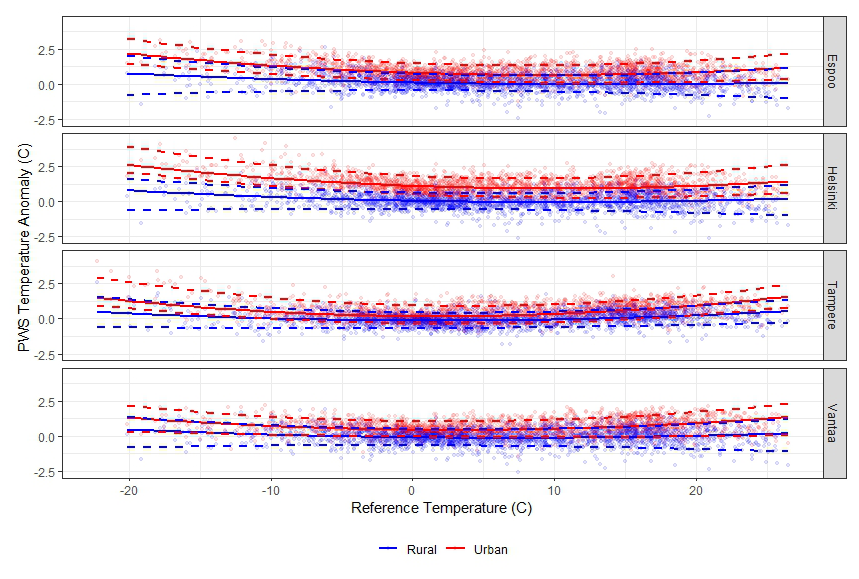
Figure 4
Variation of the daily average temperature anomalies (difference between personal weather station (PWS) temperature and reference daily average temperature) according to reference automatic weather station (AWS) temperature for urban and rural locations.
Note: Solid lines indicate the median anomaly; dashed lines show its 10th and 90th percentiles.
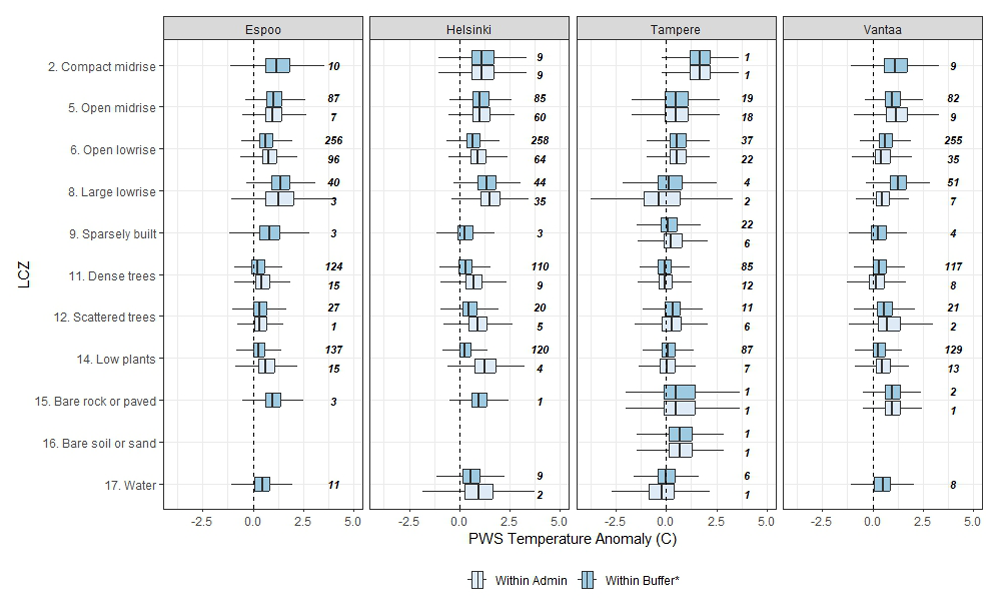
Figure 5
Personal weather station (PWS) temperature anomaly (average difference between the PWS temperatures and reference temperatures during a day) for each municipality and local climate zone (LCZ) present.
Note: Counts of PWS in each LCZ are also shown.
*Within buffers include overlapping PWS stations for Helsinki, Espoo and Vantaa.
Table 2
For reference stations and urban and rural personal weather stations (PWS), temperatures when daily average automatic weather stations (AWS) temperatures are above or below temperature percentiles, heating degree-days (HDD) and cooling degree-days (CDD).
| HELSINKI | ESPOO | VANTAA | TAMPERE | ||
|---|---|---|---|---|---|
| Above 90th percentile | |||||
| Average 24-h mean (°C) (count of days) | Reference | 20.8 (36) | 20.1 (39) | ||
| Urban PWS | 21.8 (51) | 21.6 (48) | 21.6 (46) | 21.0 (47) | |
| Rural PWS | 20.7 (38) | 20.7 (38) | 20.7 (37) | 20.2 (40) | |
| Average daytime maximum (°C) | Reference | 25.5 | 25.1 | ||
| Urban PWS | 27.0 | 26.9 | 27.5 | 26.4 | |
| Rural PWS | 25.9 | 25.8 | 25.8 | 25.9 | |
| Average night minimum (°C) | Reference | 15.1 | 13.9 | ||
| Urban PWS | 17.3 | 16.5 | 15.9 | 16.1 | |
| Rural PWS | 15.4 | 15.4 | 15.4 | 14.6 | |
| Days above 95th percentile | |||||
| Average 24-h mean (°C) (count of days) | Reference | 22.2 (21) | 21.7 (21) | ||
| Urban PWS | 23.3 (28) | 23.0 (25) | 23.1 (26) | 22.7 (29) | |
| Rural PWS | 22.1 (20) | 22.0 (21) | 22.0 (20) | 21.8 (22) | |
| Average daytime maximum (°C) | Reference | 27.0 | 27.0 | ||
| Urban PWS | 28.5 | 28.3 | 29.0 | 28.3 | |
| Rural PWS | 27.4 | 27.3 | 27.3 | 27.8 | |
| Average night minimum (°C) | Reference | 16.4 | 15.2 | ||
| Urban PWS | 18.6 | 17.7 | 17.2 | 17.6 | |
| Rural PWS | 16.6 | 16.6 | 16.6 | 15.9 | |
| Days below 10th percentile | |||||
| Average 24-h mean (°C) (count of days) | Reference | –9.4 (27) | –10.2 (28) | ||
| Urban PWS | –7.4 (18) | –7.9 (20) | –8.6 (24) | –9.4 (25) | |
| Rural PWS | –9.1 (27) | –9.0 (27) | –9.3 (28) | –10.1 (28) | |
| Average daytime maximum (°C) | Reference | –6.6 | –7.3 | ||
| Urban PWS | –4.9 | –5.2 | –5.8 | –6.9 | |
| Rural PWS | –6.4 | –6.3 | –6.6 | –7.3 | |
| Average night minimum (°C) | Reference | –13.0 | –13.8 | ||
| Urban PWS | –10.0 | –10.7 | –11.7 | –12.0 | |
| Rural PWS | –12.1 | –12.0 | –12.3 | –13.1 | |
| Days below 5th percentile | |||||
| Average 24-h mean (°C) (count of days) | Reference | –12.6 (12) | –13.9 (11) | ||
| Urban PWS | –10.3 (7) | –10.9 (8) | –11.8 (10) | –12.6 (9) | |
| Rural PWS | –12.1 (11) | –12.1 (10) | –12.4 (11) | –13.7 (11) | |
| Average daytime maximum (°C) | Reference | –9.5 | –9.9 | ||
| Urban PWS | –7.6 | –8.0 | –8.6 | –9.3 | |
| Rural PWS | –9.1 | –9.0 | –9.4 | –10.1 | |
| Average night minimum (°C) | Reference | –16.3 | –18.1 | ||
| Urban PWS | –12.9 | –13.7 | –14.9 | –15.6 | |
| Rural PWS | –15.3 | –15.3 | –15.5 | –17.2 | |
| Energy | |||||
| Annual average HDD | Urban PWS | 2,910 | 2,989 | 3,063 | 3,199 |
| Rural PWS | 3,191 | 3,183 | 3,229 | 3,311 | |
| Annual average CDD | Urban PWS | 156 | 140 | 141 | 123 |
| Rural PWS | 107 | 108 | 108 | 94 | |
[i] Note: Counts of the annual average number of days when thresholds are exceeded are also shown.
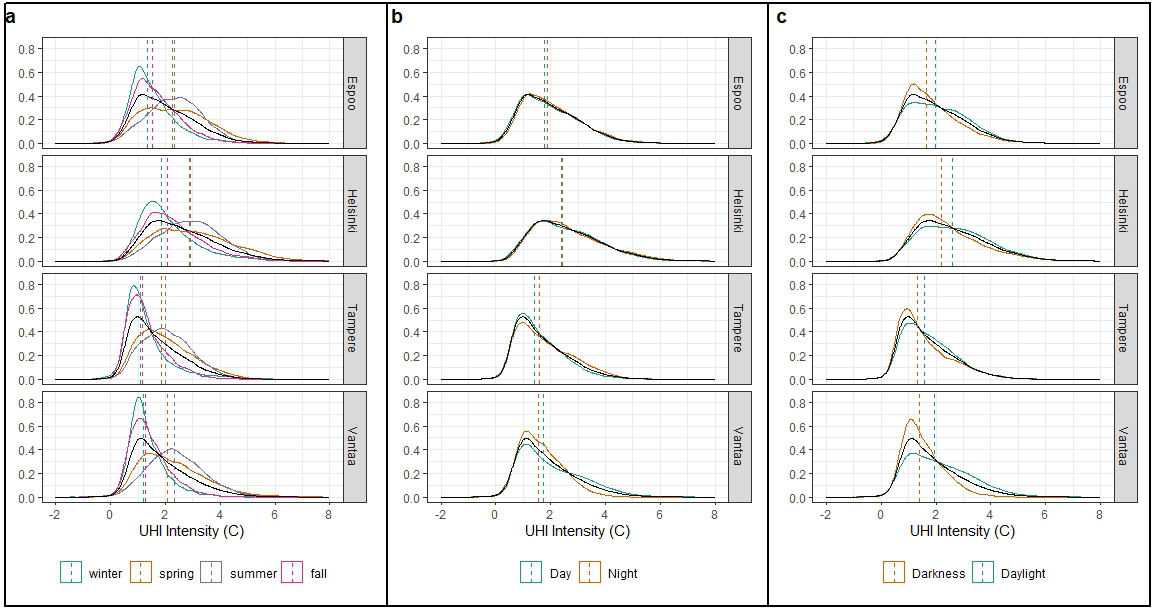
Figure S1
Density plots of the distributions of hourly urban heat island (UHI) intensity (90th percentile urban temperatures) for (a) seasons; (b) day (07.00–20.00 hours) and night (21.00–06.00 hours); and (c) daylight or dark hours.
Note: Black lines show the density for all groups as a reference; vertical lines show the median for each distribution.
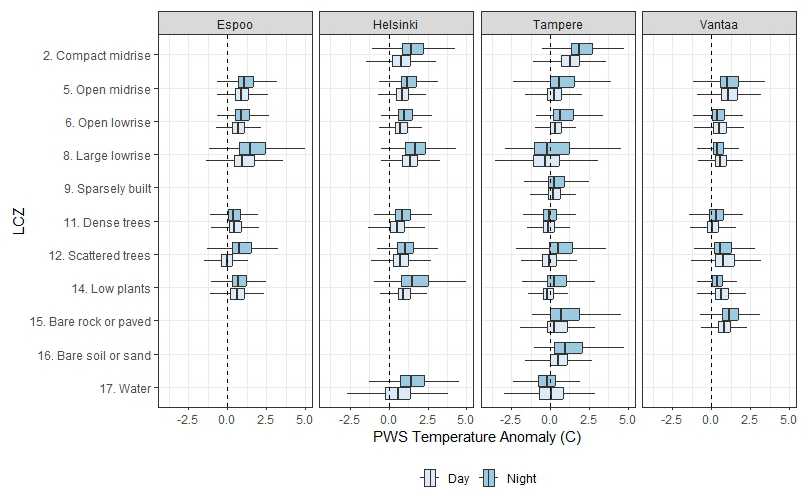
Figure S2
Personal weather station (PWS) temperature anomaly (average difference between daily PWS temperatures and reference temperatures) for each municipality and local climate zone (LCZ) present by day and night for PWS within administrative boundaries.
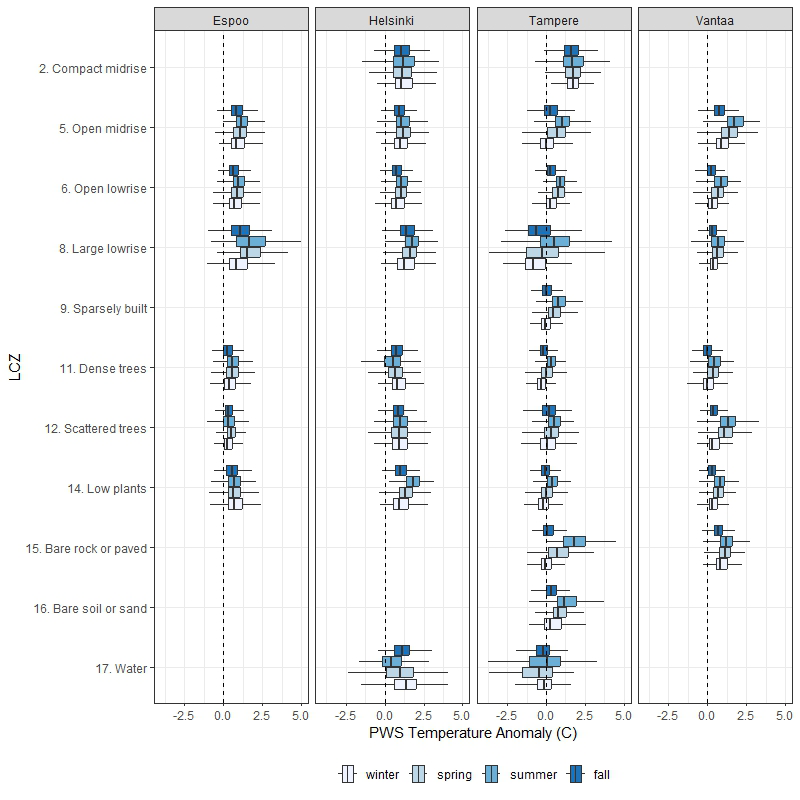
Figure S3
Personal weather station (PWS) temperature anomaly (average difference between daily PWS temperatures and reference temperatures) for each municipality and local climate zone (LCZ) present by day and night for PWS within administrative boundaries