
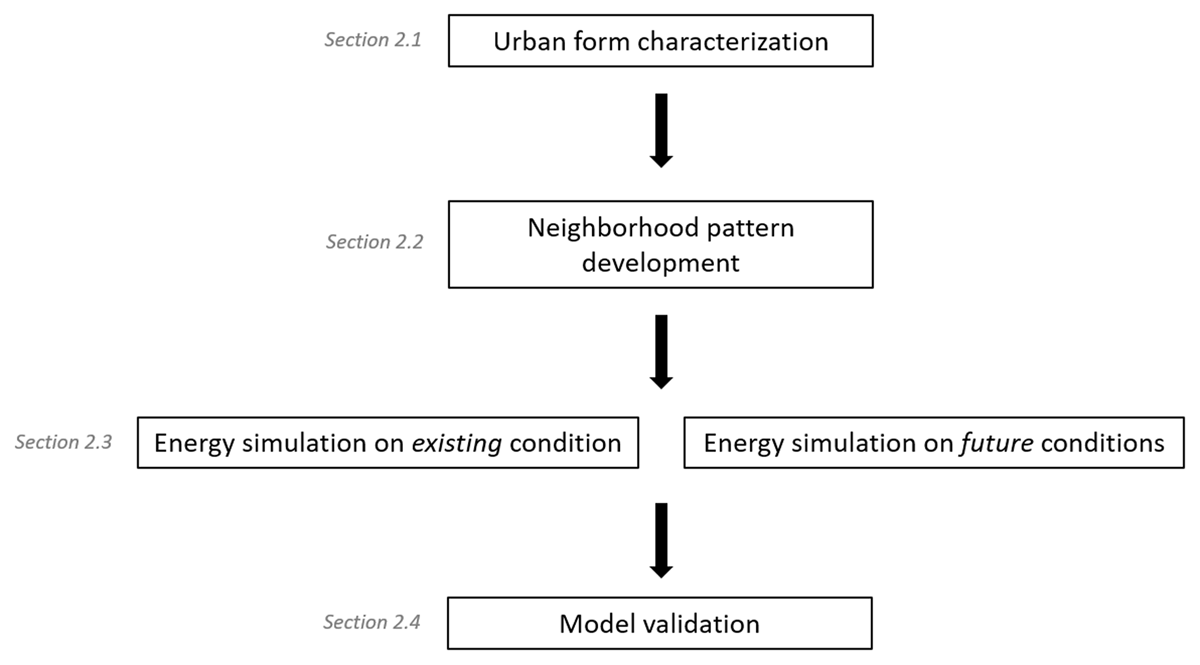
Figure 1
Key stages of the proposed methodology.
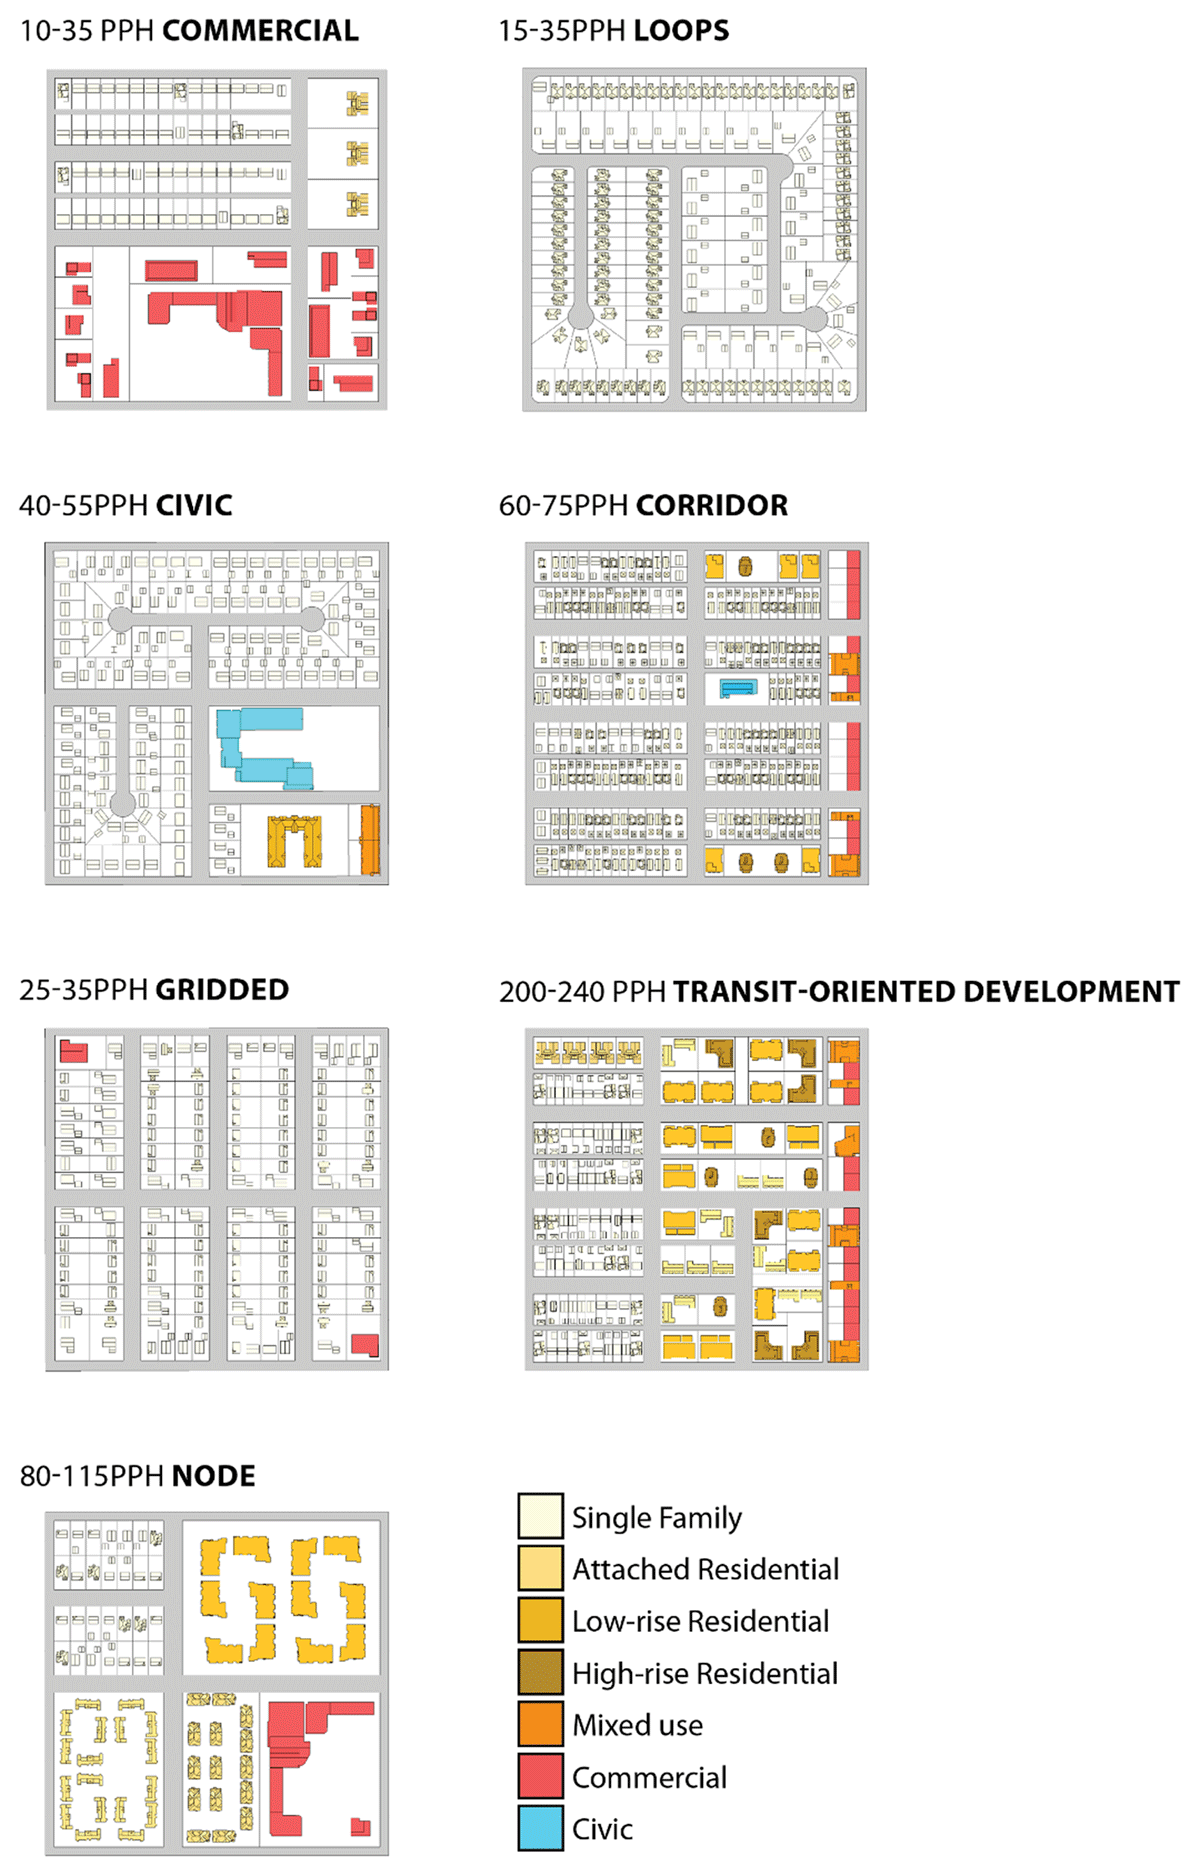
Figure 2
Seven urban neighborhood patterns (400 × 400 m) developed to represent various communities in British Columbia.
Note: pph = people per ha.
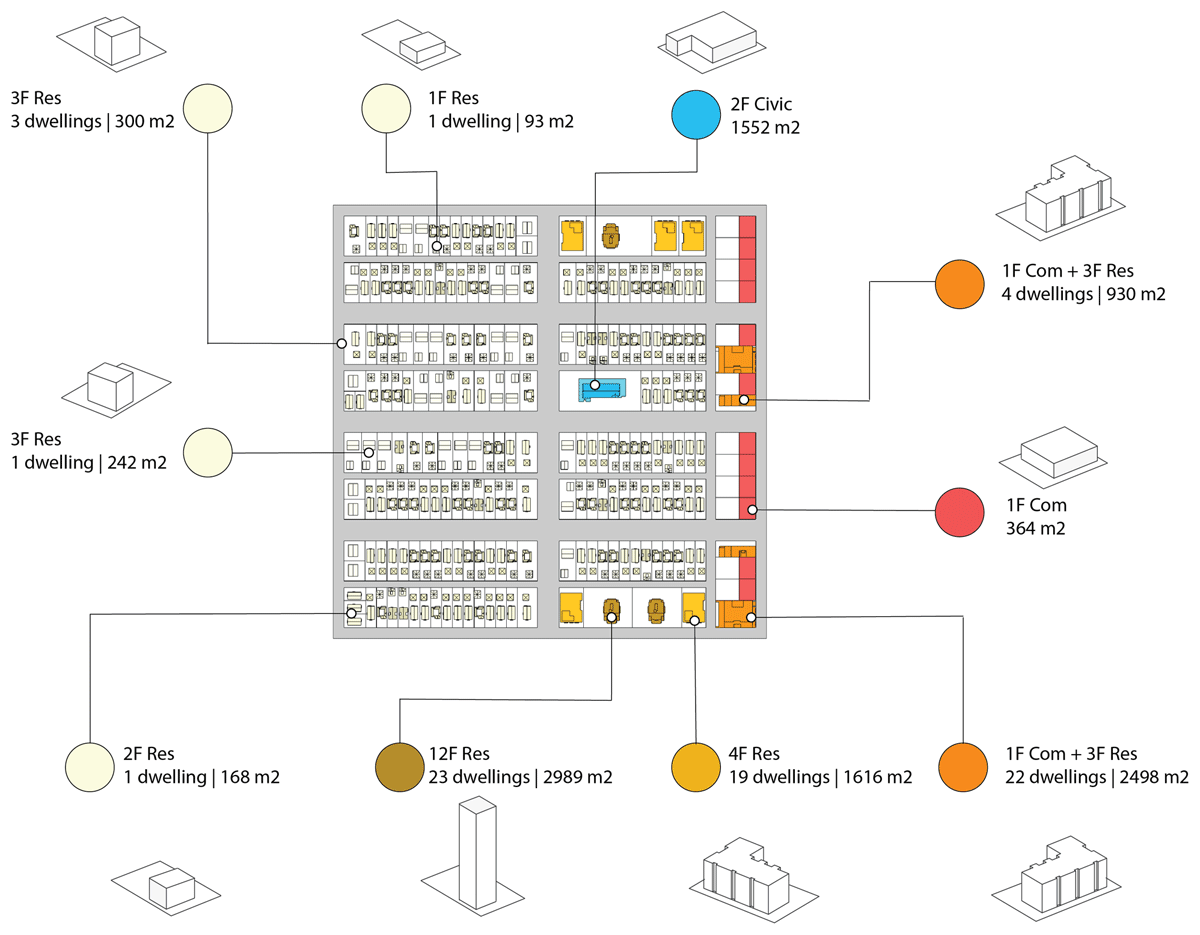
Figure 3
Example of a neighborhood pattern (400 × 400 m) with a series of simplified building typology models.
Table 1
Vintages used to develop British Columbia building code templates for Part 3 (complex buildings) and Part 9 (simple buildings).
| Part 3 | Part 9 |
|---|---|
| Pre-1991 | Pre-1975 |
| 1992–2006 | 1975–92 |
| 2007–12 | 1992–2006 |
| Post-2012 (current code) | 2006–12 |
| Post-2012 (current code) |
Table 2
Sample input variables for the retrofit and replace scenario shown in Figure 4 (not all interventions or variables are included).
| House type | Scenario | Treated floor area (m2) | U-value (W/m2K) | Window/wall | Heat recovery | Infiltration ACHnata | |||||
|---|---|---|---|---|---|---|---|---|---|---|---|
| Wall | Ground | Roof | N | S | E | W | |||||
| Pre-1975 | Base | 150 | 1.73 | 1.17 | 1.65 | 0 | 20 | 10 | 10 | 0.125 | |
| Pre-1975 EnerPHit | 1 | 150 | 0.15 | 0.15 | 0.10 | 0 | 20 | 10 | 10 | 0.75 | 0.050 |
| Pre-1975 Basic | 1 | 150 | 1.73 | 1.17 | 0.37 | 0 | 20 | 10 | 10 | 0.125 | |
| 1975 | Base | 180 | 0.58 | 0.57 | 0.60 | 10 | 40 | 20 | 30 | 0.125 | |
| 1975 EnerPHit | 1 | 180 | 0.15 | 0.15 | 0.10 | 10 | 40 | 20 | 30 | 0.75 | 0.050 |
| 1975 Basic | 1 | 180 | 0.58 | 0.57 | 0.27 | 10 | 40 | 20 | 30 | 0.125 | |
| 1992 | Base | 360 | 0.47 | 0.20 | 0.20 | 10 | 30 | 10 | 30 | 0.125 | |
| 1992 EnerPHit | 1 | 360 | 0.15 | 0.15 | 0.10 | 10 | 30 | 10 | 30 | 0.75 | 0.050 |
| 1992 Basic | 1 | 360 | 0.47 | 0.20 | 0.14 | 10 | 30 | 10 | 30 | 0.125 | |
| 2006 | 1 | 461 | 0.36 | 0.21 | 0.21 | 10 | 30 | 10 | 30 | 0.125 | |
| 2006 EnerPHit | 1 | 461 | 0.15 | 0.15 | 0.10 | 10 | 30 | 10 | 30 | 0.75 | 0.050 |
| Current code | 1 | 461 | 0.36 | 0.21 | 0.21 | 10 | 30 | 10 | 30 | 0.125 | |
| Passive House | 1 | 361 | 0.15 | 0.15 | 0.10 | 10 | 40 | 30 | 10 | 0.75 | 0.030 |
[i] Note: a Air changes per hour at natural pressure.
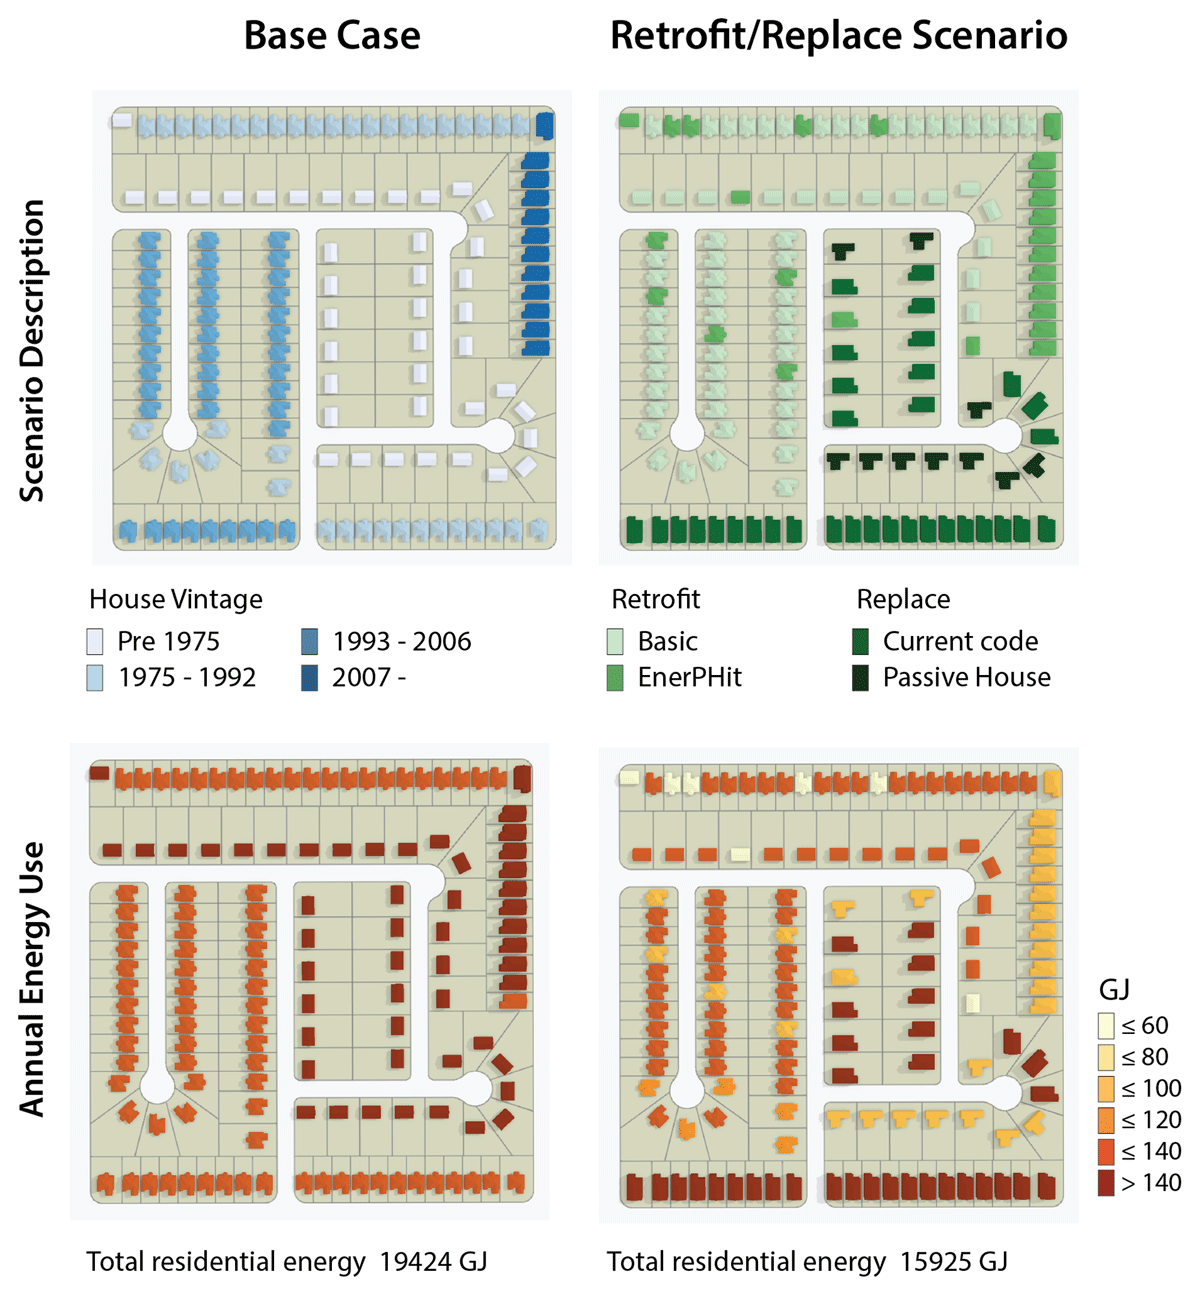
Figure 4
Annual building energy use for the 15–35 people per ha (pph) single-family loops: base case and retrofit scenarios.
Table 3
Sample energy and CO2e outputs for building models in the retrofit scenario shown in Figure 4 (not all buildings are represented).
| House type | Scenario | Treated floor area (m2) | Energy use (GJ) | Energy use intensity (GJ/m2) | Emissions (tCo2e) | Carbon intensity (tCo2e/m2) |
|---|---|---|---|---|---|---|
| Pre-1975 SF | Base | 150 | 170.30 | 1.14 | 5.52 | 0.037 |
| Pre-1975 EnerPHit | 1 | 150 | 45.50 | 0.30 | 1.05 | 0.007 |
| Pre-1975 Basic | 1 | 150 | 129.36 | 0.86 | 4.06 | 0.027 |
| 1975 SF | Base | 180 | 134.07 | 0.74 | 3.99 | 0.022 |
| 1975 EnerPHit | 1 | 180 | 57.48 | 0.32 | 1.28 | 0.007 |
| 1975 Basic | 1 | 180 | 120.49 | 0.67 | 3.52 | 0.020 |
| 1992 SF | Base | 360 | 137.77 | 0.38 | 3.37 | 0.009 |
| 1992 EnerPHit | 1 | 360 | 84.33 | 0.23 | 1.49 | 0.004 |
| 1992 Basic | 1 | 360 | 135.98 | 0.38 | 3.27 | 0.009 |
| 2006 SF | 1 | 461 | 140.19 | 0.30 | 3.13 | 0.007 |
| 2006 EnerPHit | 1 | 461 | 97.80 | 0.21 | 1.57 | 0.003 |
| Current code | 1 | 461 | 143.67 | 0.31 | 3.25 | 0.007 |
| Passive House | 1 | 361 | 85.22 | 0.24 | 1.48 | 0.004 |
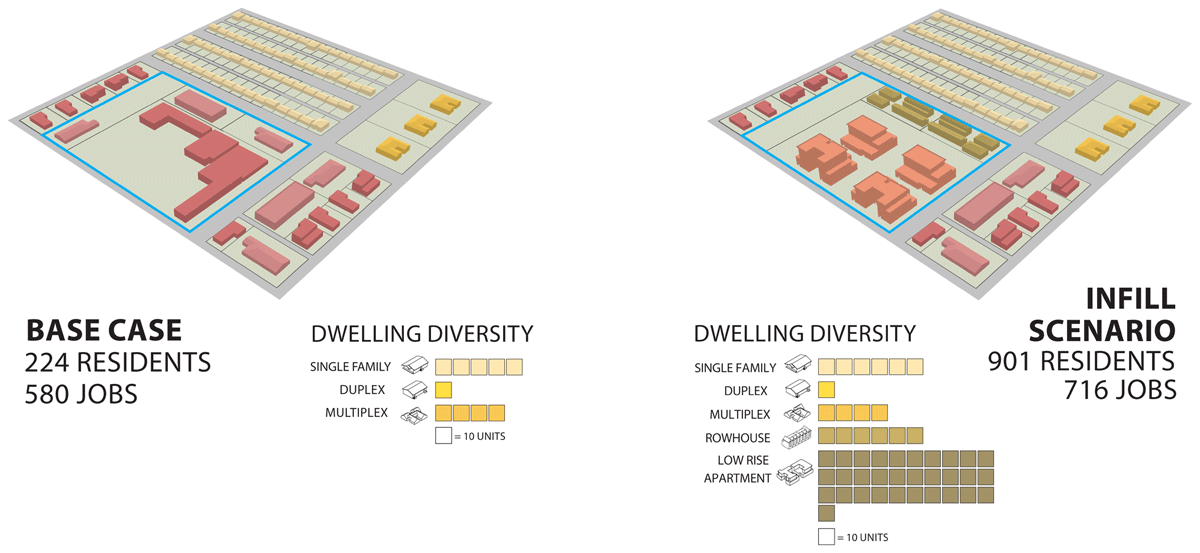
Figure 5
Pattern characteristics for the base and infill scenarios.
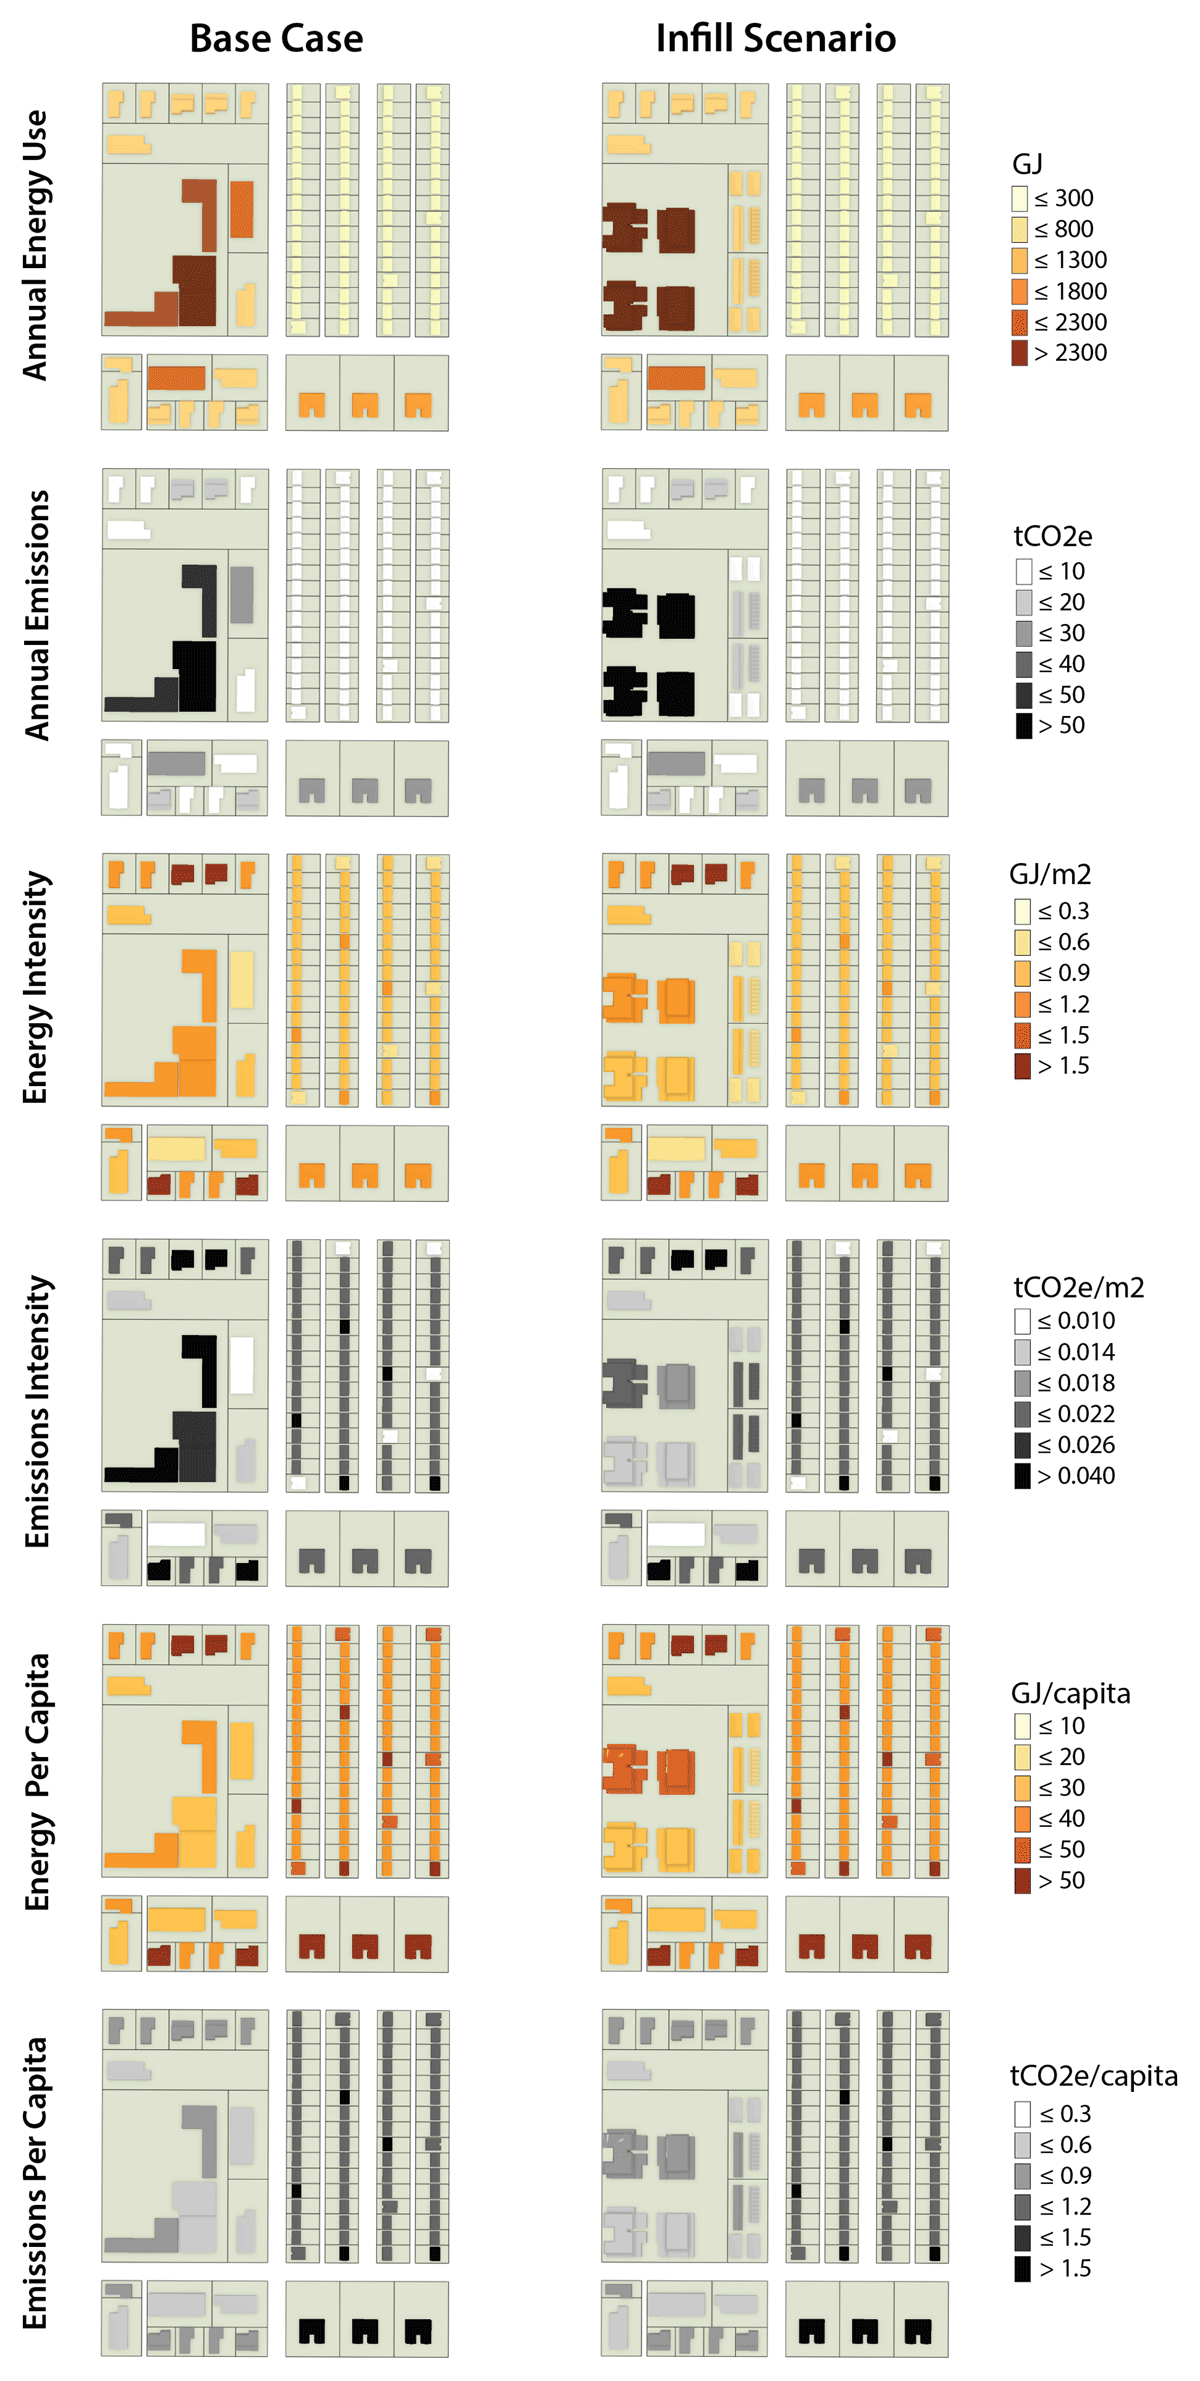
Figure 6
Energy and emissions maps for the commercial pattern base case and infill scenarios.
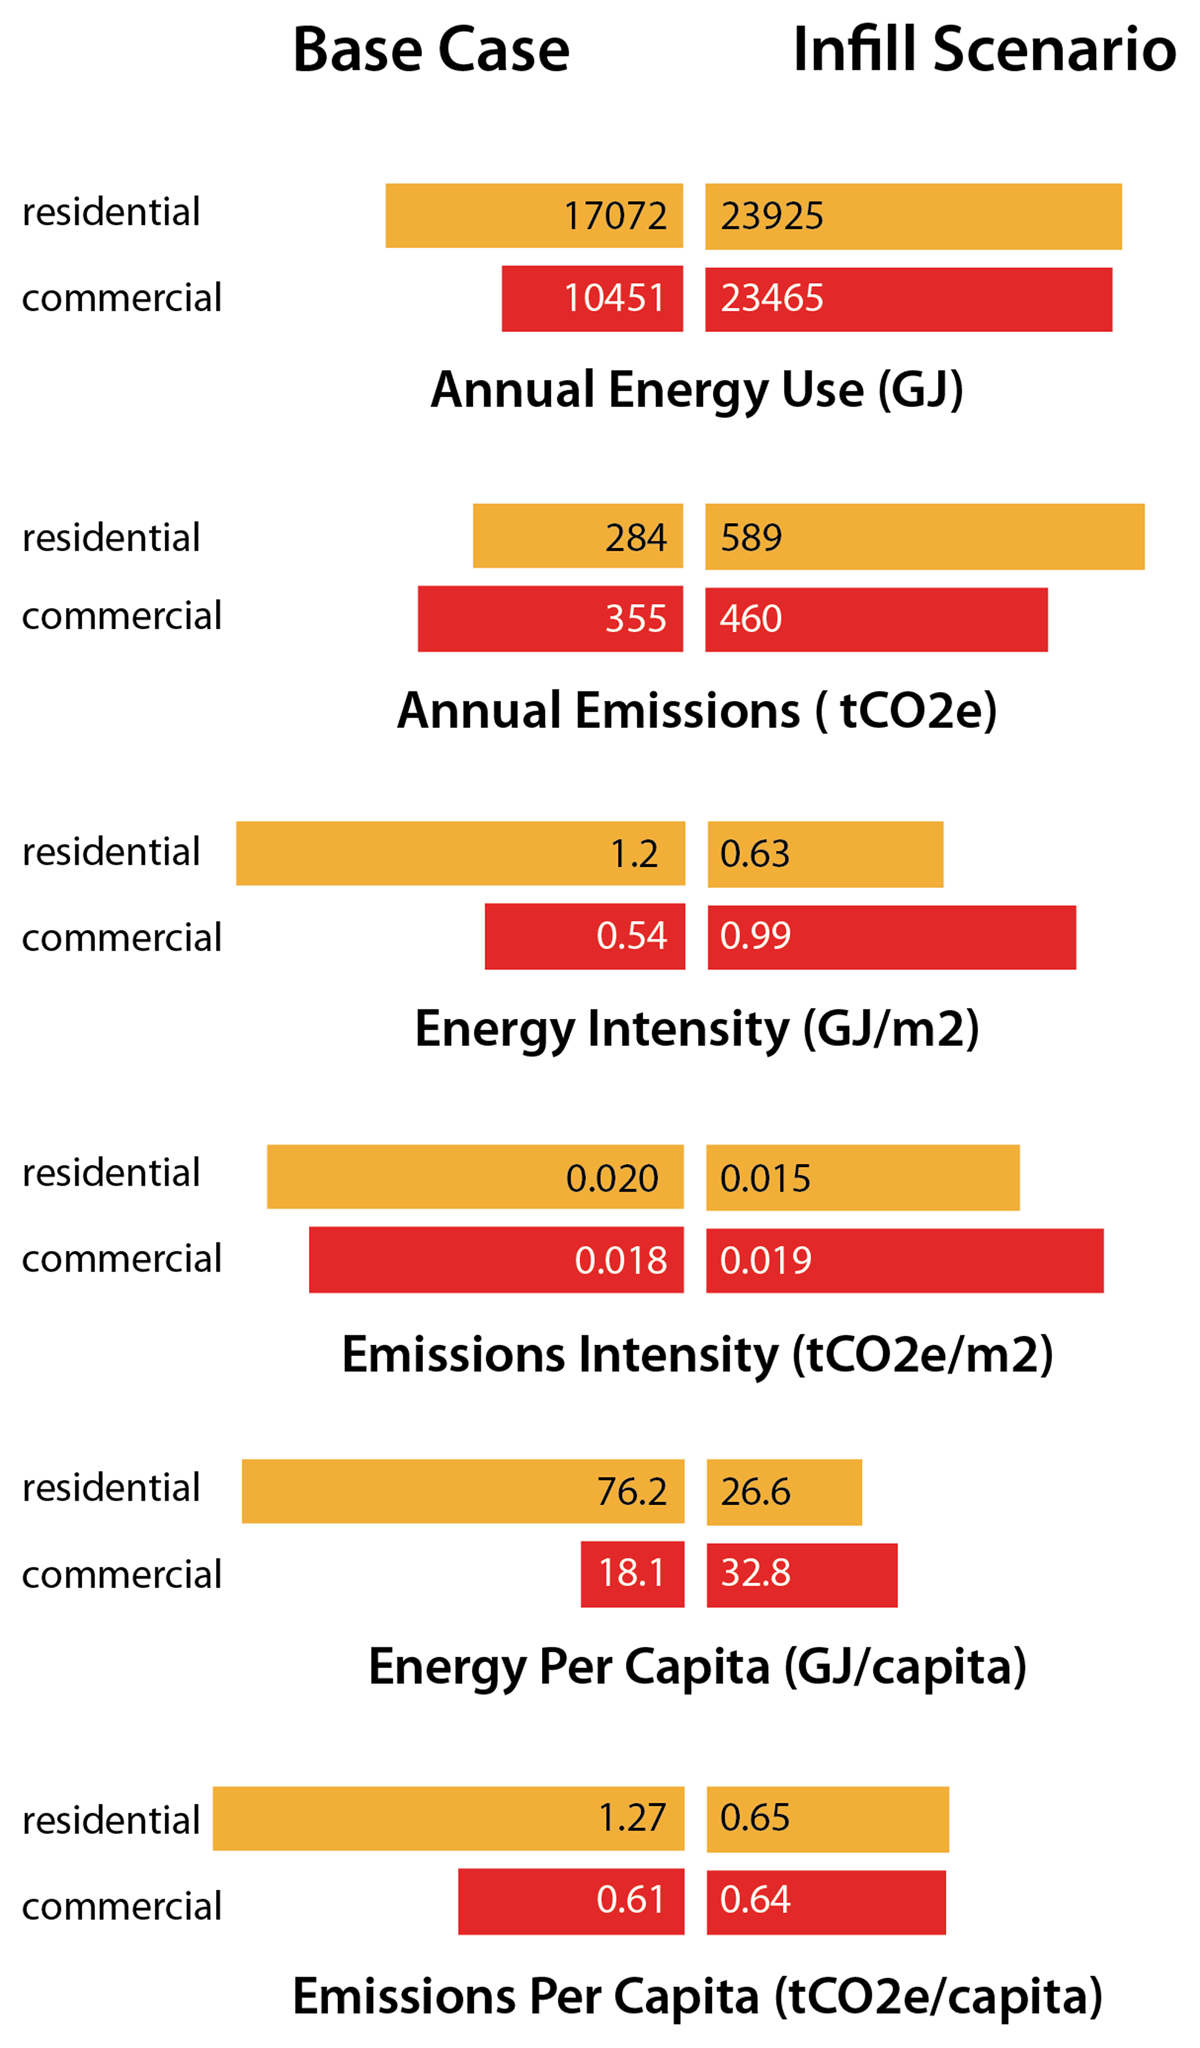
Figure 7
Energy and emissions metrics for the commercial pattern base case and infill scenario.
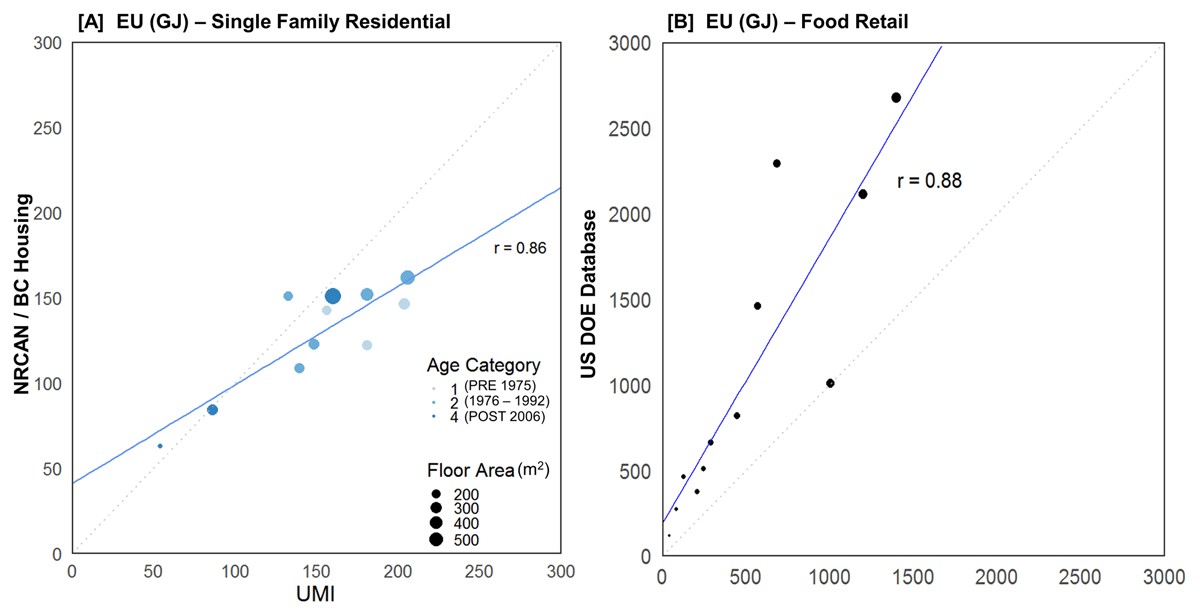
Figure 8
(a) Correlation between the Urban Modeling Interface (UMI) simulation results (x-axis) and reference data from Natural Resources Canada’s (NRCAN) and BC Housing (y-axis) for single-family residential; and (b) correlation between the UMI simulation results and the US Department of Energy (US DOE) for food retail.
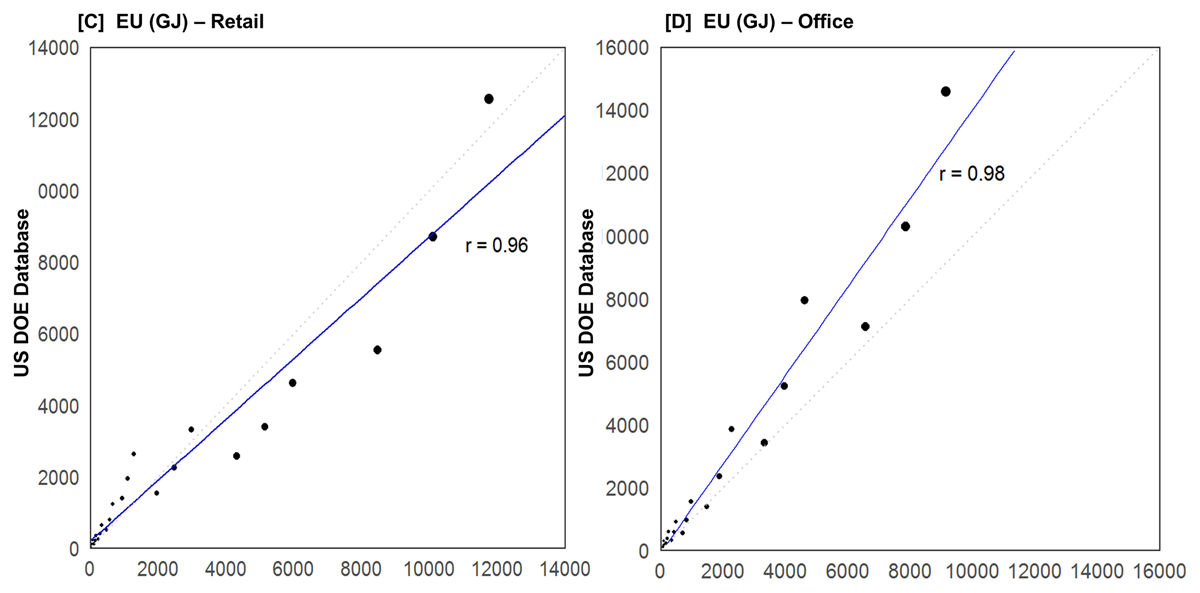
Figure 9
Correlation between the Urban Modeling Interface (UMI) simulation results (x-axis) and the US Department of Energy (DOE) (y-axis): (c) retail; and (d) office.