
1 Introduction
Planning for climate change mitigation has increasingly shifted to policy development and actions at local scales. Many regional and municipal governments now set their own targets and develop their own action plans over and above those of more senior jurisdictions such as federal and international agencies (Denis & Parker 2009; Schreurs 2008; Yi & Feiock 2015). In most cases, the municipalities leading these mitigation planning efforts are large metropolitan centers with sufficient expertise and resources to inventory existing energy demand and emissions, and plan future interventions (e.g. City of New York 2014; City of Vancouver 2015; City of Toronto 2017). However, many North American municipalities are smaller and quite different from larger cities. Even with the oft-cited trend towards urbanisation (Batty 2013; United Nations 2014), significant populations live in small and medium-sized cities and municipalities that in aggregate tend to use more energy per capita (Calthorpe 2011; Province of British Columbia, Climate Action Secretariat 2012) and contribute substantially to greenhouse gas emissions. There exists a significant opportunity and challenge to address energy and emissions across a range of municipality sizes and patterns. However, as smaller cities and municipalities lack the expertise, resources and data to undertake local policy development and simulation, progress toward effective, locally calibrated initiatives and actions will require less resource-intensive approaches and tools able to simulate energy and emissions policy interventions across a diversity of community types and conditions.
Research built upon morphological analyses has been applied to investigations of urban form on building energy demand in various scales. Martin & March (1972) conducted early research on the relationships between building and urban geometry and light access. Baker & Steemers (2000) extended this approach leading to the development of their lighting and thermal (LT) model. Baker & Steemers (2000) and later Ratti, Baker, & Steemers (2005) identified passive versus active zones (for daylighting and ventilation) as key determinants of building energy performance. Steadman and colleagues (Evans, Liddiard, & Steadman 2017; Steadman, Hamilton, & Evans 2014) conducted extensive research on the relationships between geometric building form and energy demand. They found strong relationships between building surface area and building depth, and demand for electricity and gas in a study of the London building stock (Steadman et al. 2014). Salat (2009) found significant impacts on building energy demand based on a building’s shape factor: the relationship between a building’s surface area and its volume. In colder climates, a higher shape factor (i.e. more exposed envelope per unit of building volume) results in higher energy loads.
Although research has demonstrated that a dense, compact form often results in lower energy use (EU) per capita, the interaction between density and energy efficiency remains unclear depending on factors such as city size, building types, climate and energy source. Güneralp et al. (2017) provided a global scenario outlooking potential energy savings achieved by dense urban development and building retrofit. They suggested that, globally, urban density influences total EU just as much as EU per capita. In Canada, Larivière & Lafrance (1999) investigated the 45 most populous cities in the province of Quebec and concluded a 7% EU per capita reduction when increasing population density from 1000 to 3000 people per km2. Ewing & Rong (2008) investigated the impacts of urban density on residential energy in the United States. Their conceptual model identified three causal pathways for urban form that impact residential energy consumption through urban heat island effects, and the energy impacts of varying housing stocks. Their model suggested that interactions between house type and size and the resulting urban form (e.g. density) have a significant impact on overall energy consumption. Silva, Oliveira, & Leal (2017) also provided a comprehensive review of urban form variables contributing to building energy performance.
These morphological and statistic approaches to energy and urban form offer valuable ways to assess the impact of individual building design and urban-scale characteristics on energy performance. However, these approaches do not account for the significant and highly variable impacts of building scale technological changes such as envelope materials and standards, heating, ventilation and air-conditioning (HVAC) systems, and controls, etc., nor the potential interactions between building-scale variables and urban form attributes. For these types of analyses, more comprehensive and spatially fine-grained simulation approaches are necessary but challenging to implement at neighborhood scales.
This paper describes a hybrid approach to simulating built-environment energy and emissions policy interventions using urban neighborhood patterns characteristic in many cities in British Columbia (BC), Canada. BC was the first jurisdiction in North America to institute a carbon tax in 2008 (Murray & Rivers 2015). In parallel, the provincial government enacted Bill 27, an amendment to the Local Governments Act requiring all municipalities in the province to inventory their emissions and plan future mitigation strategies (Stevens & Senbel 2012). BC Hydro provided funding for municipalities to complete community energy and emissions plans (CEEPs) to meet Bill 27’s requirements. The scope of those CEEPs is variable, and implementation has been slow in many municipalities (Stevens & Senbel 2012). The results are to assist local municipalities visualise and evaluate alternative policy interventions at a neighborhood scale. Among the contributions of this research are new methods and tools for simulating the energy and emissions consequences of policy options across various built environments in BC:
To analyse and categorise patterns of urban form across BC’s communities and to develop a set of common neighborhood scale patterns.
To adapt an Urban Modeling Interface (UMI) to model current and future energy and emissions profiles for these neighborhood patterns.
To simulate the effectiveness of alternative energy and emissions-reducing policy options at building and neighborhood scales.
2 Methods
In order to simulate energy and emissions interventions across a range of urban form patterns, the methods underlying this research integrate steps of urban form characterisation, scenario analysis and energy simulation into a cohesive workflow (Figure 1). Prior research related to the categorisation of urban form (section 2.1), the development of urban form patterns (section 2.2), and the simulation of ‘what-if’ scenarios (section 2.3) and validation of building energy demand at neighborhood scales (section 2.4) have contributed to this methodology.
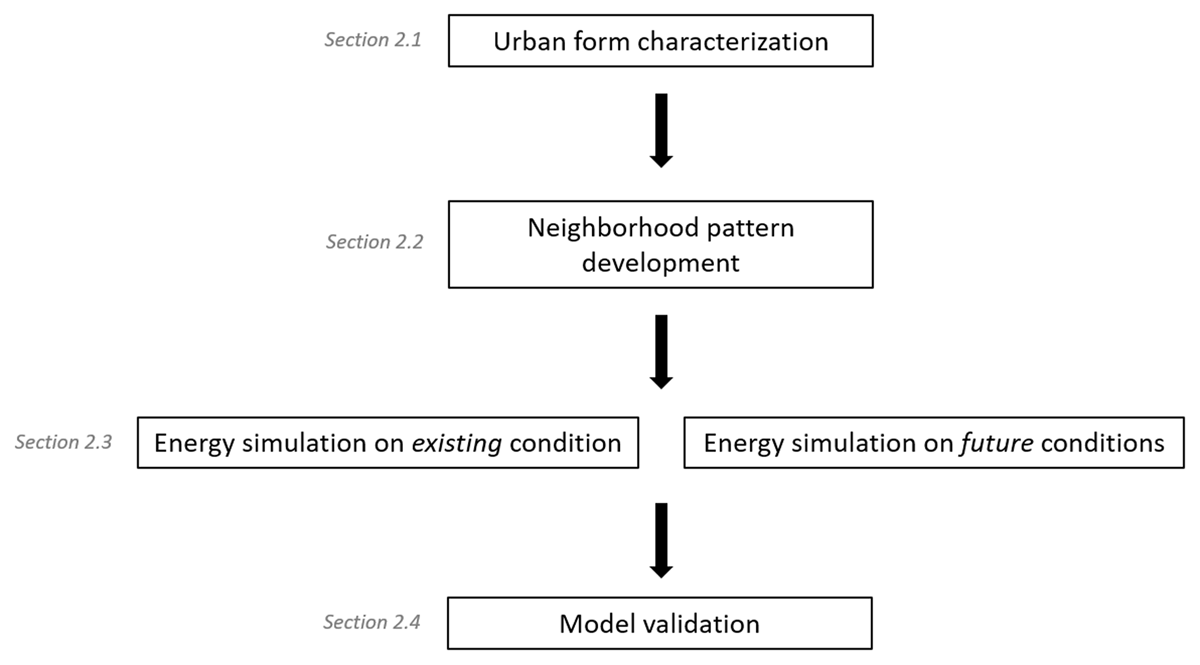
Figure 1
Key stages of the proposed methodology.
2.1 Urban form characterisation
There is a long tradition of analysis and categorisation of urban forms (Kropf 2009). Clifton et al. (2008) reviewed the quantitative approaches to the study of urban form, identifying five approaches based on disciplines of study, including landscape ecology, economic structure, transportation planning, community design and urban design. The community design category, typified by the work of Song & Knapp (2004, 2007), relates closely to the research reported in the present paper. Song & Knapp (2004, 2007) used geographic information system (GIS) and spatial analysis methods to measure characteristics of urban patterns such as land use, intensity, parcelisation and street networks, and subsequently to categorise urban form based on those parameters. Similar approaches have been used in mobility research, connecting urban form to health outcomes (Frank et al. 2005).
Doxiadis (1968) and Salat (2011) investigated the morphological attributes of urban form patterns across scales to analyse important processes and interactions that occur at different urban scales. Doxiadis (1968) used a multi-scalar grid to examine human settlements, in many ways anticipating later fractal approaches (e.g. Salat 2011; Batty 2013). When studying urban form at the village to city scale, Doxiadis primarily used 100 or 200 m grids. Salat (2011) used a similar approach, but subdivided patterns into 200 × 200 m (group of blocks), 400 × 400 m (neighborhood) and 800 × 800 m (district) grids. Within those grids, constituent characteristics such as block and dwelling density, block coverage, urban form, dwelling types, etc. were measured. Rode et al. (2014) applied this subdivision and categorisation of urban form, identifying and measuring homogenous 500 × 500 m patches of urban form in London, Paris, Berlin and Istanbul, and simulating the heat energy demand associated with these different forms of development. The analysis of urban form patterns and development of the urban form patterns in the present study drew from this body of research.
Six cities across BC were selected to test a pattern characterisation methodology that combined census data analysis, spatial analysis and qualitative input from professionals. These cities were selected based on four primary criteria:
data accessibility: at the time of study only 13 municipalities in BC had open data
population size: a distribution of city sizes from a small to a large municipality
population growth rate: a distribution from low to negative growth rates, to high growth rates for the period 2006–11
geographical and climatic context: BC has extremely varied climatic conditions; these climate conditions have significant impact on EU and emissions.
The cities ultimately selected included two smaller, lower density, low-growth examples from the cold Northern and Eastern Interior (Prince George, Revelstoke), two mid-sized, less dense but high-growth examples from the Southern Interior (Kelowna) and Vancouver Island (Saanich), and two larger, denser, high-growth examples from the Lower Mainland (Vancouver, Surrey). These examples range in population from 7000 to 600,000 and represented over half of BC’s population in 2011.
Within each selected city, four filters, two quantitative and two qualitative, were applied to categorise census dissemination areas (DAs) into representative land-use and population density categories. Census DAs were quantitatively sorted by population density. Coarse census-based population density categories were then overlaid spatially on land-use and urban-form patterns. In a first qualitative analysis pass, the categorised DAs were presented to an advisory group of planners and urban designers to identify most characteristic spatial patterns. Based on a review of the literature (Salat 2011, Kellett 2009, Rueda 2017, Song & Knapp 2004, 2007), seven metrics were selected to further analyse and categorise urban form patterns, including proportions of land uses (total area of each land use type divided by each DA area), lot density (quantity of lots divided by each DA area), median lot area (median lot area in each DA), median footprint area (median footprint area in each DA), median footprint to lot area ratio (median of footprint area divided by lot area), three-way intersection density (number of three-way intersections divided by the corresponding DA area), and four-way intersection density (number of four-way intersections divided by the corresponding DA area). Also calculated were the same metrics aggregated by population density and by municipality. To achieve that, all lots, footprints and intersections from all chosen municipalities were added to locate representative metrics that take all the selected DAs into consideration. This process yielded spatial metrics that would define the archetypal neighborhood patterns. The DAs selected in the first qualitative pass were then quantitatively ranked by population density and grouped using these measures. The ranked DAs were then presented to the advisory group in a second qualitative step where seven most common urban neighborhood patterns were identified and categorised by population density ranges, street patterns and land-use mix.
2.2 Developing urban neighborhood patterns
These top-ranked DAs were then generalised into 400 × 400 m urban neighborhood patterns, drawn in GIS and modeled in Rhino (Figures 2 and 3). Each pattern closely resembles population density, parcel density, street patterns, block sizes, parcel sizes and land-use proportions associated with the selected source DAs, but is generalised to be more broadly applicable to a range of similar DAs. In a second step (Figure 3), generalised building types were assigned to each parcel, based on visual surveys and BC Assessment (2017) data (which ties building type, age, use, occupancy, construction type, and date and fuel sources to each parcel of land). This process replicates prior urban planning and design simulation approaches conducted by the authors and affiliated researchers (Senbel et al. 2011, 2013; Van der Laan, Kellet, & Girling 2013), and is similar to the approach described by Rode et al. (2014). These seven neighborhood patterns (Figure 2), characteristic of a broad range of urban development patterns in BC, enable iterative and comparable building energy and emission ‘what-if’ simulations at a neighborhood scale. It is explained below how two possible energy-mitigation policies applied to one of the neighborhood patterns—the 15–35 people per ha (pph) single-family loops—were tested using urban building energy modelling software.
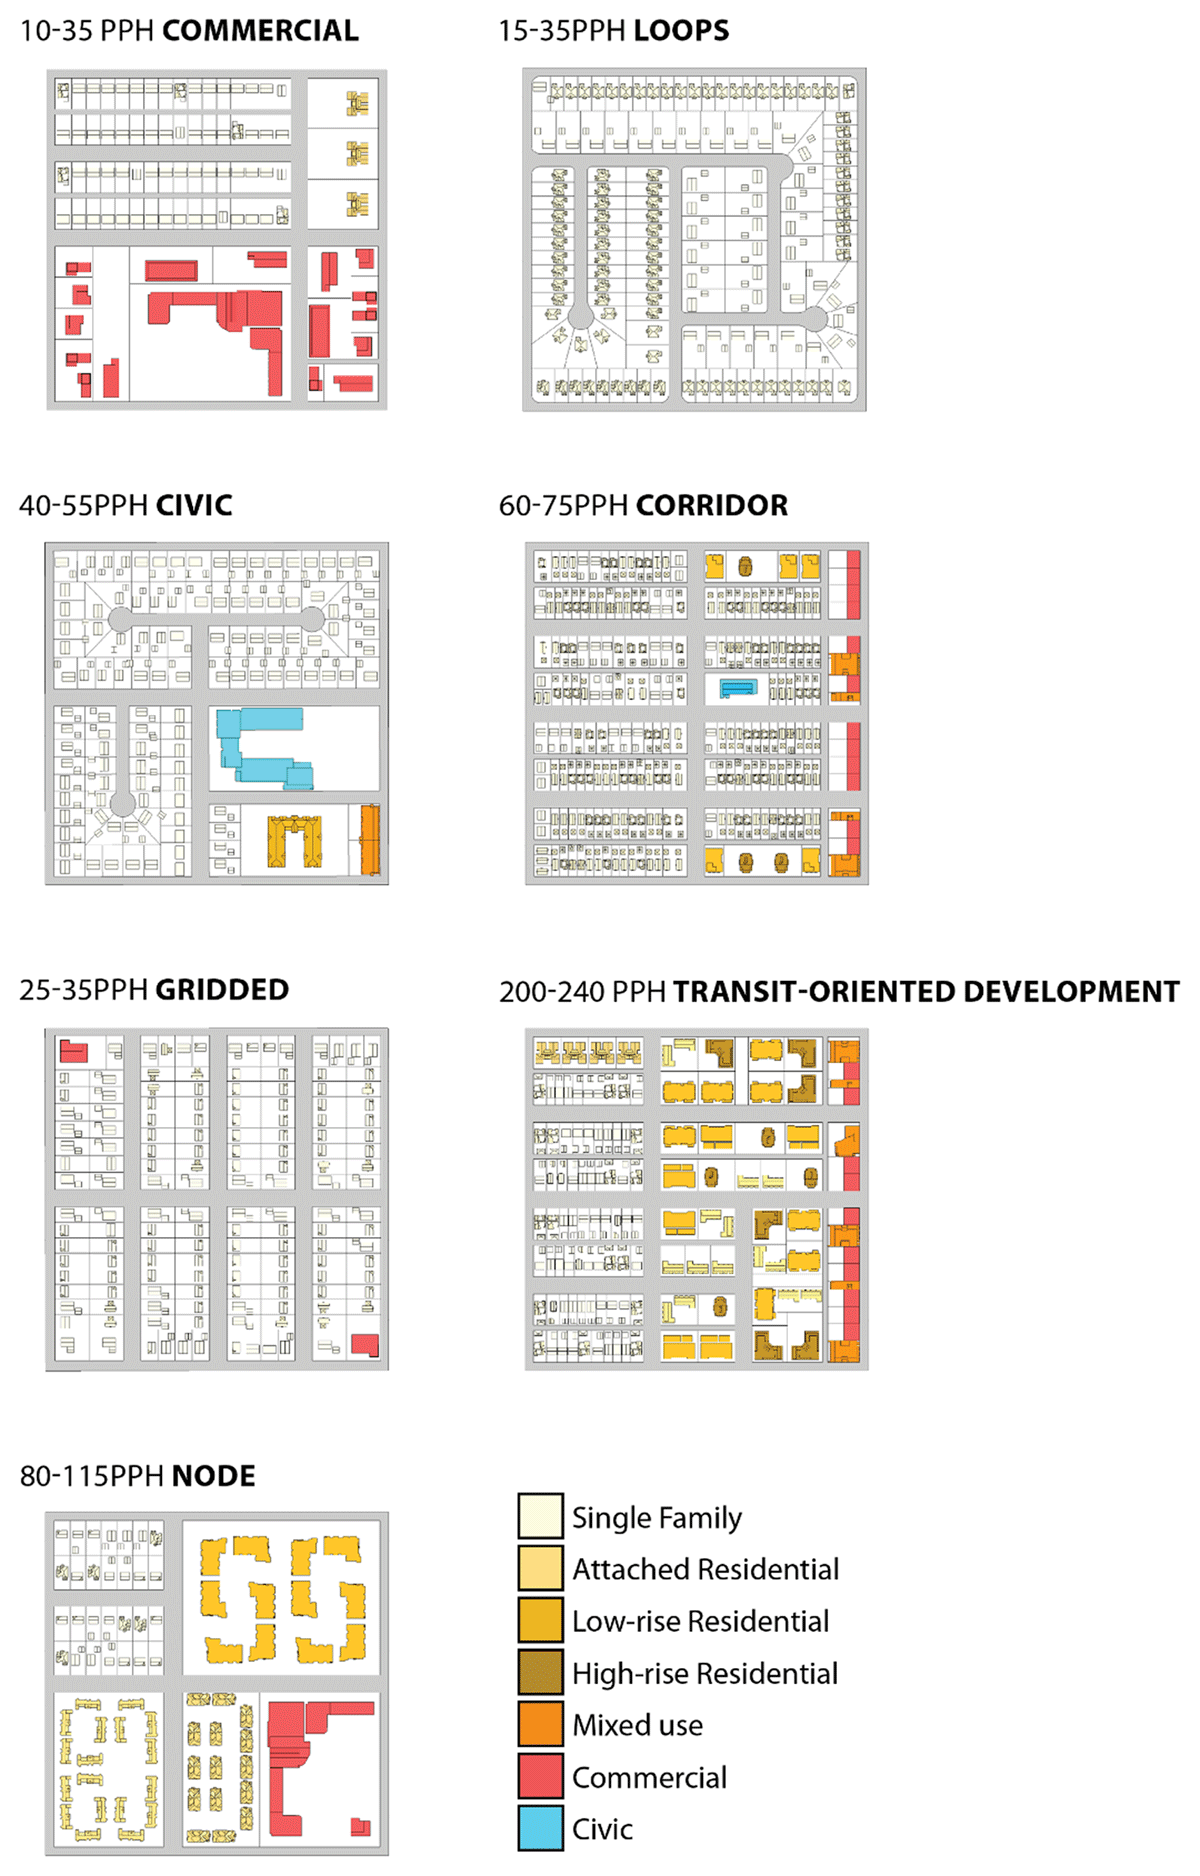
Figure 2
Seven urban neighborhood patterns (400 × 400 m) developed to represent various communities in British Columbia.
Note: pph = people per ha.
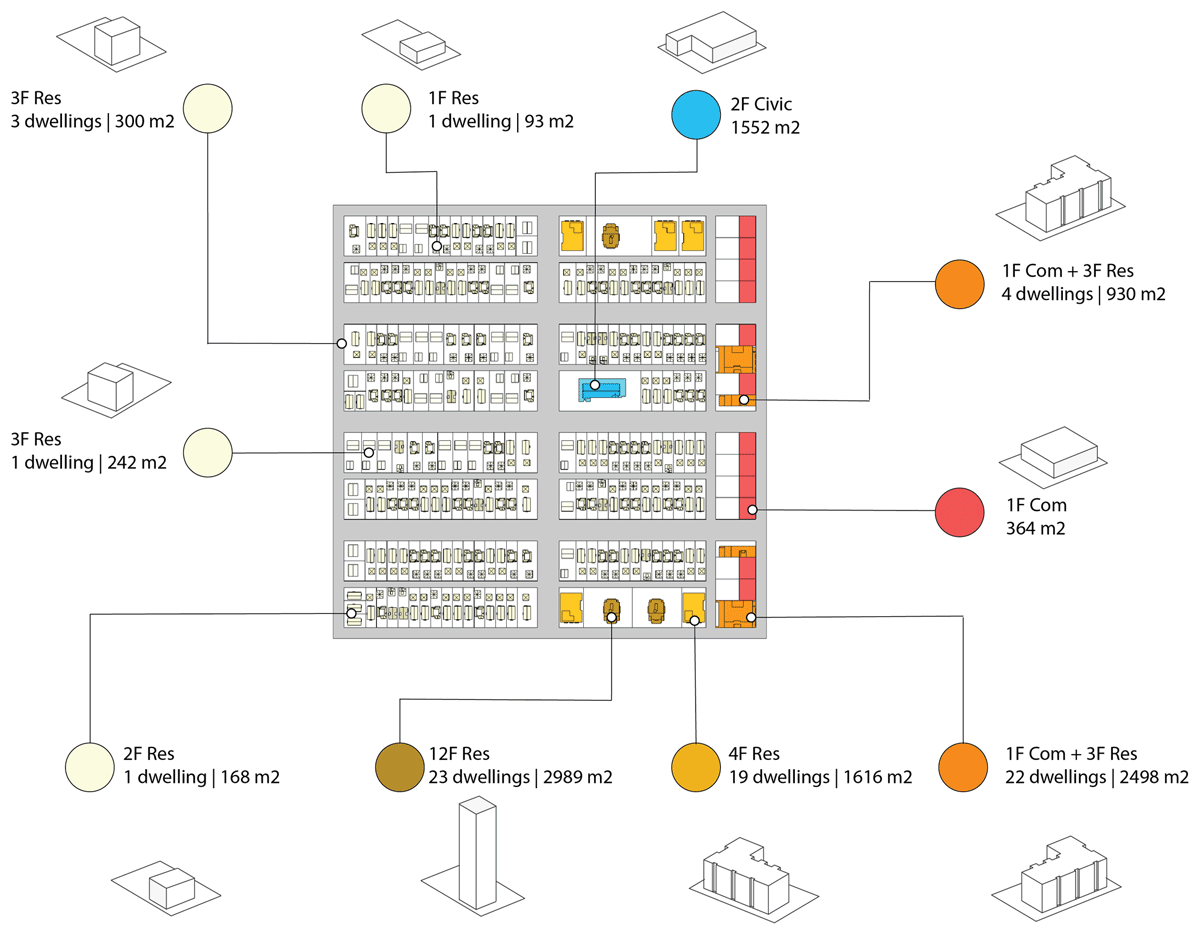
Figure 3
Example of a neighborhood pattern (400 × 400 m) with a series of simplified building typology models.
2.3 Adapting and applying the Urban Modeling Interface (UMI)
Reinhart & Cerezo Davila (2016) reviewed ‘urban building energy modeling’ (UBEM) that aggregated simulations of individual buildings at district and city scales. Two notable examples are the SimStadt model from Hochschule fur Technik in Stuttgart, which uses CityGML and its energy Application Domain Extension to simulate steady-state heat-balance models at neighborhood to city scales (Wate & Coors 2015; Nouvel et al. 2013); and the UMI, an open-source tool developed in MIT’s Sustainable Design Lab, which conducts dynamic building simulations based on the US Department of Energy’s (US DOE) EnergyPlus simulation engine (Cerezo Davila, Reinhart, & Bemis 2016).
The UMI was developed in association with the City of Boston to simulate existing energy demand for the entire city. To accomplish energy simulation at this urban scale, UMI makes several simplifications, including the development of a shoebox model (Dogan & Reinhart 2013) to optimise building-scale simulation, and the definition of a smaller set of building patterns (Sokol, Cerezo Davila, & Reinhart 2017) to represent the diversity of built forms. UMI uses building geometry and building template files that describe construction materials, window to wall ratios, equipment, etc. for a given pattern. Similar to SimStadt, UMI also simulates the effects of inter-building shading and insolation. These new UBEM approaches present the opportunity to simulate the impacts of urban form with technological and behavioral interventions to provide an integrated view of built-environment energy demand. However, these approaches bring significant data requirements (Reinhart & Cerezo Davila 2016; Swan & Ugursal 2009) beyond the reach of many municipalities.
The methodology developed for this research adapted UMI for the simulation of future scenarios based on its capability to simulate land use, urban form and technological at urban scales with local weather profiles. The authors applied UMI to one of the patterns and ran two different energy-mitigation scenarios, one involving renovating or replacing existing building stock at similar densities and form, and the other involving the redevelopment of a portion of the neighborhood pattern at significantly higher densities.
The UMI derives building geometry and building spatial arrangement information and connects that geometric information to a building template file that contains information such as window, wall and roof materials, orientation-specific window/wall ratios, presence or absence of specific equipment such as heat-recovery ventilators, building occupants, etc., and it uses that building template to populate EnergyPlus. A separate building insolation and shading model uses radiance to account for inter-building effects. Using UMI’s building templates, it is possible to change building information while maintaining the geometry to investigate the impacts of envelope retrofits. It is also possible to change the geometry while holding construction materials constant to investigate the impacts of urban form.
Parcel and block information was imported from ArcGIS data associated with the neighborhood patterns. Building geometry and data, such as window/wall ratios for the generalised building types, were initially sourced from an online urban design reference (http://elementsdb.sala.ubc.ca), then further simplified to the narrower set of building types used. Building template files for construction materials were developed using the BC Building Code (2012). This code separates buildings into two primary types: Part 3, or complex buildings, are buildings over three stories in height, or over 600 m2 in footprint; and Part 9, or simple buildings, are buildings less than three stories and less than 600 m2 in footprint. The vintages (Table 1) used correspond to periods where large changes in the building code resulted in significant improvements in building energy performance.
Table 1
Vintages used to develop British Columbia building code templates for Part 3 (complex buildings) and Part 9 (simple buildings).
| Part 3 | Part 9 |
|---|---|
| Pre-1991 | Pre-1975 |
| 1992–2006 | 1975–92 |
| 2007–12 | 1992–2006 |
| Post-2012 (current code) | 2006–12 |
| Post-2012 (current code) |
2.3.1. Retrofit ‘what-if’ scenario
A ‘what-if’ retrofit and replacement scenario was developed to measure possible alternative futures with incremental replacement of building technology upgrades (Table 2) through energy retrofits while holding urban form, demographics and behavior constant. The scenario (Figure 4) showed homes replaced (1% per year) and retrofit (2% per year) to 2050 (Dixon & Eames 2013). Table 2 provides a synopsis of the types of interventions used, including new construction to the current code, new construction to Passive House standards, basic building roof retrofits (CA$5000) and retrofit to Passive House’s EnerPHit standard (PHI 2016). In this example, HVAC systems, fuel sources, domestic hot water, number of occupants and occupancy schedules were held constant.
Table 2
Sample input variables for the retrofit and replace scenario shown in Figure 4 (not all interventions or variables are included).
| House type | Scenario | Treated floor area (m2) | U-value (W/m2K) | Window/wall | Heat recovery | Infiltration ACHnata | |||||
|---|---|---|---|---|---|---|---|---|---|---|---|
| Wall | Ground | Roof | N | S | E | W | |||||
| Pre-1975 | Base | 150 | 1.73 | 1.17 | 1.65 | 0 | 20 | 10 | 10 | 0.125 | |
| Pre-1975 EnerPHit | 1 | 150 | 0.15 | 0.15 | 0.10 | 0 | 20 | 10 | 10 | 0.75 | 0.050 |
| Pre-1975 Basic | 1 | 150 | 1.73 | 1.17 | 0.37 | 0 | 20 | 10 | 10 | 0.125 | |
| 1975 | Base | 180 | 0.58 | 0.57 | 0.60 | 10 | 40 | 20 | 30 | 0.125 | |
| 1975 EnerPHit | 1 | 180 | 0.15 | 0.15 | 0.10 | 10 | 40 | 20 | 30 | 0.75 | 0.050 |
| 1975 Basic | 1 | 180 | 0.58 | 0.57 | 0.27 | 10 | 40 | 20 | 30 | 0.125 | |
| 1992 | Base | 360 | 0.47 | 0.20 | 0.20 | 10 | 30 | 10 | 30 | 0.125 | |
| 1992 EnerPHit | 1 | 360 | 0.15 | 0.15 | 0.10 | 10 | 30 | 10 | 30 | 0.75 | 0.050 |
| 1992 Basic | 1 | 360 | 0.47 | 0.20 | 0.14 | 10 | 30 | 10 | 30 | 0.125 | |
| 2006 | 1 | 461 | 0.36 | 0.21 | 0.21 | 10 | 30 | 10 | 30 | 0.125 | |
| 2006 EnerPHit | 1 | 461 | 0.15 | 0.15 | 0.10 | 10 | 30 | 10 | 30 | 0.75 | 0.050 |
| Current code | 1 | 461 | 0.36 | 0.21 | 0.21 | 10 | 30 | 10 | 30 | 0.125 | |
| Passive House | 1 | 361 | 0.15 | 0.15 | 0.10 | 10 | 40 | 30 | 10 | 0.75 | 0.030 |
[i] Note: a Air changes per hour at natural pressure.
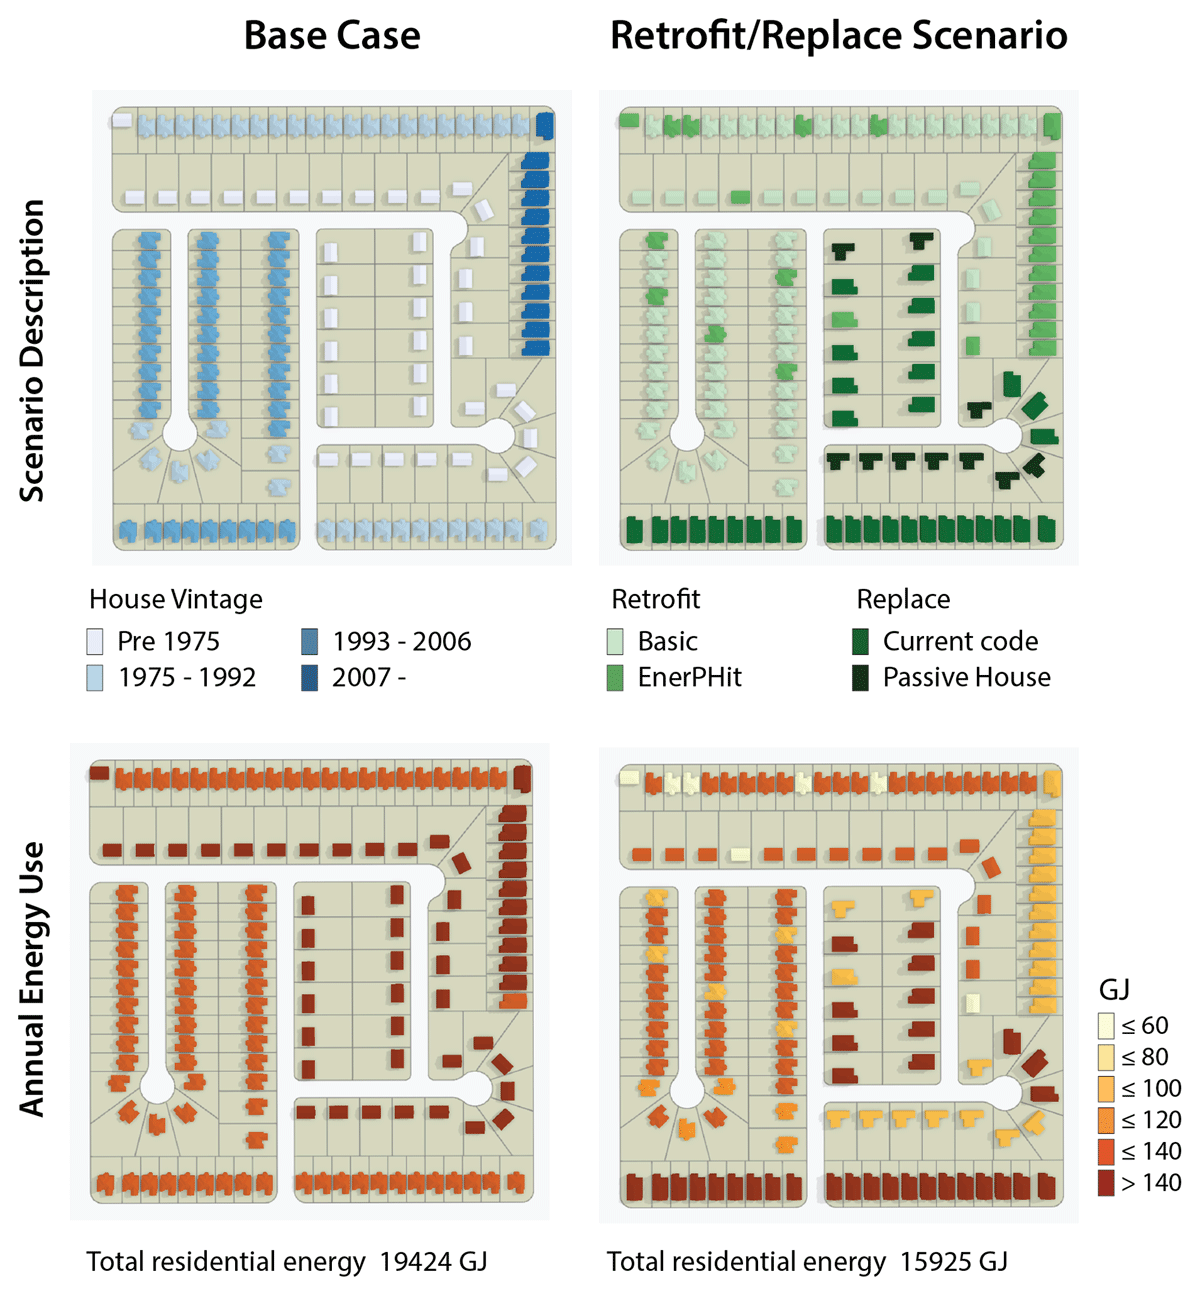
Figure 4
Annual building energy use for the 15–35 people per ha (pph) single-family loops: base case and retrofit scenarios.
This policy intervention achieved a modest improvement in total neighborhood energy, illustrating the negative consequences of the ‘rebound effect’, where the improved energy efficiency of renovations and new homes is counteracted by a growing house size (Calthorpe 2011; Ewing & Rong 2008). While high-performance Passive House and EnerPHit houses perform efficiently, the newer, larger homes built to the current code perform similarly to older, smaller and less efficient homes (Table 3). While the EU intensity of the current code house is significantly lower than the pre-1975 home, the floor area is significantly larger, resulting in only a small improvement in total EU.
Table 3
Sample energy and CO2e outputs for building models in the retrofit scenario shown in Figure 4 (not all buildings are represented).
| House type | Scenario | Treated floor area (m2) | Energy use (GJ) | Energy use intensity (GJ/m2) | Emissions (tCo2e) | Carbon intensity (tCo2e/m2) |
|---|---|---|---|---|---|---|
| Pre-1975 SF | Base | 150 | 170.30 | 1.14 | 5.52 | 0.037 |
| Pre-1975 EnerPHit | 1 | 150 | 45.50 | 0.30 | 1.05 | 0.007 |
| Pre-1975 Basic | 1 | 150 | 129.36 | 0.86 | 4.06 | 0.027 |
| 1975 SF | Base | 180 | 134.07 | 0.74 | 3.99 | 0.022 |
| 1975 EnerPHit | 1 | 180 | 57.48 | 0.32 | 1.28 | 0.007 |
| 1975 Basic | 1 | 180 | 120.49 | 0.67 | 3.52 | 0.020 |
| 1992 SF | Base | 360 | 137.77 | 0.38 | 3.37 | 0.009 |
| 1992 EnerPHit | 1 | 360 | 84.33 | 0.23 | 1.49 | 0.004 |
| 1992 Basic | 1 | 360 | 135.98 | 0.38 | 3.27 | 0.009 |
| 2006 SF | 1 | 461 | 140.19 | 0.30 | 3.13 | 0.007 |
| 2006 EnerPHit | 1 | 461 | 97.80 | 0.21 | 1.57 | 0.003 |
| Current code | 1 | 461 | 143.67 | 0.31 | 3.25 | 0.007 |
| Passive House | 1 | 361 | 85.22 | 0.24 | 1.48 | 0.004 |
2.3.2. Redevelopment scenario
The redevelopment scenario focused on an urban form-based energy pathway (Table 3). One contiguous area of five parcels was redeveloped from commercial to residential and mixed use, typical of intensification strategies used in BC. The new development reduced regular retail space by 3089 m2, adds 3657 m2 of food retail, 3610 m2 of office and 24,022 m2 of multi-family residential. This development significantly increased both the population and jobs, and simultaneously increased dwelling diversity (Figure 5). In this scenario, all new buildings were constructed to the current code, holding the HVAC system, fuel source, and behavior variables constant. Emissions were calculated from the building energy results using provincial emission factors (Canadian Ministry of Environment 2016).
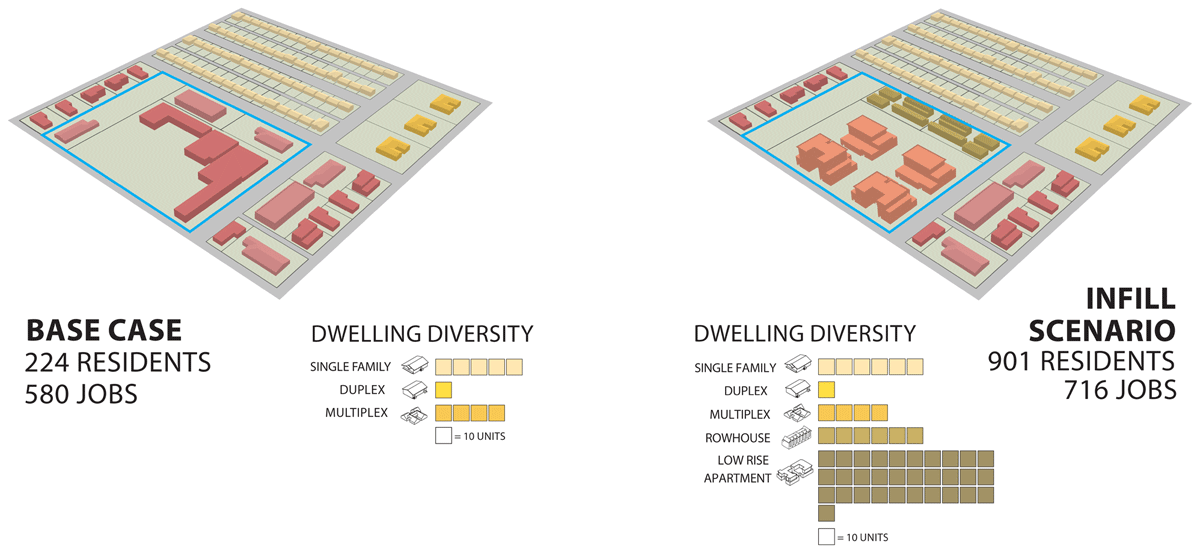
Figure 5
Pattern characteristics for the base and infill scenarios.
This infill scenario revealed an increase in neighborhood energy demand and emissions given the significant increase in population (Figures 6 and 7). However, EU intensity, CO2e intensity, EU per capita and tCO2e per capita all decreased for residential buildings.
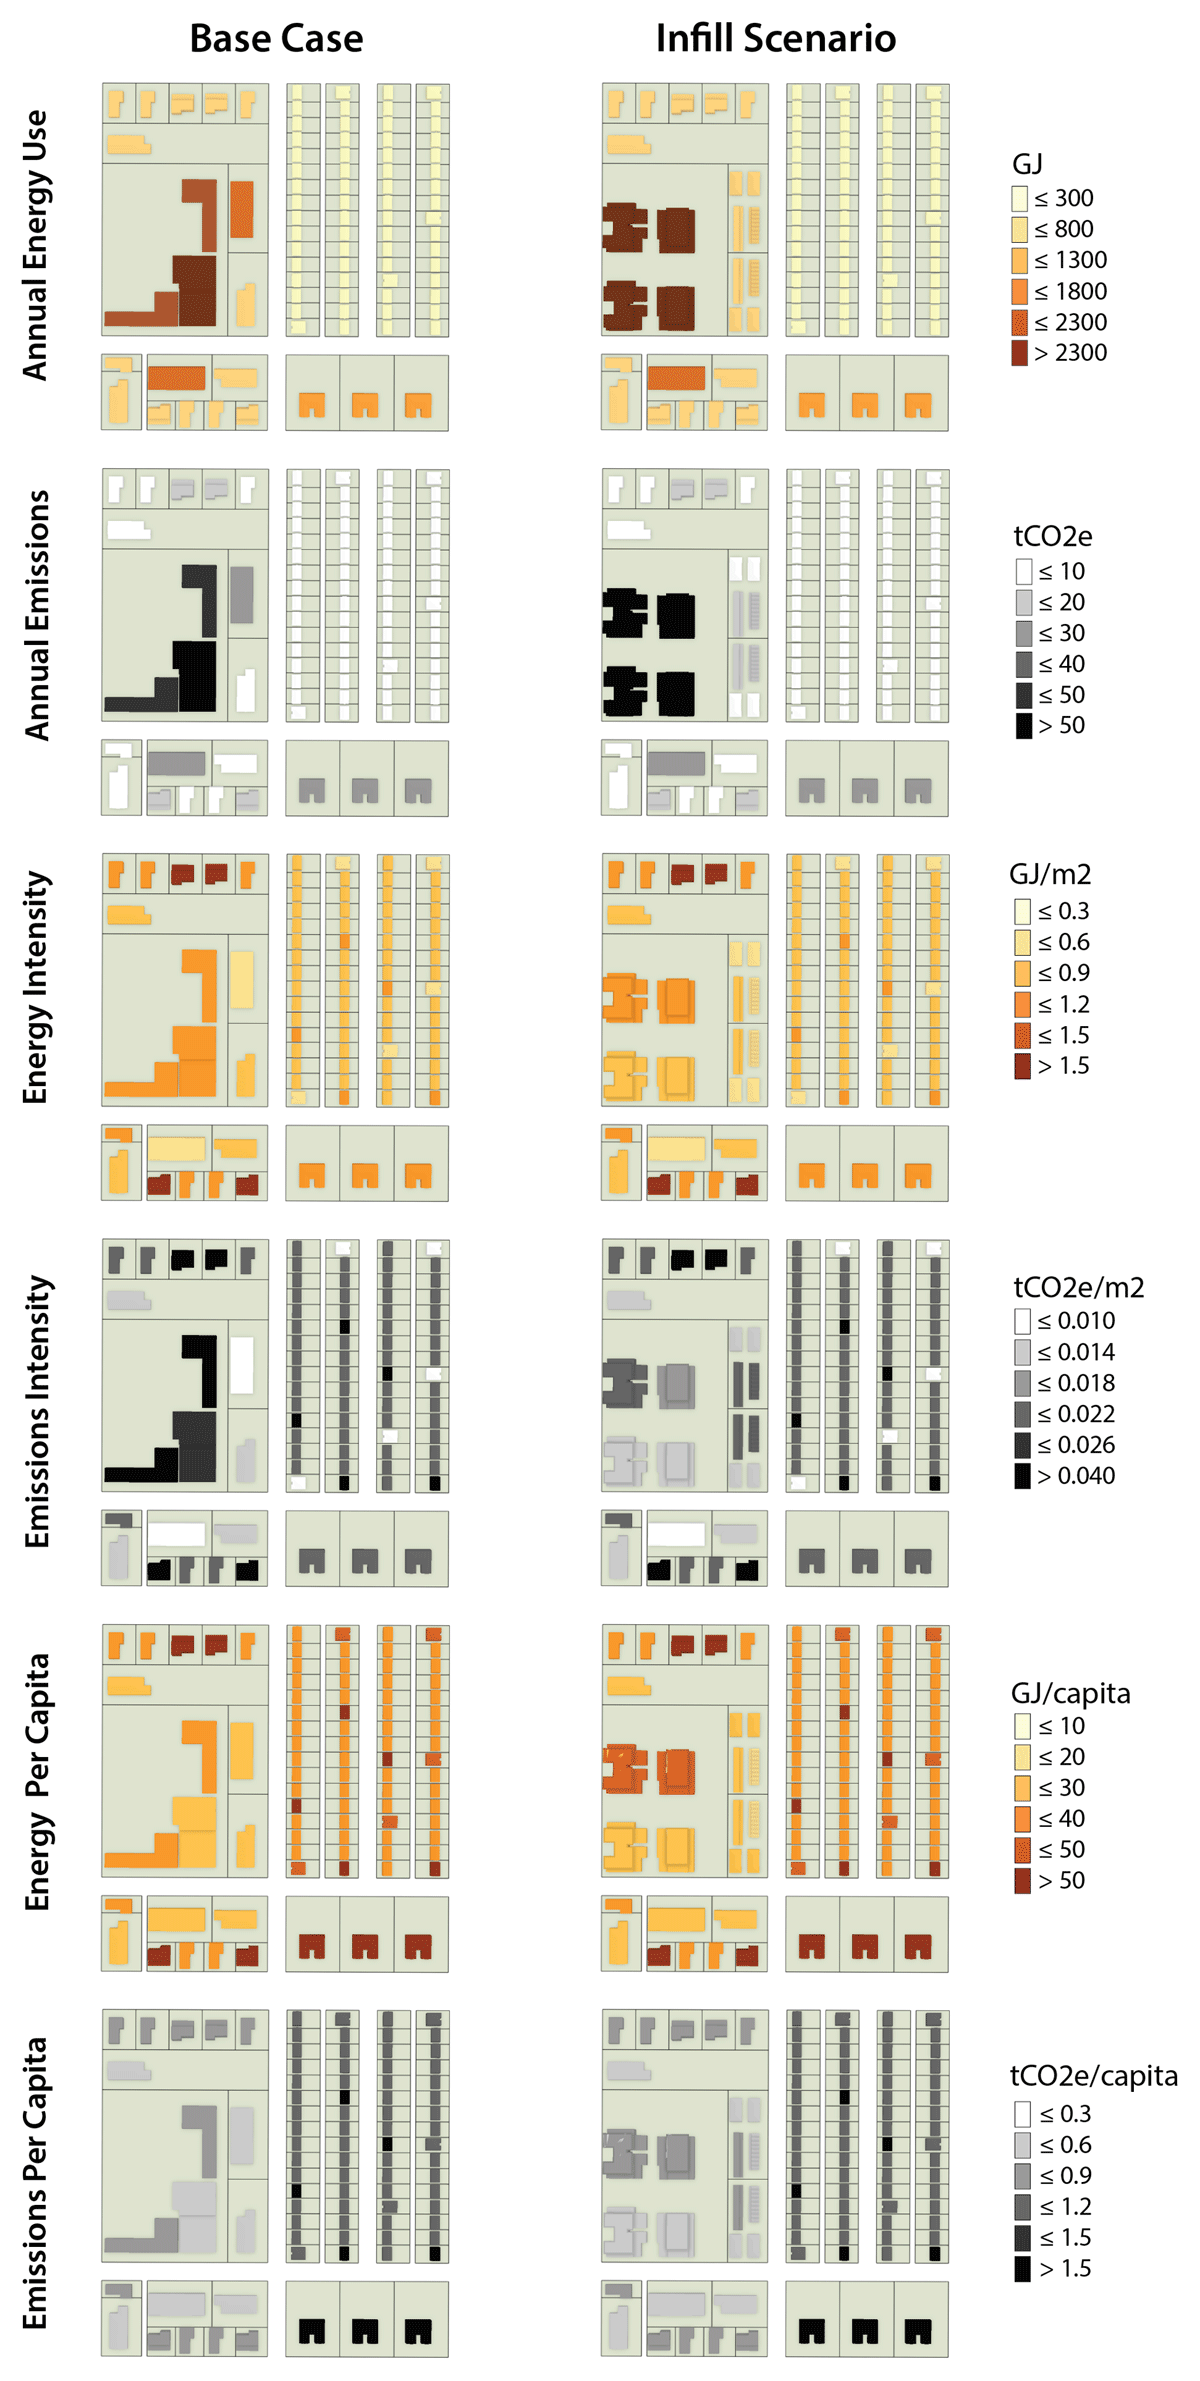
Figure 6
Energy and emissions maps for the commercial pattern base case and infill scenarios.
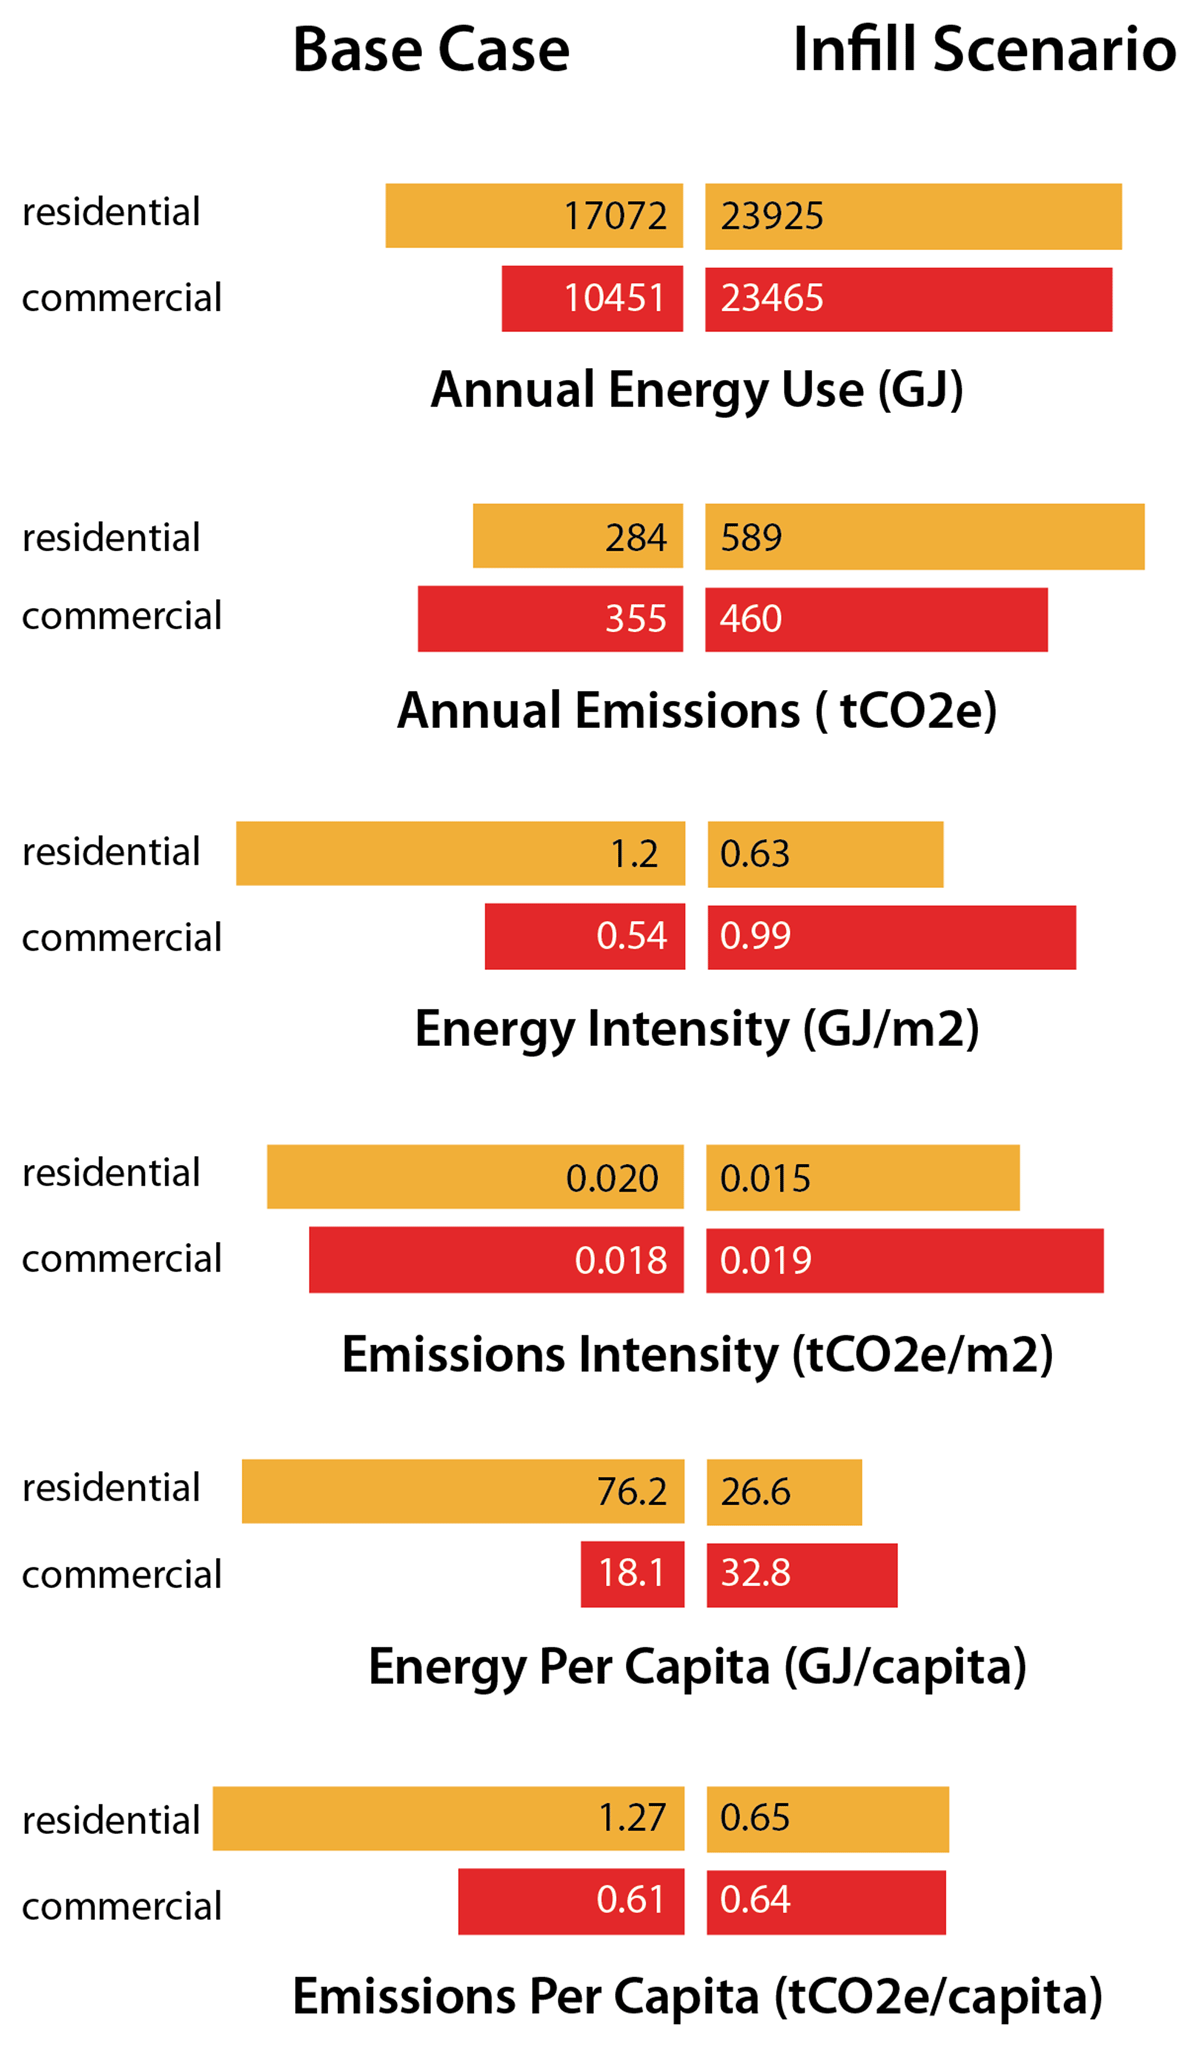
Figure 7
Energy and emissions metrics for the commercial pattern base case and infill scenario.
2.4. Calibration and validation
The validation step was not intended to reconcile measured and simulated results but rather to demonstrate that UMI energy simulation results adequately represent the energy performance at the neighborhood scale in BC for the purposes of comparison. Validation is crucial to UBEM’s development (Reinhart & Cerezo Davila 2016). However, it is not yet possible to validate the simulation results against high-quality energy-use data collected at a given neighborhood scale (Lomas et al. 1997). While UMI has been partially validated in other contexts (Cerezo Davila et al. 2016), it has not been validated for climatic conditions and construction methods in BC. UMI simulations used in the present paper covered four age categories ranging from 1940 to 2020, with three unique building geometries and four floor areas for residential buildings. UMI simulation results were validated against existing real-world energy data sets including Natural Resources Canada’s (NRCAN) Office of Energy Efficiency (NRCAN 2009, 2011), BC Housing (2017), and the US DOE building database (US DOE 2011, 2012). NRCAN and BC Housing data are used to validate residential buildings, while the US DOE database is used for commercial buildings, including food retail, retail and office, respectively (OEE/NRCAN 2009, 2011).
For residential buildings, the authors modelled building stocks that matched the age categories and sizes of the reference data acquired from NRCAN/BC Housing due to the lack of energy performance data of buildings with identical age, geometry and sizes used in the energy simulation. Specifically, each building size was simulated three times to reflect three unique building geometries used in the UMI simulation. EUs from three different geometries were averaged for correlation analysis against NRCAN and BC Housing data. Age category 3 (i.e. 1995–2005) was not included in the validation process because of missing reliable reference data. Commercial buildings were validated directly against the US DOE buildings database. Only buildings located in the same climate zone were selected.
Figure 8 shows the correlation between commercial energy simulation from UMI and the reference data from NRCAN and BC Housing. UMI-simulated EU results have a moderately strong correlation (r = 0.86) against the reference data. Figures 8 and 9 indicate that overall UMI-simulated EU was strongly correlated with all commercial building types against the US DOE with correlation coefficients ranging from 0.88 to 0.98.
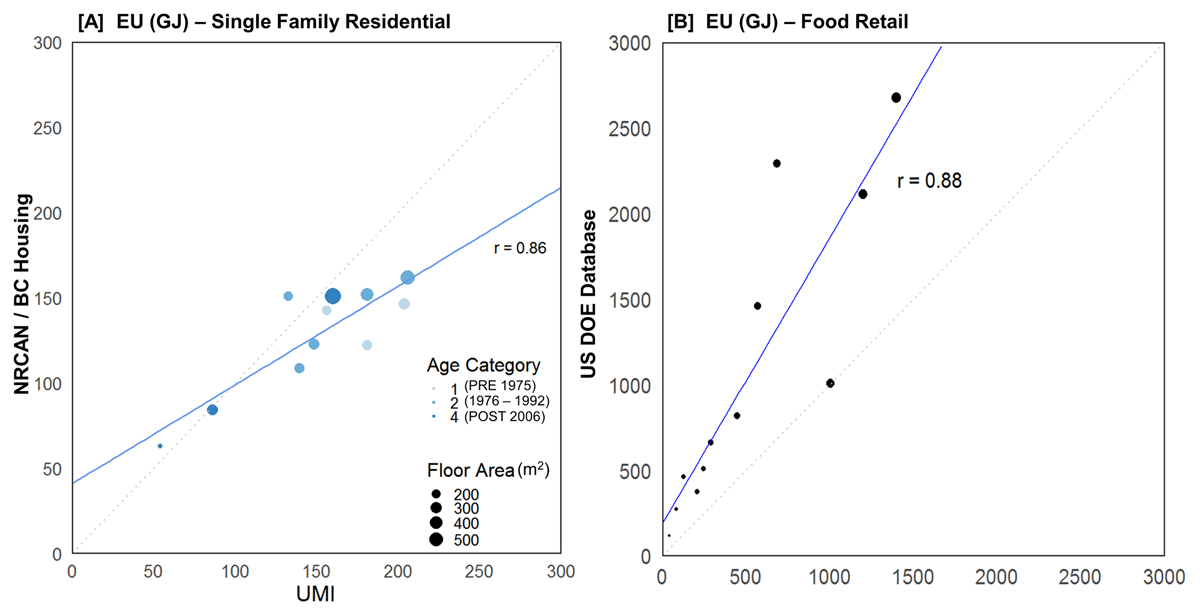
Figure 8
(a) Correlation between the Urban Modeling Interface (UMI) simulation results (x-axis) and reference data from Natural Resources Canada’s (NRCAN) and BC Housing (y-axis) for single-family residential; and (b) correlation between the UMI simulation results and the US Department of Energy (US DOE) for food retail.
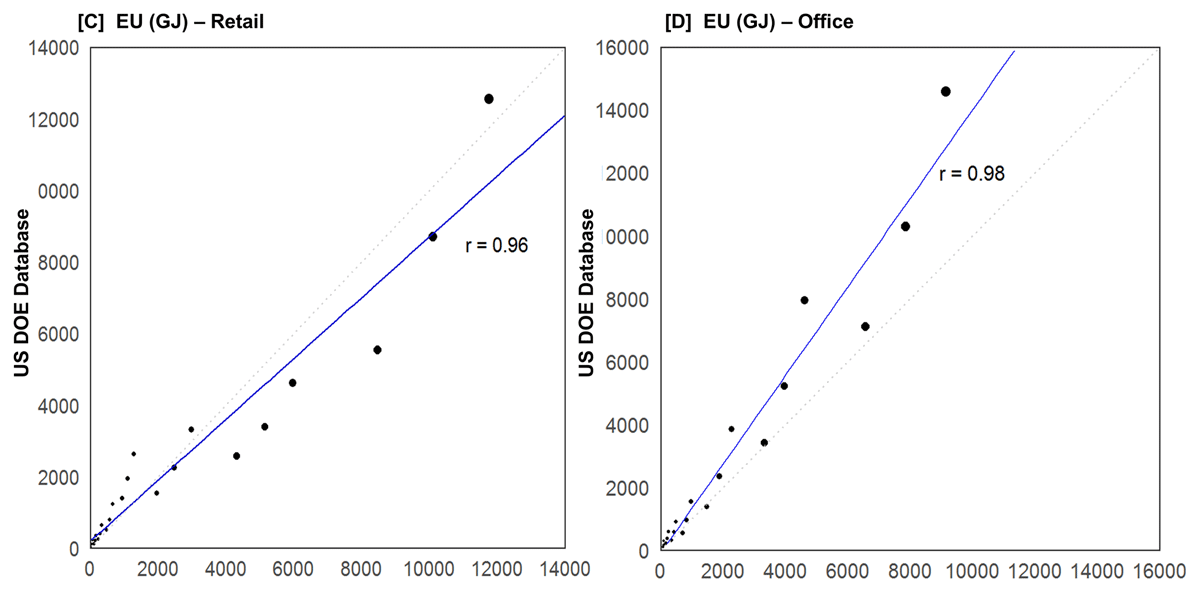
Figure 9
Correlation between the Urban Modeling Interface (UMI) simulation results (x-axis) and the US Department of Energy (DOE) (y-axis): (c) retail; and (d) office.
3 Discussion
This paper presents an approach to iteratively simulate the effect of potential energy and emissions-reducing policy interventions in urban-form patterns representative of BC municipalities, and to improve the understanding of interactions between and among urban form and retrofit technology policy. This framework incorporates technological and urban form factors, identifying urban context and building design (form) and building systems (technology) as categories of energy interactions in the built environment.
A strength of this approach is the use of emerging UBEMs to understand multiple ‘what-if’ scenarios for building emissions. These UBEM approaches make the assessment of integrated future scenarios at urban scales possible in ways that were not previously accessible (Swan & Urgusal 2009; Reinhart & Cerezo Davila 2016). In addition, a ‘pattern-type’ approach can expedite iterative and adaptive consideration of policy options across a diverse range of communities in different geographic contexts, including those that have neither the resources nor the data to undertake locally specific scenario modeling exercises. As these scenarios are spatial and visualised at a neighborhood scale, they also provide planners and decision-makers the opportunity to consider implications of urban form variations together with energy and emissions performance. For example, are retrofit and technology approaches associated with incremental infill and building-renewal policies distributed across a neighborhood more or less effective than densification and elevated building standards approaches associated with concentrated growth management policies? And which combinations of policy strategies yield better overall energy performances at a neighborhood scale?
To date, the project has been confined to building-related energy and emissions impacts of urban form. Extensive related research considers the impact of urban form on mobility-based energy demand and related emissions (Silva et al. 2017), which, in some BC communities, can exceed those of buildings. While effort is underway to bring building and transportation energy demand and emissions simulation together, the results are not yet available. Within the realm of building-scale energy demand, there are challenges of calibration with engineering models predicated on extensive, and sensitive data inputs. As the purpose of this research is not to accurately predict the energy performance of buildings at neighborhood scales, but rather to compare the relative magnitudes of different interventions, effective calibration and validation that are still critically important to that comparison. However, even with that caveat, behavior-related variables such as occupant schedules remain problematic, leading to significant variation in comparative results (Swan & Urgusal 2009; Nouvel et al. 2013, Reinhart & Cerezo Davila 2016). This aspect of the study can be tempered using validated statistical models of urban energy demand developed by others (e.g. Tooke, van der Laan, & Coops 2014; Zuehlke, Jaccard, & Murphy 2017), and avenues for validation beyond those discussed in section 2.4 are being explored.
Energy and emissions implications are but one arena of considerations that shape the performance attributes of the built environment. Equally important are the broader social frames within which decisions about the planning, design and operation of the built environment are made. People, broadly speaking, do not make decisions about where, or how, to live based on energy or emissions information. They are far more likely to renovate their house for amenity and livability, rather than energy or emissions-related reasons (Wilson & Dowlatabadi 2007). Effective policy-relevant energy and emissions reducing solutions for the built environment will also need to consider these livability considerations in parallel. Current efforts in this research investigate linkages between spatial indicators of livability and energy and emissions intensity. Using the methods demonstrated, this paper is simulating future ‘what-if’ urban form development patterns using larger composites, and measuring both energy and emission against a set of spatial livability indicators.
4 Conclusions
A simplified urban building energy model (UBEM) method was developed for seven common urban neighborhood patterns (400 × 400 m). Practical urban policy strategies were then applied to a spatial modeling approach. This allows municipalities to consider future energy and emissions policy options iteratively from individual buildings to the neighborhood scale in a proxy context similar to their own. Validation using real-world data suggests that the simulated energy consumption was accurate in neighborhoods with relevant building types, ages and climate conditions.
It was found that retrofitting and replacing existing buildings achieved only moderate energy and emission reductions due to the ‘rebound effect’, where the improved energy efficiency and new homes were counteracted by growing house sizes. On the other hand, the infill redevelopment scenario decreased both energy and emissions per capita in residential buildings. Behavior factors and issues of neighborhood livability are undoubtedly important in terms of public acceptance and uptake, but outside the scope of this study. Additionally, mobility-based energy demand and emissions are clearly important in the energy and emission context, but not considered in this study because of the spatial scale of the current model (400 × 400 m).
As demonstrated in the illustrative simulations presented in section 2.3, this work enables iterative and valid simulations of specific energy policy consequences of building retrofit and land-use changes. In response to many municipalities’ mandates regrading energy and emissions reducing policies in their community planning, the methods developed in this paper and the preliminary results offer a flexible yet consistent, realistic and accessible approach to test different municipal policy options for cities of differing sizes, geographic and climatic contexts.
Acknowledgements
The authors thank the anonymous reviewers for their constructive comments and critiques.
Competing interests
The authors have no competing interests to declare.
Funding
The authors thank the Pacific Institute for Climate Solutions (PICS) for funding this research (grant number PICS 36170–50280). They thank the Environmental Systems Research Institute (ESRI) Canada and the Natural Sciences and Engineering Research Council (NSERC) for funding portions of the tool development and related research.