
1. Introduction
Natural ventilation plays a crucial role in maintaining a healthy indoor environment by controlling temperature, humidity and pollutant concentrations (ASHRAE 2019; CIBSE 2015; Emmerich 2001; Wargocki et al. 2002). Although the broader relationship between natural ventilation, indoor air quality (IAQ) and health is well-established (Dimitroulopoulou 2012; Sundell et al. 2011; Van Tran et al. 2020), its significance became more evident during the COVID-19 pandemic as inadequate ventilation heightened infection risks (Zhuang et al. 2022).
Designing natural ventilation involves a systematic process, where designers size openings using existing airflow models to ensure adequate ventilation (Figure 1). This study focuses on this aspect of the design process, particularly on window sizing in shelter design.
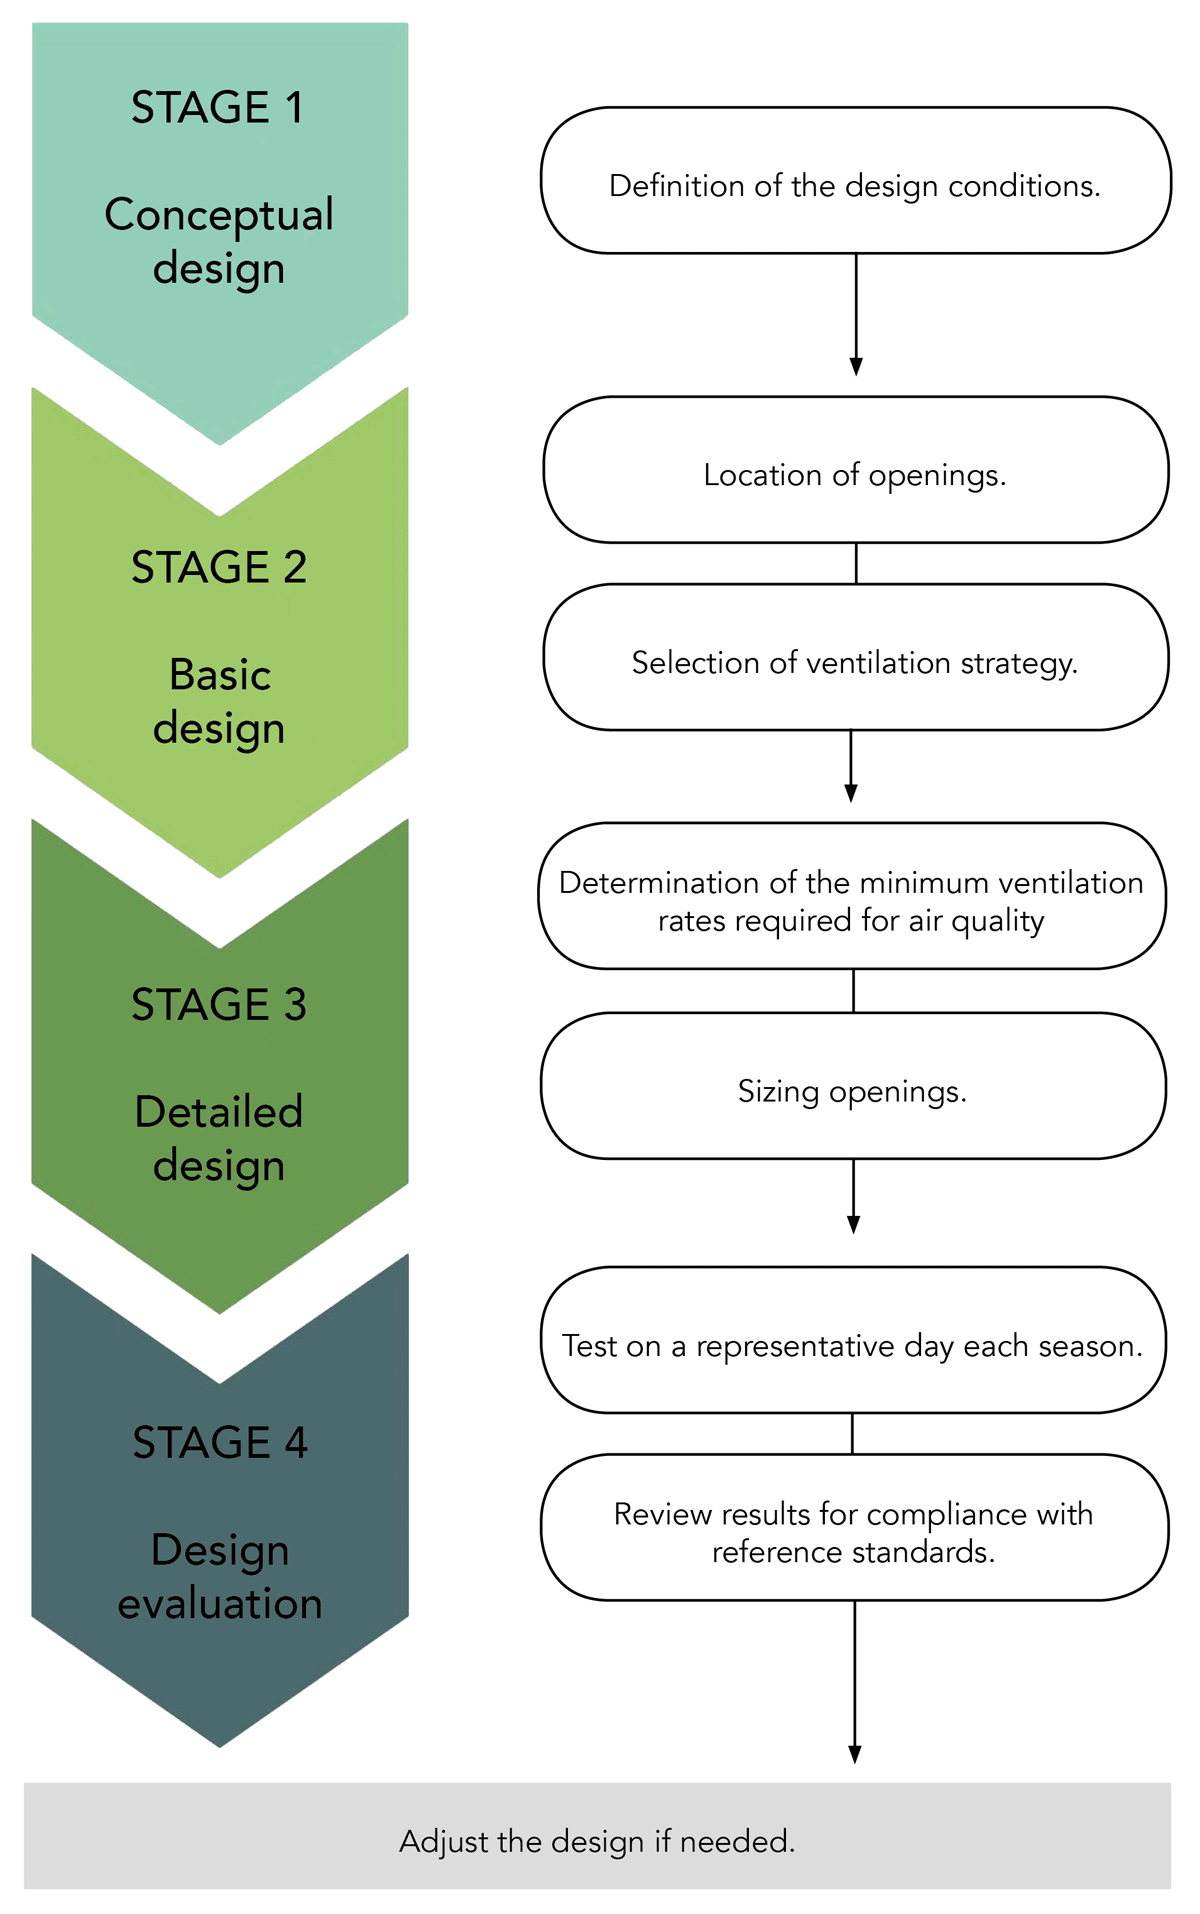
Figure 1
Flow diagram of natural ventilation design.
Determining the optimal size and placement of openings during the early design stages is challenging (Sacht & Lukiantchuki 2017). This complexity arises from the dynamic nature of air and heat flows, whose variables create complex airflow patterns and thermal layers within spaces (Baeumle 2019). To address these challenges, designers can use guidelines, which are the most simplified tools available (ASHRAE 2019, 2021a, 2021b; CIBSE 2015). However, the limitations of such guides are reflected in updates to ANSI/ASHRAE Standard 62.1–2019 (ASHRAE 2019), which notes, for example, that the historical rule of thumb of 4% of floor area lacks a recorded scientific basis.
Along with the guidelines, analytical, experimental and numerical models have been developed. For simplicity, this paper refers to these models as simplified models (da Graça & Linden 2003), and contrasts them with more complex airflow networks (AFNs) or computational fluid dynamics (CFD). While complex airflow models provide valuable insights into ventilation flows (Attia et al. 2012), their complexity and the required specialised knowledge limit their application in shelter design (de Castro et al. 2021). Architects often lack training in shelter design, and aid agency staff may not have the engineering expertise to use these tools (Kuchai et al. 2024). Therefore, there is a need for simpler, faster and more accessible simulation tools that accommodate the diverse users involved in shelter design (Attia et al. 2012; Botchway et al. 2023). These tools would enable non-specialists to create effective and sustainable shelter solutions for displaced populations (Kuchai et al. 2020; Matard et al. 2019; Sechi et al. 2023).
This paper establishes a foundation for the use of simplified airflow models as a promising approach to address the research question: to what extent can simplified airflow models inform shelter design on opening sizing for adequate ventilation? Its objectives are as follows:
To review models for sizing openings for natural ventilation under common ventilation regimes in shelters.
To select the best-in-class ‘simplified’ models with the potential to be applicable under the constraints of existing shelter design processes.
To evaluate whether the use of selected simplified models would lead to the same shelter design decisions as AFNs in specialist models such as Contam (CN) and EnergyPlus (EP).
The paper is structured as follows. Section 2 reviews the opening sizing models for natural ventilation. Section 3 outlines the methodology for evaluating simplified models, including simulations with CN and EP. Section 4 presents the results and evaluations. Section 5 discusses the results. Section 6 concludes the study.
2. Background
While numerous studies have reviewed natural ventilation models in buildings, few have specifically addressed their application to window sizing. A review of the existing models was conducted using Web of Science in June 2024, yielding 193 relevant papers and additional resources (British Standard 1991; UK Government 2022; ASHRAE 2021a; Liu 2022).
Relevant simplified models for opening sizing are summarised in Table S1 in the supplemental data online.
These simplified models have evolved from two main theories: Cockroft’s pulsation theory (Cockroft & Robertson 1976, Cockroft 1979) and Warren’s (1977) mixing theory. Cockroft’s model, derived from wind tunnel experiments, was accurate only for a wind incidence angle of 0° (Yamanaka et al. 2006), and Liman & Abadie (1998) found it was not appropriate for design purposes.
Warren’s mixing theory provides another approach for wind-driven ventilation:
where FL is the flow coefficient (–), URef is the reference wind speed (m/s) and UL is the local wind speed (m/s). Building on Warren (1977), Wang & Chen (2012) introduced an extended model to account for pulsating flows and eddy penetration:
where l is the opening width (m), CP is the wind pressure coefficient (–), z is the position of the wind at the building (m), z0 is the position of the neutral plane level (NPL) (m), zref is the reference value at 10 m and is the mean wind speed (m/s).
For ventilation driven by buoyancy, Warren’s initial model calculates airflow as:
where Δθ is the temperature difference between indoor and outdoor temperature (K), g is the gravitational acceleration (m/s2), H is the opening height (m) and is the mean between indoor and outdoor temperature (K).
This model was reviewed by Linden et al. (1990) and further developed by Terpager Andersen (1998) into a fully mixed buoyancy-driven model that extends the Warren model if a non-uniform indoor temperature is assumed. Li (2000) improved upon these models, giving the airflow through an opening as:
where B is the buoyancy flux, θo is the reference temperature, typically the outdoor air temperature (K), ha is the height between the two vertical openings (m), hc is the clean zone height (m) and λ is a parameter that measures the uniformity of air temperature in a building, with 0 < λ < 1.
While traditional models have treated wind- and buoyancy-driven ventilation separately, later studies have introduced combined models. The first combined model, developed by Phaff & De Gids (1980), accounted for both wind and buoyancy effects, and Larsen & Heiselberg (2008) improved its accuracy by incorporating wind direction and angle, achieving a 23% uncertainty. These studies revealed that temperature differences significantly affect airflow at low wind speeds, with the impact diminishing at higher speeds.
Researchers such as Li & Delsante (2001) expanded these models, offering solutions for buoyancy-driven flow under varying wind conditions, considering factors such as solar radiation and heat conduction loss. However, according to Terpager Andersen (1998), clear solutions are only possible if the initial temperature difference is known. Further studies on buoyancy flow under unsteady wind conditions (Chiu & Etheridge 2004; Etheridge & Sandberg 1984) lead to a semi-empirical model predicting ventilation rates based on fluctuating pressure for wind incident angles between 0 and 180° (Chu et al. 2011, 2015).
Hunt & Linden (1999) further developed a mathematical framework for combined ventilation, establishing that the combined ventilation velocity can be expressed as:
This Pythagorean relationship simplifies the analysis of combined forces, especially when CD is constant. Davies Wykes et al. (2020) expanded on this, demonstrating that the relative importance of wind and buoyancy can be characterised by the Froude number (Fr):
where g′ is the reduced gravity (m/s2) and h is the height of the window (m). For Fr > 1, ventilation is wind-dominated; for Fr < 1, buoyancy effects prevail. Their findings validated that a discharge coefficient of CD = 0.6 remains applicable across a wide range of scenarios, supporting the use of sharp-edged orifices in simplified models.
Simplified models frequently adopt a constant CD, which is both theoretically justified and supported by experimental data. As Hunt & Linden (1999) highlighted, the effective area of openings (A*) integrates CD to account for contraction effects and turbulent dissipation:
where ΔP is the pressure difference across the openings. This approach allows for streamlined, yet accurate, calculations of ventilation rates, making it particularly relevant for resource-constrained contexts such as shelter design.
The latest revision of EN 16798:2017 (CEN 2019) further refines these models by introducing a calculation for single-sided ventilation:
where ρa,ref and pa;e are the reference and external air densities (kg/m3), Cwind is the wind speed coefficient (–), Cst is the buoyancy constant (–) and hw;st is the useful stack effect height for airing (m). Caciolo et al. (2011) compared the Warren (1977), Phaff & De Gids (1980) and Larsen & Heiselberg (2008) models against experimental data to evaluate their accuracy in predicting air change rates in single-sided natural ventilation. The experiments, conducted in a full-scale room with various window configurations, measured air change rates under different wind speeds, directions and temperature differences using the gas tracer decay technique. The Warren model demonstrated the highest overall accuracy, especially for windward openings, closely matching the experimental data. However, all models tended to overestimate air change rates for leeward openings, with the Larsen and Heiselberg model showing the largest deviations. This indicates that while current models are reliable in some conditions, they need refinement to improve accuracy in more complex scenarios, particularly when wind effects are less direct (Caciolo et al. 2013).
Reviewing existing models revealed that while they provide valuable insights into natural ventilation, their practical application, such as in window sizing, poses challenges. Accurately predicting the size of the openings, especially when considering the combined effects of wind and buoyancy, highlights the limitations of current models. For instance, the Warren model (Warren 1977; Warren & Parkins 1985) is effective in windward scenarios but it tends to overestimate in leeward conditions, indicating a need for refinement. Similarly, while the Phaff & De Gids’ (1980) model offers a more nuanced approach by incorporating wind direction and incidence angles, it still falls short in certain contexts, particularly where direct wind effects are minimal. Overall, the Warren model is particularly comprehensive, covering simplified ventilation layouts as classified by Daish et al. (2016).
3. Methods
This study helps designers size openings for effective natural ventilation and IAQ by focusing on simplified airflow models that balance comprehensive airflow considerations with ease of use. Although the present approach does not address thermal performance improvement in shelters—which is already covered in the literature (de Castro et al. 2021; Fosas et al. 2019)—it is acknowledged that thermal effects can significantly influence natural ventilation, particularly in non-wind-driven scenarios. To manage the complexity of these thermal effects, a tiered modelling approach was employed. At the simplest level, the Warren model is used, which assumes a well-mixed scenario and excludes viscous and buoyancy effects, making it accessible for design. Recognising the importance of thermal effects, CN and EP are also incorporated. Unlike EP, which fully solves for thermal exchanges, CN allows one to account for these effects without significantly complicating the model inputs. This study establishes a progression of model complexity, with the Warren model being the simplest, followed by CN, and then EP as the most detailed. This structure enables systematic management of thermal effect complexity and provides designers with clear guidance on simplifying thermal interactions, such as using a predetermined temperature difference, without compromising the reliability of the ventilation design. The significance of this study lies in balancing model simplicity with accuracy, especially when the degree of thermal effect simplification is uncertain.
The present methodology applies to naturally ventilated, single-zone, single-storey buildings with a length-to-width ratio between 1:1 and 2:1, and sharp-edged openings with a width-to-length ratio between 0.2 and 1. The selected airflow models assume a well-mixed scenario, neglecting viscous and buoyancy effects. First, the selected simplified models shown in Table S1 in the supplemental data online are evaluated by comparing their performance against CN simulations to determine the most suitable model. Due to their simplicity and reliability, using Warren’s equations this study explores developing accurate, science-based guidelines for opening sizing in shelter design. The equations are assessed against two AFN models, EP and CN, using a three-step framework.
3.1 Selection of a simplified model
The present study selected the models of Warren (1977) and Warren & Parkins (1985) as the ‘simplified’ ones because they outperform alternatives in the literature (see Section 2). Here those findings are extended by comparison against results from CN (Table 1). Taking CN as the ground truth, the Warren model always outperforms the other selected simplified models. Hence, this work adopts the Warren model exclusively in comparison against CN and EP (objective 2).
Table 1
Performance of the selected simplified models for airflow.
| DRIVING FORCE | VENTILATION LAYOUT | EXPECTED % OF TIME CO2 > 1000 ppm | MODELa | AREA (m2) | % OF TIME CO2 > 1000 ppm (CONTAM) |
|---|---|---|---|---|---|
| Wind | Single-side, one opening | 6.68% | Warren | 1.80 | 0.02% |
| Wang and Chen | 1.36 | 0.02% | |||
| Buoyancy | Cross-ventilation | 0.01% | Warren | 0.32 | 2.22% |
| Li and Delsante | 0.22 | 9.59% | |||
| Combination of forces | Single-side, one opening | 0.01% | Warren | 0.96 | 0.82% |
| EN 16798-7:2017 | 0.79 | 6.18% |
[i] Note: The included models were selected through a review of the literature.
aFor models, see Table S1 in the supplemental data online.
3.2 Framework
To establish the adequacy of the simplified models for sizing openings for natural ventilation, a three-step framework is used (Figure 2):
Calculation of minimum ventilation rate and opening area
To maintain acceptable IAQ, the required air changes per hour (ACH) are calculated and the minimum opening area needed for each case study is determined. The resulting area corresponds to the minimum size for openings that should remain permanently open.
Recent developments following the COVID-19 pandemic highlight the importance of prioritising ventilation rates over relying solely on CO2 concentration levels. Recommendations from The Lancet COVID-19 Commission (Sachs et al. 2022) emphasise ventilation rates of 30 cubic feet of air/min per person (14 l/s per person) in indoor spaces as a benchmark to mitigate airborne transmission risks effectively. These more stringent standards surpass the ventilation rates specified in most current building regulations, which predominantly rely on indoor CO2 thresholds or 7.5 l/s per person and have not been updated to reflect the lessons learned during the pandemic.
This study adopts both approaches:
CO2-based calculations: opening sizes are calculated based on maintaining CO2 levels < 1000 ppm
ventilation rate-based calculations: opening sizes are derived to meet the 14 l/s per person benchmark.
The worst-case scenario (the smaller opening area) is selected for probabilistic testing through computational simulations. This ensures that designs are robust enough to satisfy the higher ventilation demands of post-COVID-19 benchmarks, as larger openings inherently deliver higher airflow rates.
Shelter simulation
Five airflow scenarios are simulated using EP AFN and CN.
Assessment
Indoor CO2 concentration is used as a key parameter to evaluate the effectiveness of simplified models in determining appropriate opening dimensions for shelters. The percentage of time that indoor CO2 levels remain < 1000 ppm for each model is assessed. A 10% threshold is adopted, meaning if CO2 levels exceed this limit for less than 10% of the time, the model is considered sufficiently accurate for design purposes. This threshold is justified by Etheridge’s (2011) argument that natural ventilation design can tolerate a margin of error of up to 10%, given the complexity and variability of real-world conditions. This approach prioritises the overall performance and practical effectiveness of the models in maintaining acceptable IAQ, rather than focusing on precise accuracy in every situation.
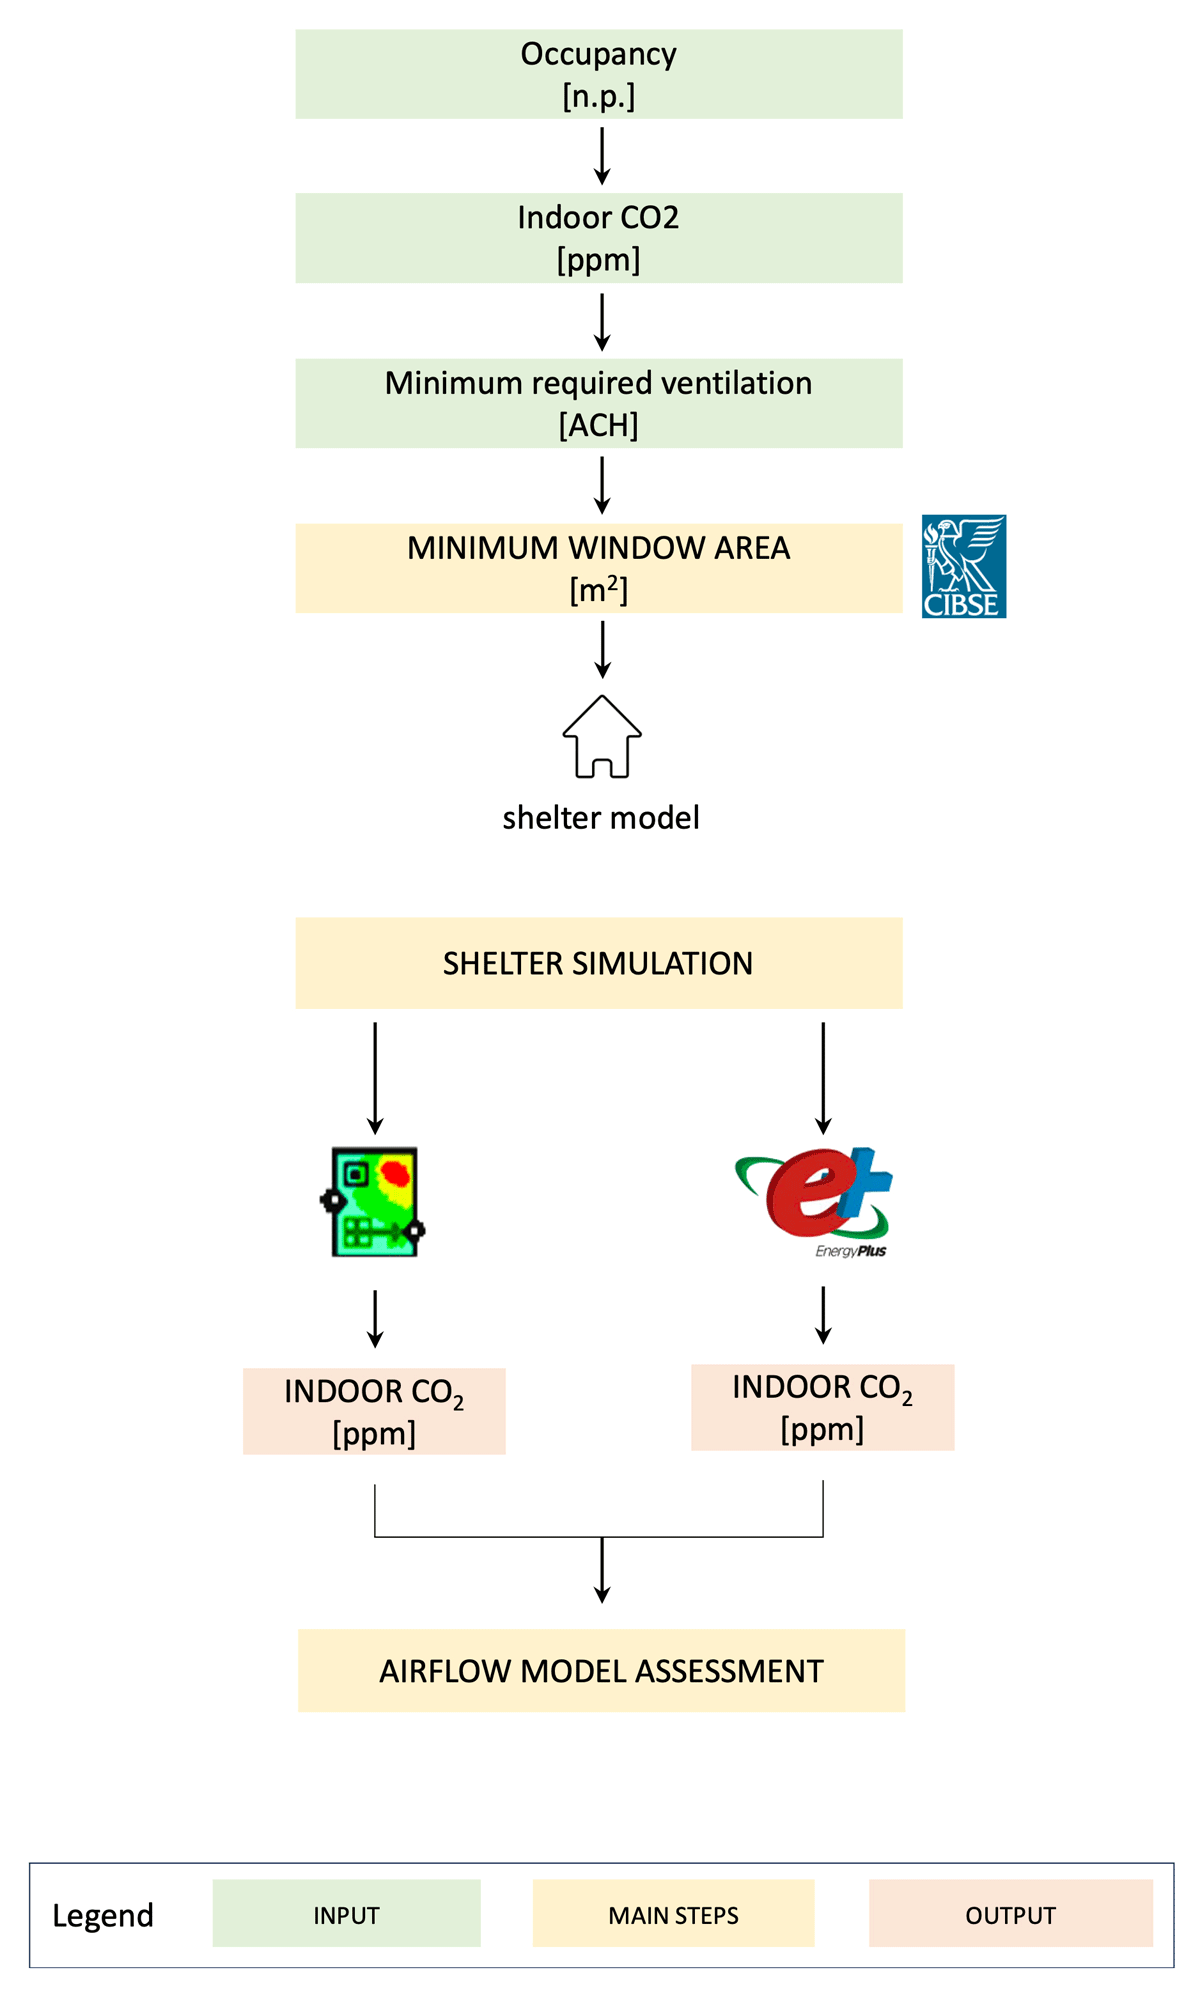
Figure 2
Framework for assessing opening area sizing for adequate ventilation.
Five distinct ventilation scenarios are considered (Figure 3):
single-sided ventilation with one opening, wind-driven (S01)
cross-ventilation, wind-driven (S02)
single-sided ventilation with one opening, buoyancy-driven (S03)
single-sided ventilation with two openings, buoyancy-driven (S04)
cross-ventilation, buoyancy-driven (S05).
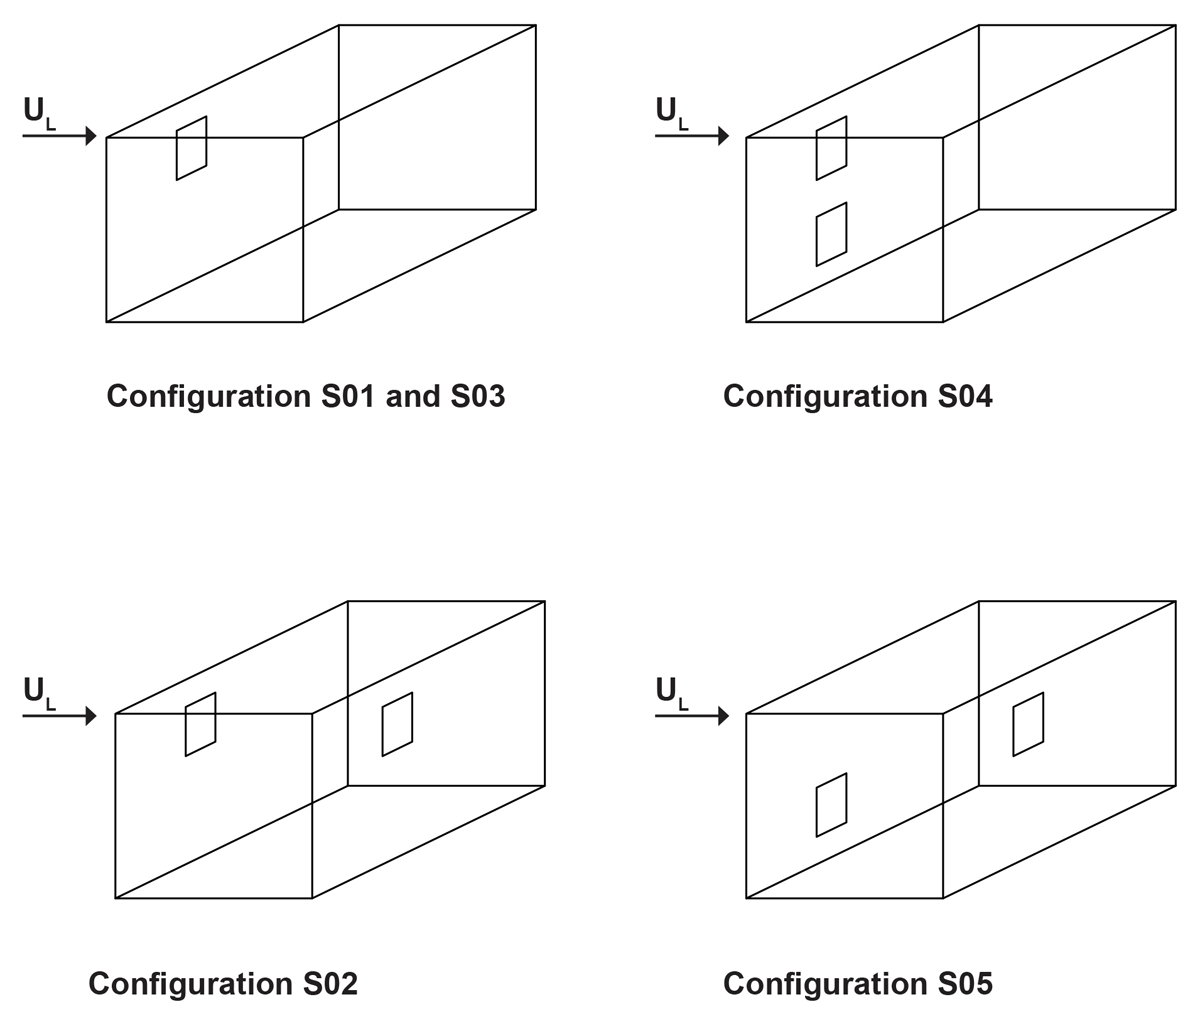
Figure 3
Opening configuration for key natural ventilation mechanisms in shelters.
Note: UL = local wind speed (m/s).
3.3 Selected parameters
This study compares the Warren model with more complex AFN models to evaluate their performance in natural ventilation design. The equations governing these models are detailed in Section 2, so they will not be reproduced here. Instead, the focus is on selecting key parameters common to both the simplified and the AFN models to ensure a consistent basis for comparison. These parameters (see Table S2 in the supplemental data online) are critical in both modelling approaches and form the foundation of the present simulations.
Local wind speed (UL) and reference wind speed (URef)
The simulations aim to keep indoor CO2 levels < 1000 ppm most of the time. For S01 and S02, the opening is sized using a conservative approach, and a wind speed of 0.5 m/s, which occurs in 6.68% of cases, is selected (Figure 4a). This choice should ensure adequate ventilation and limit CO2 levels > 1000 ppm to a minimal duration.
Flow coefficient (FL)
Analytical estimates of FL for a planar orifice range from 0.013 (Warren & Parkins 1985) to 0.051, closely aligning with experimentally derived values between 0.025 and 0.06 (Kato et al. 2006; Warren & Parkins 1985; Yamanaka et al. 2006). This study adopts an FL = 0.025 for low-rise buildings with a UL/URef ratio > 0.25, ensuring consistency with AFN models that also maintain this ratio with terrain-corrected wind speeds. A value of 0.025 was originally proposed by Warren (1977) as a simplification of the complex interactions between wind-driven ventilation and local wind conditions for practical design purposes. This approach allows designers to estimate ventilation rates for single-sided ventilation effectively without requiring detailed local wind data, making the model both accessible and sufficiently accurate for most design needs.
Wind pressure coefficient (CP)
CP is influenced by building geometry, facade details and wind conditions. Both models use simplified CP representations. This study adopts CP data from Liddament (1986) for the simple, block-shaped, low-rise shelter.
Discharge coefficient (CD)
For sharp-edged openings, CD = 0.61 is used, based on research by Shaw & Whyte (1974), which is relevant to the openings analysed in this study.
Outdoor temperature
Airflow is primarily influenced by the temperature difference between indoor and outdoor environments, driving buoyancy. AFN models use outdoor temperatures from weather files, while simplified models use the lowest mean temperature between indoor and outdoor environments.
Temperature gradient (Δθ)
For stack-driven scenarios (S03–S05), openings are sized based on a 3 K temperature gradient between indoor and outdoor environments, following a worst-case assumption for buoyancy-driven ventilation. With a minimum mean temperature of 16°C, occurring only 0.01% of the time (Figure 4b), this sizing is expected to maintain CO2 levels < 1000 ppm (Figure 5).
Neutral plane level (NPL) and vertical distance between openings (ha)
Stack effect ventilation depends on the size of openings, the vertical distance between them and the temperature difference. NPL calculations guide the strategic placement of these openings. For equally sized openings, the NPL typically lies midway between them, shifting with changes in opening sizes (Linden et al. 1990; Liu 2022).
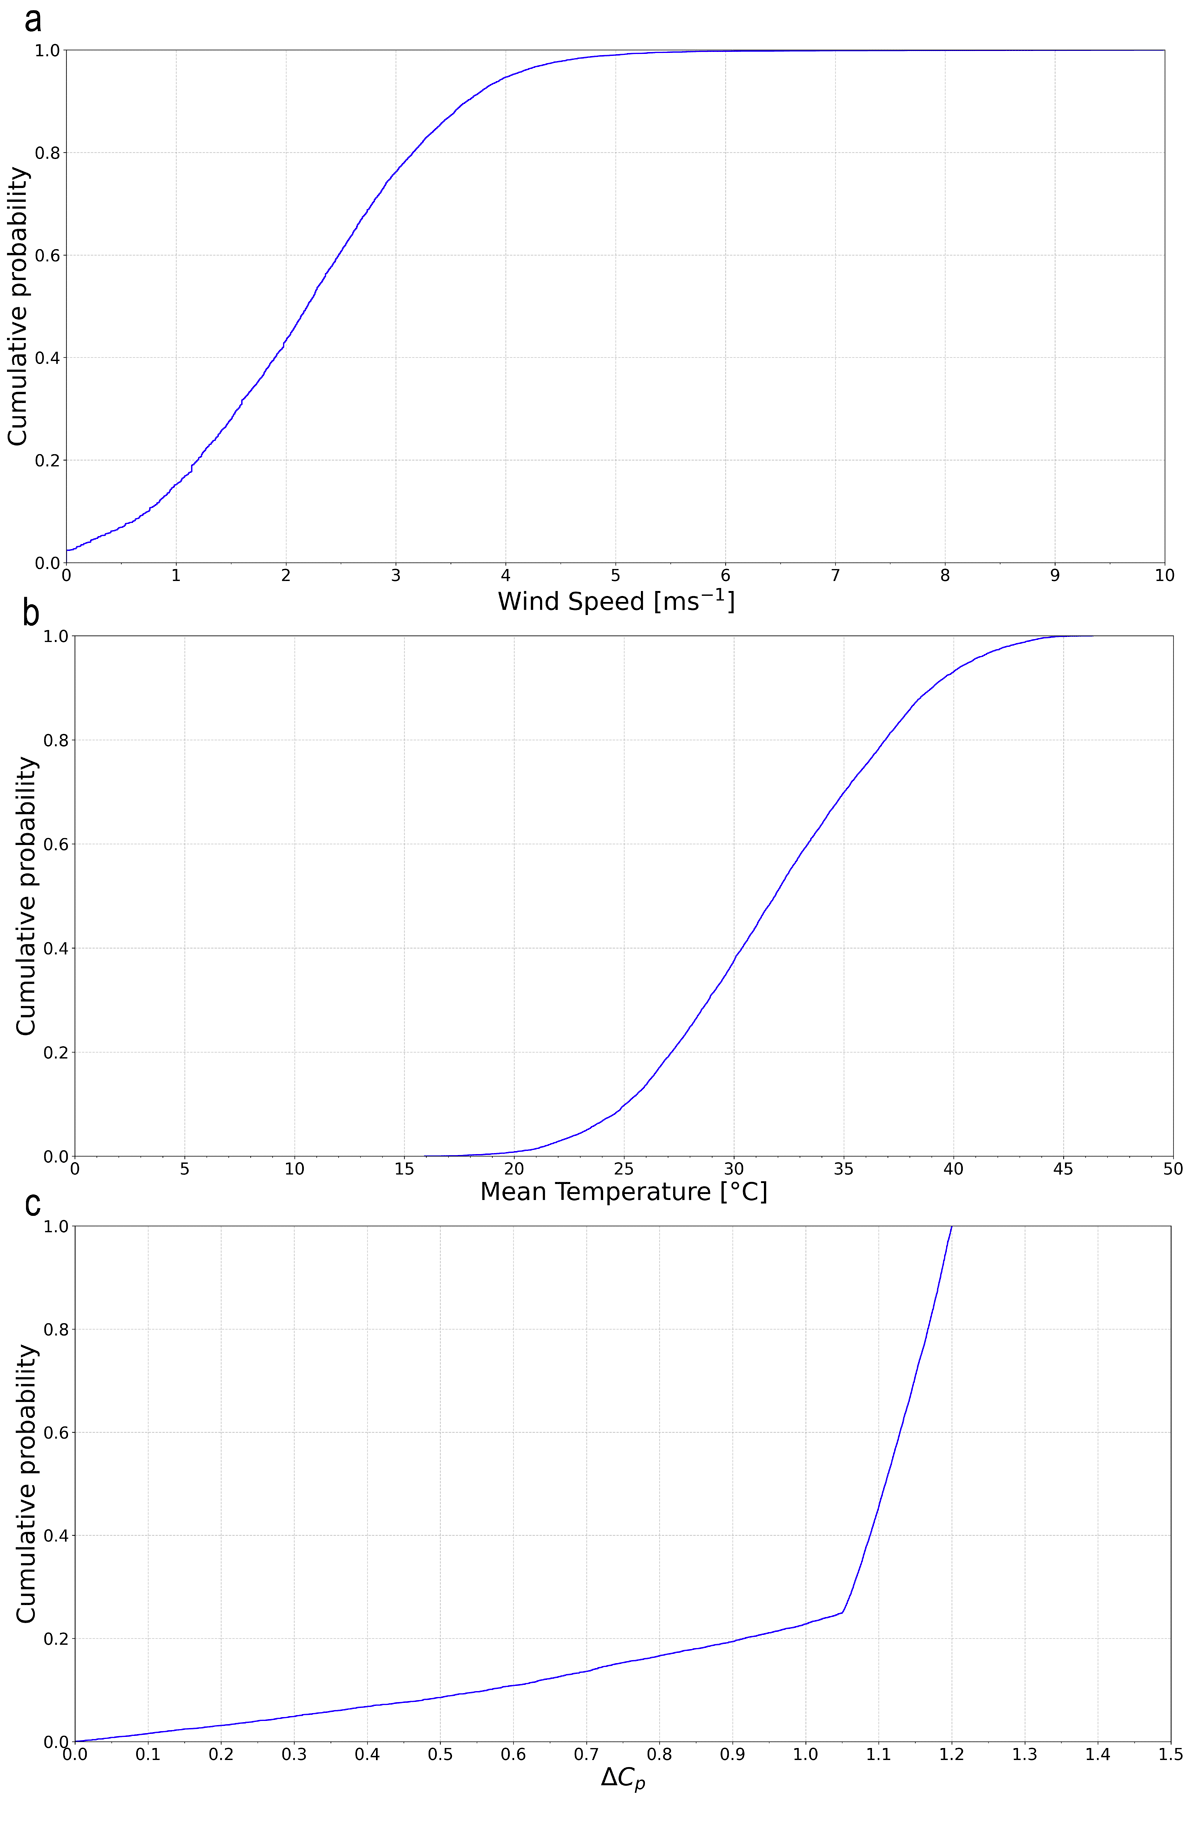
Figure 4
Cumulative distribution of (a) local wind speed (URef); (b) the mean between outdoor and indoor temperatures () (the indoor temperature is calculated by summing 3 K to the outdoor temperature in the weather file); and (c) the difference between the wind pressure coefficients (ΔCP) of the two openings in the cross-ventilation, wind-driven case (S02).
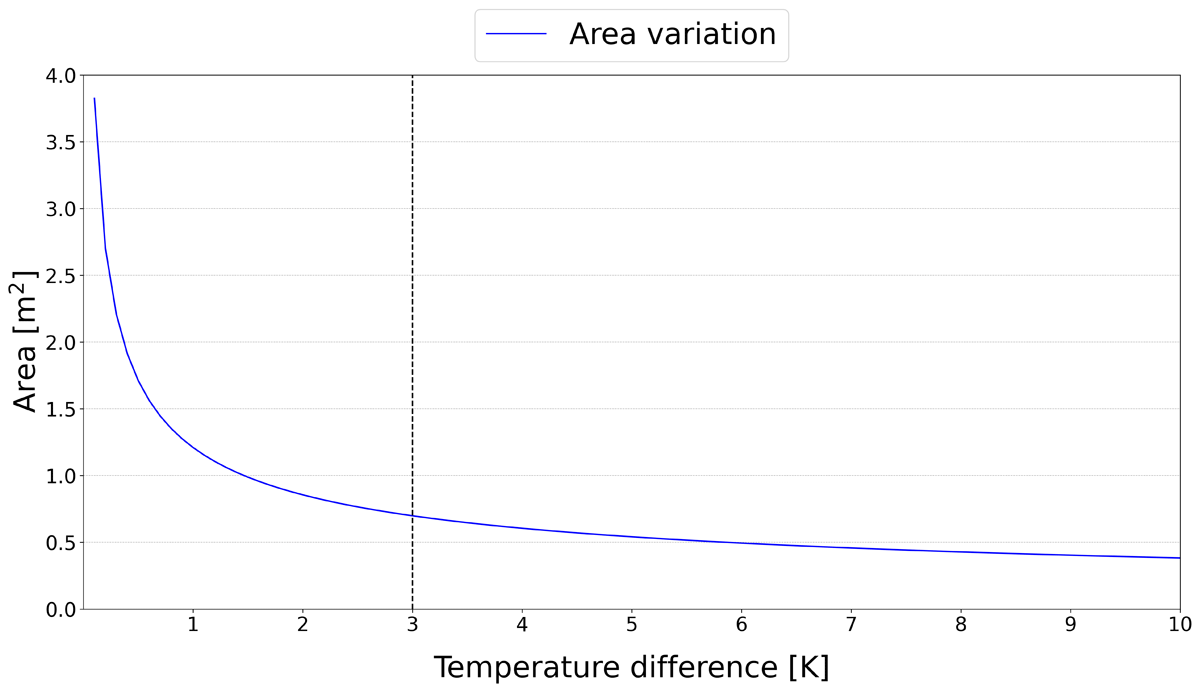
Figure 5
Opening area variation under different temperature differences (Δθ).
Note: The vertical line shows the selected temperature difference of 3 K.
Other parameters adopted in the framework are the following:
Occupancy
A mean of six occupants, as indicated by Albadra et al. (2020b), with a noted peak shelter occupancy of 25. Despite this, the opening area calculated to maintain CO2 levels < 1000 ppm (3.4 m2) suggested that large openings are impractical for compact shelter dimensions under a single-side ventilation mode.
Constant occupancy
The shelter is modelled as continuously occupied by six individuals.
CO2 generation rate
Set at 0.0045 l/s per person, aligning with an activity level of 126 W, in accordance with the standards outlined in ASHRAE (2019). This translates to a CO2 contribution of 0.0162 m3/h per person in a space of 42.3 m3, leading to an increase of 382 ppm/h.
Weather data
The nearest location’s weather file is applied consistently in both CN and EP to represent local climatic conditions. This file represents an average year, rather than a specific or extreme one, ensuring that the simulation results are based on standard conditions.
Ventilation availability
The simulation assumes that the opening remains open at all times to ensure natural ventilation. This assumption is made because the focus of this paper is on determining the appropriate opening size, rather than on predicting indoor CO2 levels.
Openable area
The opening is considered always fully open.
3.4 Minimum airflow and opening area calculation
The first step involves calculating the necessary opening area using Warren’s equations to maintain CO2 concentrations under this threshold (Table 2).
Table 2
Opening areas for each natural ventilation scenario.
| DRIVING FORCE | CASE SCENARIO | AREA: CO2 (m2) | AREA: COVID-19 (m2) |
|---|---|---|---|
| Wind | S01 | 1.80 | 3.36 |
| S02 | 0.67 | 1.25 | |
| Buoyancy | S03 | 0.96 | 1.30 |
| S04 | 0.30 | 0.60 | |
| S05 | 0.32 | 0.58 |
[i] Note: Each area was calculated according to the Warren model. The results provide practical guidance for practitioners, enabling them to select appropriate opening areas based on local conditions and design priorities.
3.5 Case study
This study focuses on shelters in Hitsats refugee camp, located in the semi-arid Tigray region of northern Ethiopia. Established in May 2013 to house over 15,000 Eritrean refugees, Hitsats has significant IAQ issues, with CO2 levels reaching 5000 ppm, largely due to high occupancy and the use of open charcoal stoves for cooking (Albadra et al. 2020b). Temperatures in the area range from 20°C in winter to 37.5°C in summer. Approximately 1333 shelters were built by aid agencies, featuring hollow concrete block walls and corrugated galvanised iron (CGI) roofs (Table 3 and Figure 6). Each shelter includes a door (90 × 200 cm) and a window (60 × 80 cm) on the same side, both with CGI shutters typically closed at night for security. The lack of shading and intense heat often leads families to keep the windows closed during the day, further limiting ventilation.
Table 3
Model data for shelter geometry and ventilation.
| ITEM | UNIT MEASURE | DESCRIPTION |
|---|---|---|
| Plan dimensions, l × b | m | 4.8 × 3.2 |
| Height—roof eave | m | 2.3 |
| Height—roof ridge | m | 3.3 |
| Door, l × h | m | 0.9 × 2.0 |
| Total doors | – | 1 |
| Window, l × h | m | 0.6 × 0.8 |
| Total windows | – | 1 |
| Window orientation | – | South facade |
| Ventilation schedule | – | Window and door open from 06.00 to 19.00 hours |
[i] Note: b = breadth; h = height; l = length.
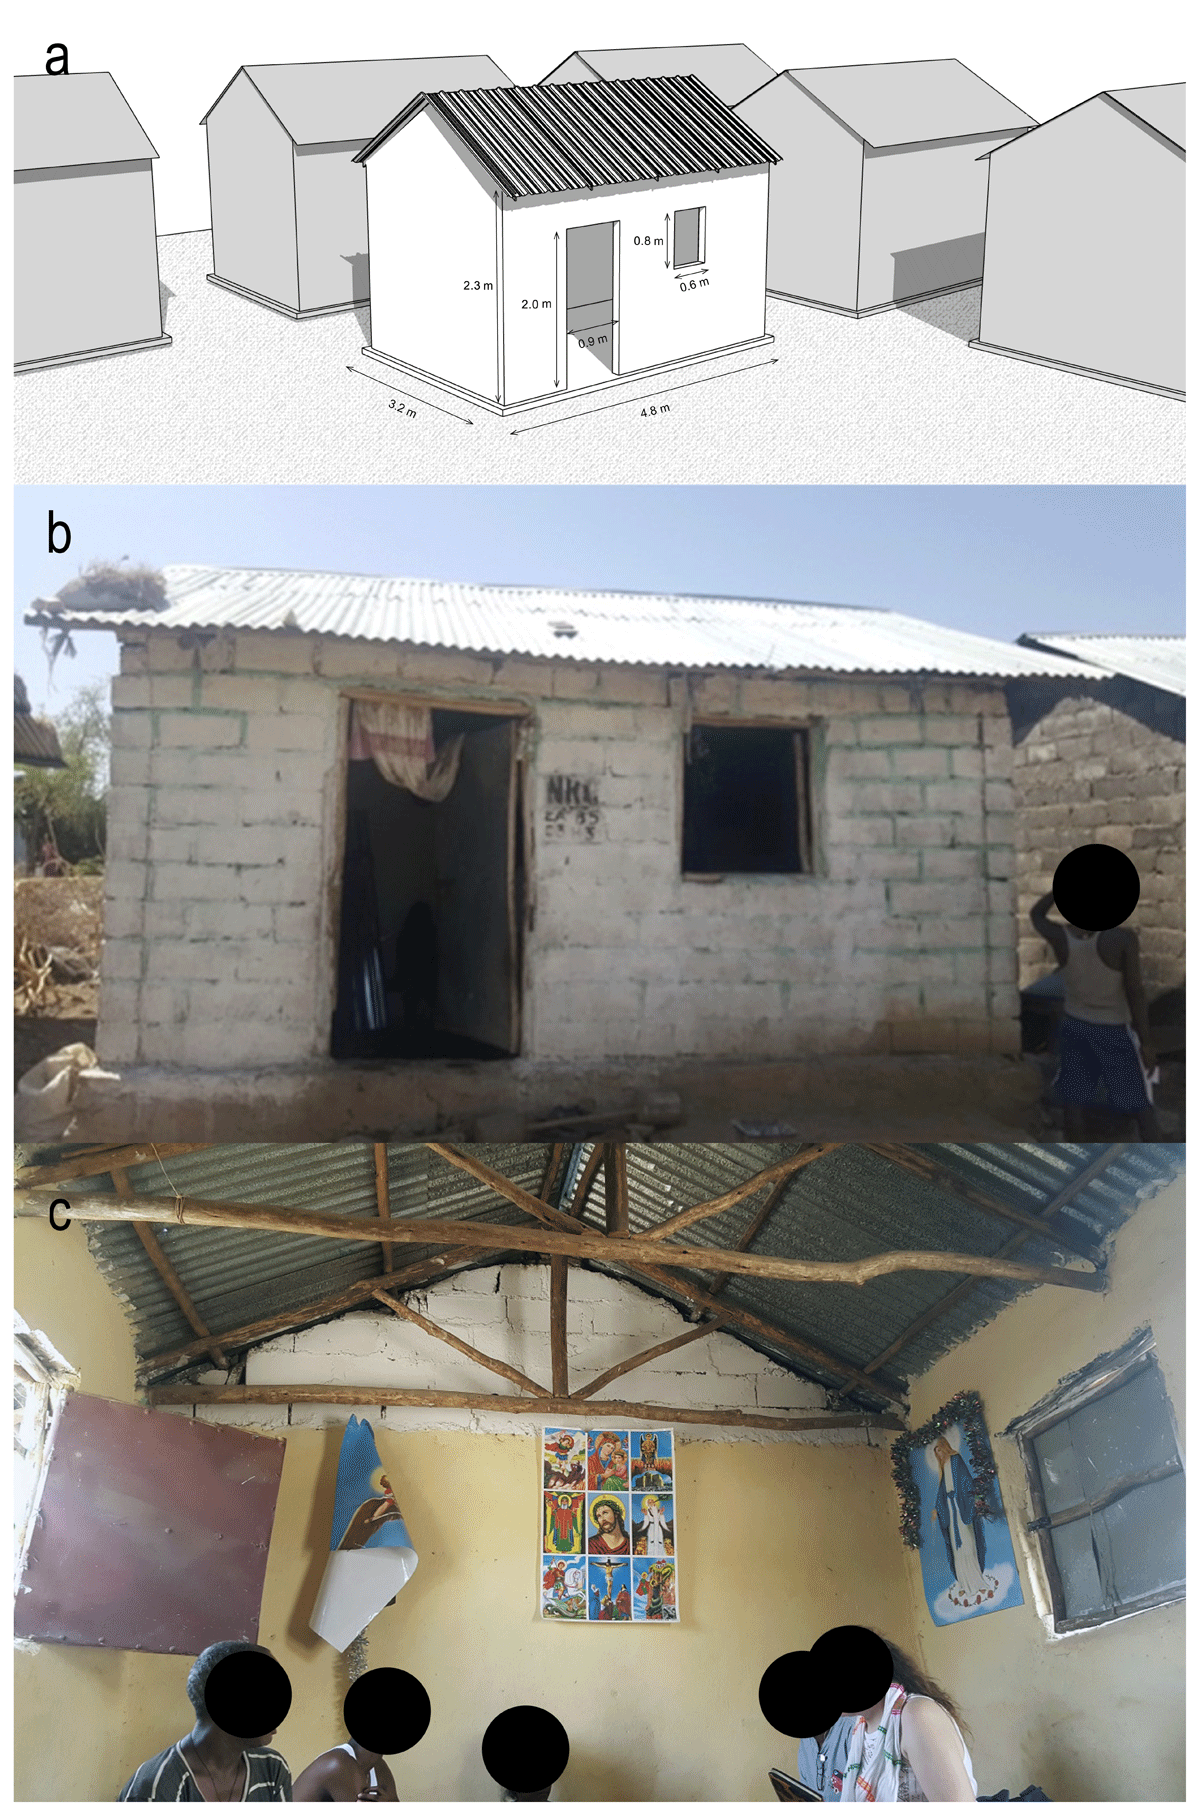
Figure 6
A shelter in Hitsats refugee camp: (a) three-dimensional (3D) model; (b) outdoor view; and (c) indoor view.
These shelters are broadly representative of many temporary shelters worldwide (UNHCR 2016). While each design is specific to its location, climate and cultural context (Albadra et al. 2020a; Fosas et al. 2018; Hart et al. 2018), the use of simple, durable materials such as concrete blocks and CGI, along with design constraints imposed by security and environmental factors, reflect global trends in shelter construction (UNHCR 2016). These common features often lead to similar challenges in maintaining IAQ, making this study’s findings relevant and applicable across various contexts, despite the unique considerations of each site.
4. Results
4.1 Wind-driven ventilation scenarios
For case S01, the Warren model assumes a wind direction of 180° and a speed of 0.5 m/s, which is favourable 94% of the time (Figure 4a). However, as shown in Table 4, when CO2 > 1000 ppm, local wind speeds fall to < 0.5 m/s in 11% of the cases for EP and in 25% of the cases for CN. Additionally, wind direction is almost never 180° during these exceedances, highlighting the AFN models’ sensitivity to local wind dynamics.
Table 4
Scenario S01 results: percentage of time CO2 is expected to be above the threshold of 1000 ppm in the selected airflow models.
| AIRFLOW MODEL | % OF TIME CO2 > 1000 ppm | % OF HOURS EXPLAINING HOURS WHEN CO2 > 1000 ppm | |
|---|---|---|---|
| UL< 0.5 m/s | WIND DIRECTION ≠ 180° | ||
| WR | 6.68% | 6.68% | 0% |
| CN | 0.02% | 25% | 100% |
| EP AFN | 0.56% | 11% | 98% |
[i] Note: AFN = airflow network; CN = Contam; EP = EnergyPlus; WR = Warren model.
Figure 7a shows that opening sizing through the Warren model keeps CO2 levels at < 1000 ppm for about 98% of the time in an annual simulation. This result is confirmed in Figure 7b, where CO2 levels generally stay below the 1000 ppm threshold. Occasionally, there are peaks > 1000 ppm, indicating short periods of insufficient ventilation.
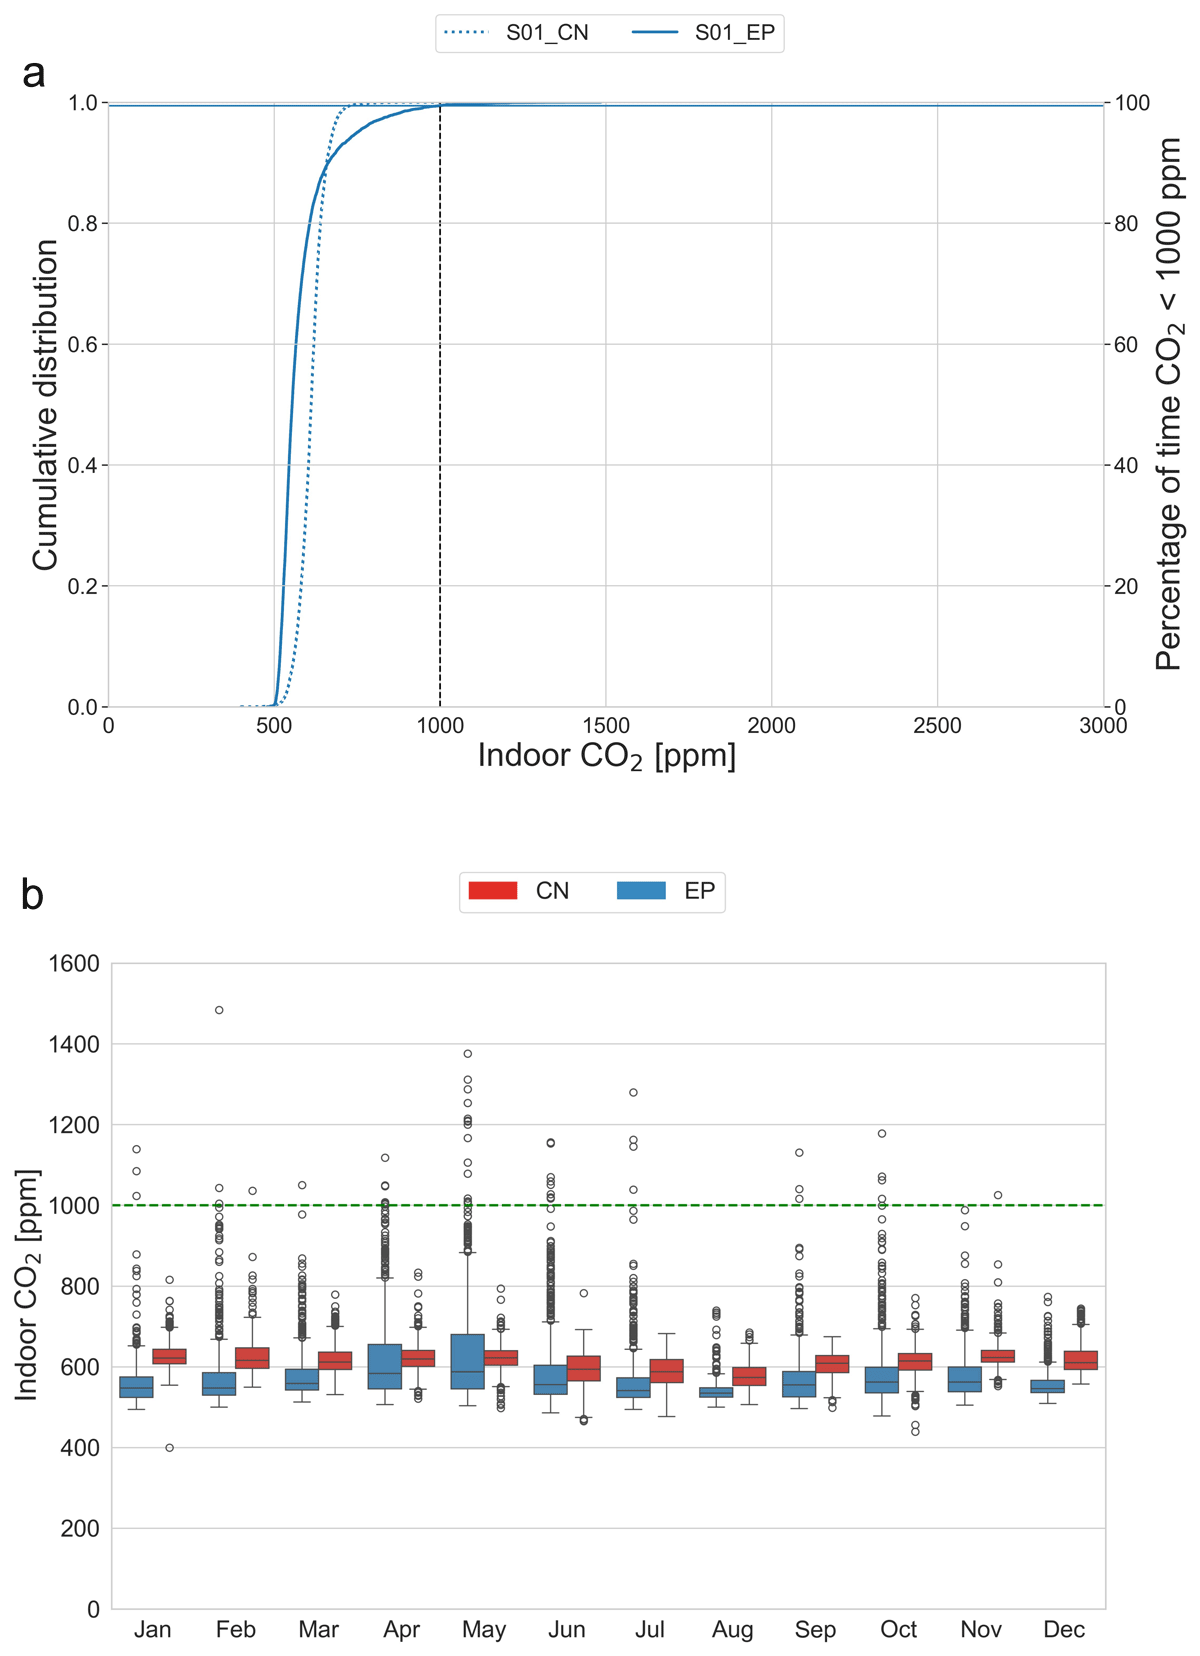
Figure 7
Scenario S01 results: (a) cumulative distribution of indoor CO2; and (b) monthly indoor CO2.
Note: Horizontal lines show the percentage of time CO2 is < 1000 ppm for EnergyPlus (EP) and Contam (CN).
Similarly to S01, scenario S02 is also promising and more conservative than CN and EP. The CO2 levels > 1000 ppm for only 0.78% of the time in EP and never in CN. The hours when CO2 levels > 1000 ppm in the EP model can be explained by observing that ΔCP < 0.1 (Table 5).
Table 5
Scenario S02 results: percentage of time CO2 is expected to be above the threshold of 1000 ppm in the selected airflow models.
| AIRFLOW MODEL | % OF TIME CO2 > 1000 ppm | % OF HOURS EXPLAINING HOURS WHEN CO2 > 1000 ppm | ||
|---|---|---|---|---|
| UL< 0.5 m/s | WIND DIRECTION ≠ 180° | ΔCp < 0.1 | ||
| WR | 6.68% | 6.68% | 0% | 1.55% |
| CN | 0.00% | 0% | 0% | 0% |
| EP AFN | 0.78% | 68% | 68% | 100% |
[i] Note: AFN = airflow network; CN = Contam; EP = EnergyPlus; WR = Warren model.
The cumulative distribution curves indicate that for most of the time indoor CO2 levels remain at < 1000 ppm for AFN models (Figure 8a). Throughout the year, the CO2 levels generally stay below the 1000 ppm threshold (Figure 8b). This indicates that the Warren opening-sizing approach for scenario S02 is effective in maintaining indoor CO2 levels below the selected threshold for 94% of the time.
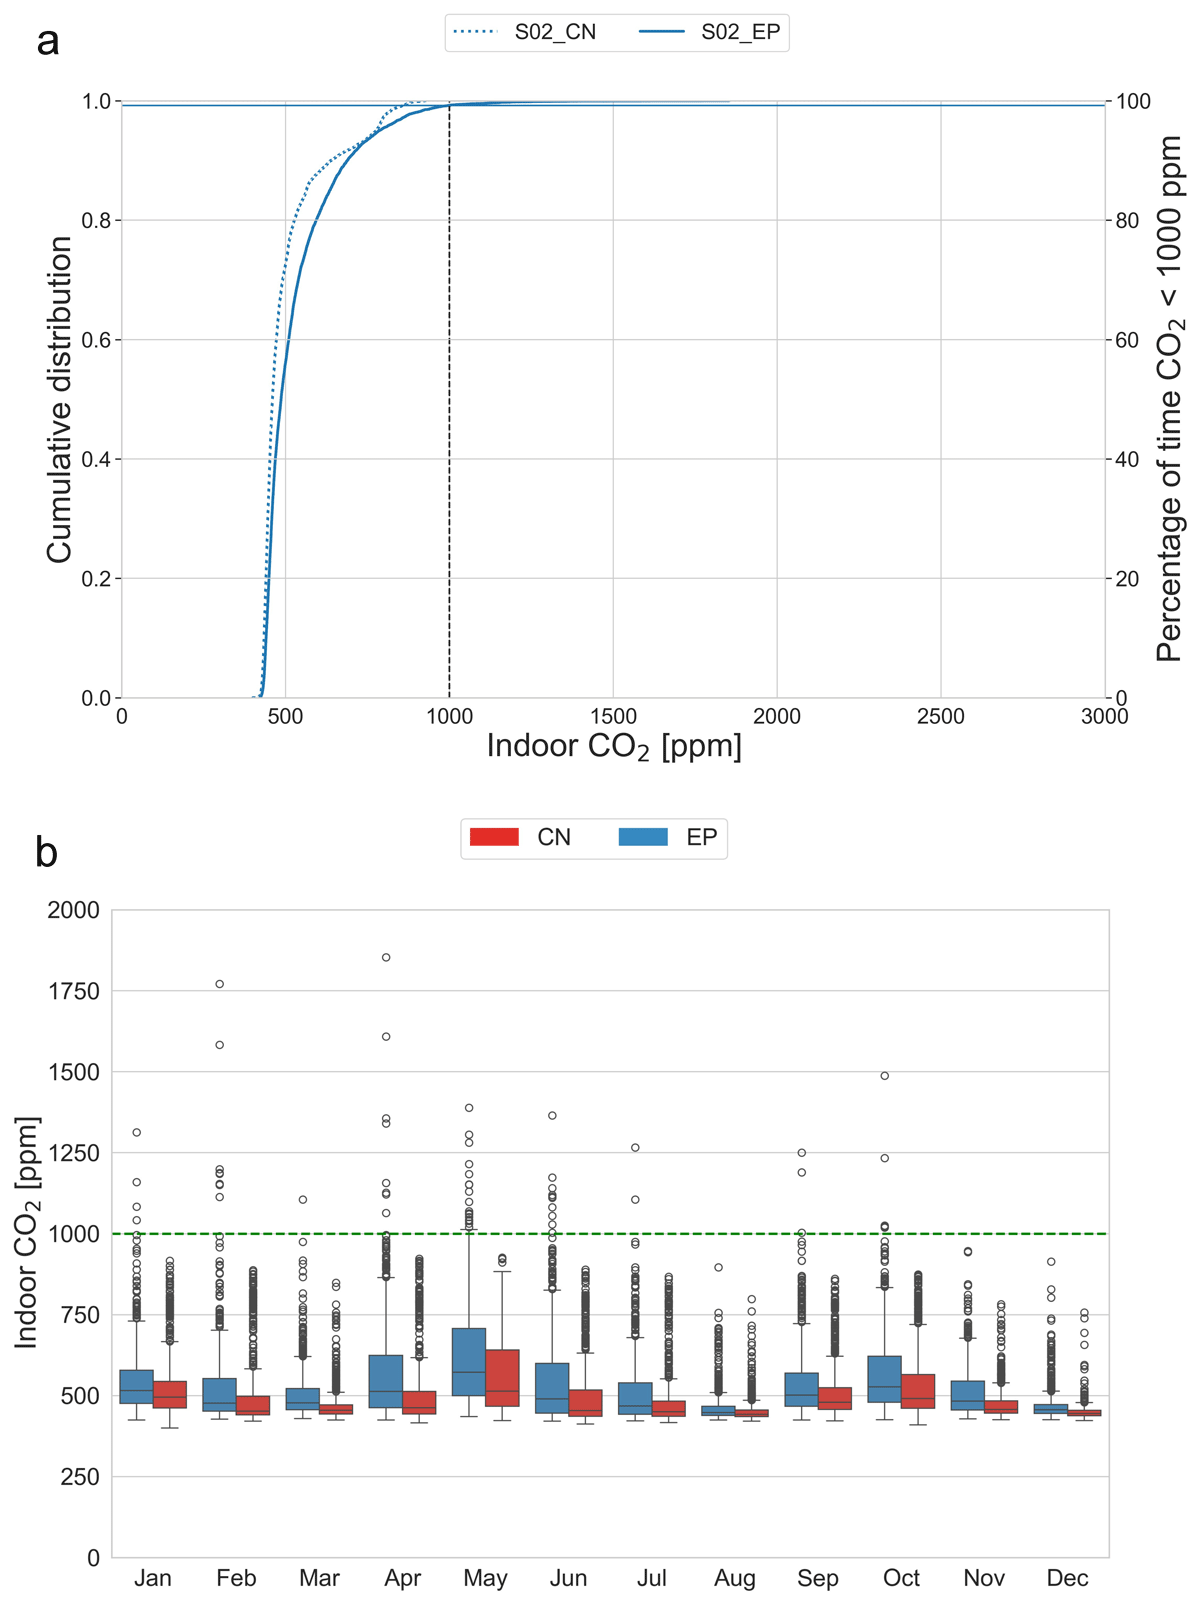
Figure 8
Scenario S02 results: (a) cumulative distribution of indoor CO2; and (b) monthly indoor CO2.
Note: Horizontal lines show the percentage of time CO2 is < 1000 ppm for EnergyPlus (EP) and Contam (CN).
4.2 Stack-driven ventilation scenarios
The stack-driven scenarios (S03–S05) were expected to fail only 0.01% of the time when openings were sized based on a minimum mean temperature of 16°C (Figure 4b). However, as shown in Table 6, the calculated opening size for S03 can fail 0.82% of the time in the CN model, and even 6.52% of the time in the EP model. This can be explained by observing that Δθ is below the 3 K threshold used for sizing the openings in the Warren model. Figure 9 illustrates how the performance can vary under the same opening size, depending on whether the model also conducts dynamic thermal modelling. CN, which assumes Δθ = 3 K, presents outcomes closer to the Warren model (0.82%). In contrast, EP, which includes a thermal simulation, shows a higher percentage of time (6.52%) with CO2 concentrations > 1000 ppm. These findings highlight the need to refine the stack-driven ventilation. Potential improvements could involve adjusting the temperature difference assumptions to better match actual conditions. Indeed, Figure 10 shows that for most of the time in the simulation, Δθ < 3 K, which explains the failure of the buoyancy ventilation strategy.
Table 6
Scenario S03 results: percentage of time CO2 is expected to be above the threshold of 1000 ppm in the selected airflow models.
| AIRFLOW MODEL | % OF TIME CO2 > 1000 ppm | % OF HOURS EXPLAINING HOURS WHEN CO2 > 1000 ppm | |||
|---|---|---|---|---|---|
| Δθ < 3 K (%) | AVERAGE Δθ (K) | WIND SPEED = 0 (%) | WIND DIRECTION ≠ 180° (%) | ||
| WR | 0.01% | 0% | n.a. | 0% | n.a. |
| CN | 0.82% | 0% | n.a. | 11.11% | 100% |
| EP AFN | 6.52% | 100% | 0.27 | 0% | 0% |
[i] Note: AFN = airflow network; CN = Contam; EP = EnergyPlus; WR = Warren model; n.a. = not applicable.
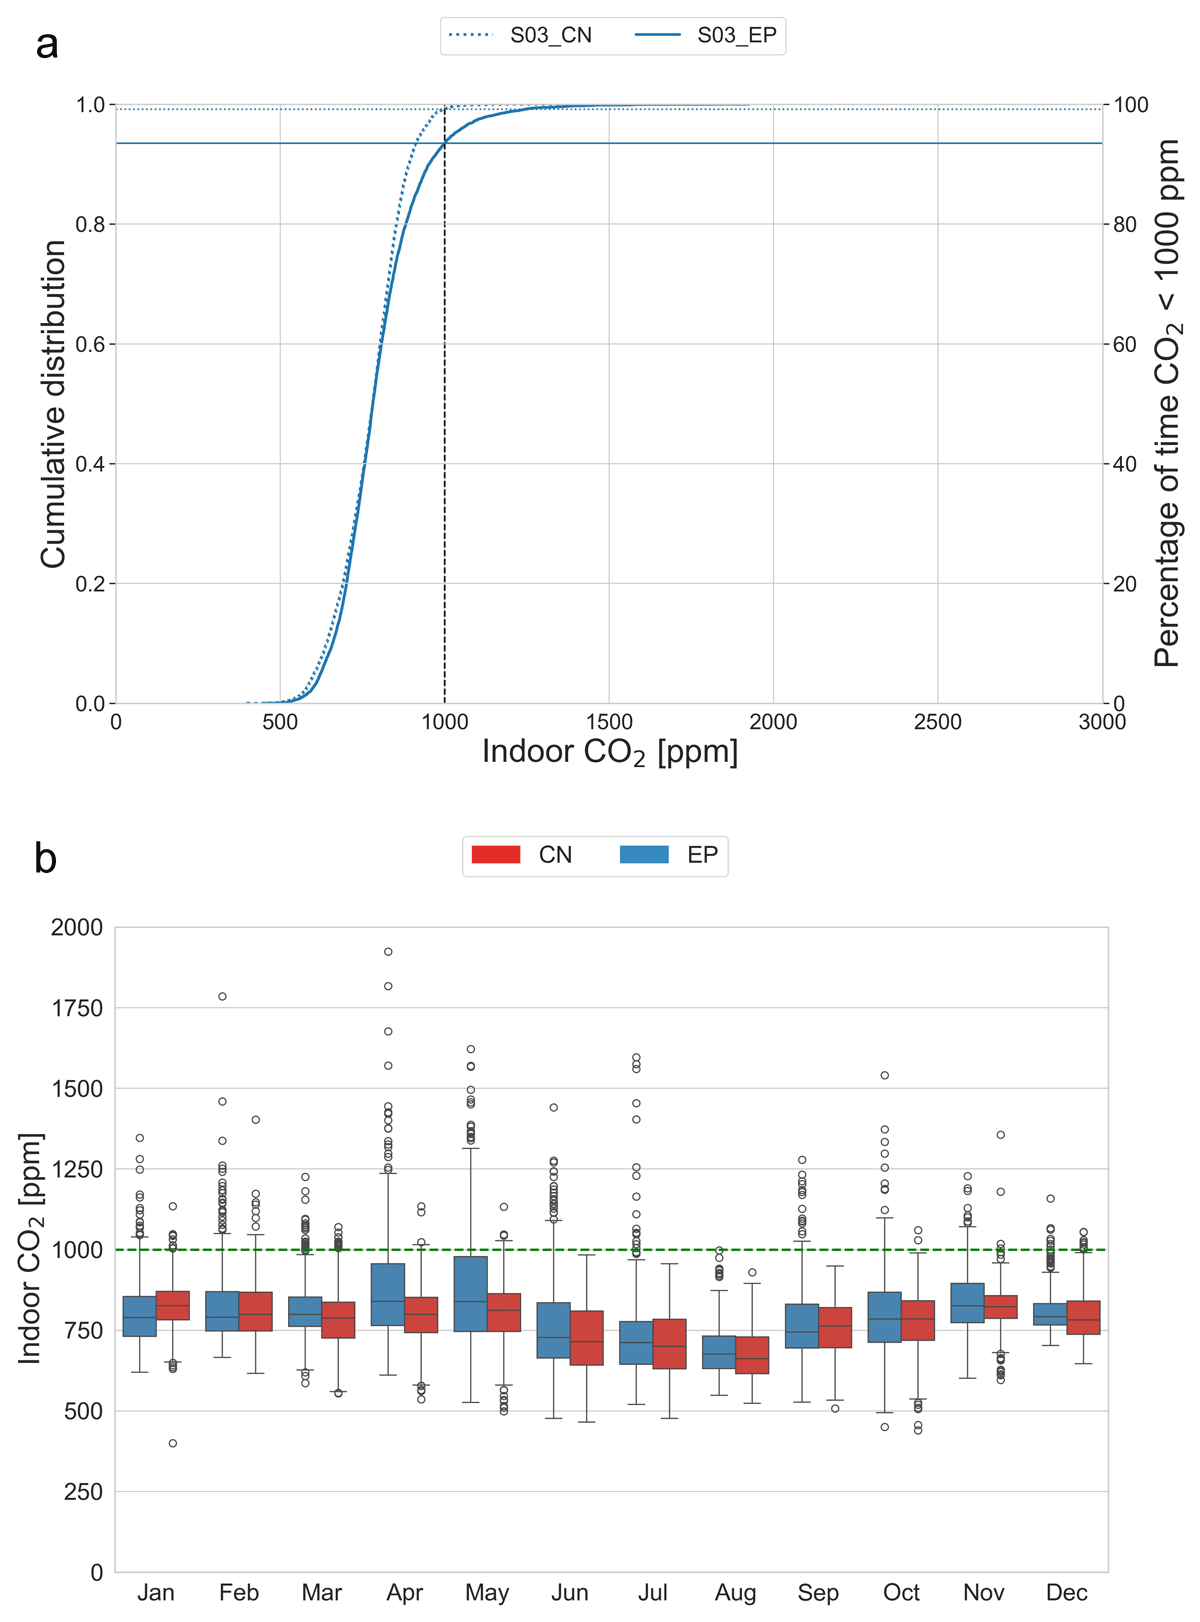
Figure 9
Scenario S03 results: (a) cumulative distribution of indoor CO2; and (b) monthly indoor CO2.
Note: Horizontal lines show the percentage of time CO2 is < 1000 ppm for EnergyPlus (EP) and Contam (CN).
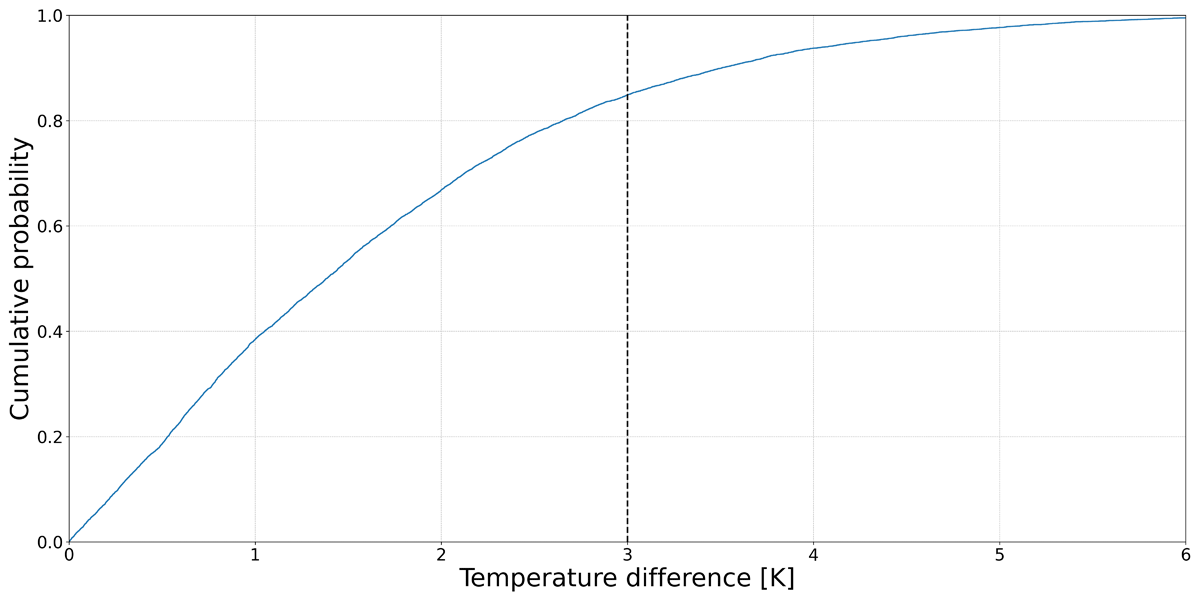
Figure 10
Distribution of the temperature difference in an annual simulation with EnergyPlus (EP) for case S03.
Note: The vertical line shows the selected temperature difference of 3 K.
Table 7 summarises the performance for scenario S04. Similar to scenario S03, sizing openings using the Warren model are expected to result in indoor CO2 levels exceeding the 1000 ppm threshold only 0.01% of the time. However, the AFN models show higher exceedance rates, with CO2 levels surpassing 1000 ppm for 2.2% of the time in the CN model and 5.27% of the time in the EP model.
Table 7
Scenario S04 results: percentage of time CO2 is expected to be above the threshold of 1000 ppm in the selected airflow models.
| AIRFLOW MODEL | % OF TIME CO2 > 1000 ppm | % OF HOURS EXPLAINING HOURS WHEN CO2 > 1000 ppm | |||
|---|---|---|---|---|---|
| Δθ < 3 K (%) | AVERAGE Δθ (K) | WIND SPEED = 0 (%) | WIND DIRECTION ≠ 180° (%) | ||
| WR | 0.01% | 0% | n.a. | 0% | n.a. |
| CN | 2.2% | 0% | n.a. | 5.70% | 100% |
| EP AFN | 5.27% | 100% | 0.27 | 0% | 0% |
[i] Note: AFN = airflow network; CN = Contam; EP = EnergyPlus; WR = Warren model; n.a. = not applicable.
The CN model in Figure 11b presents the lowest percentage of time with CO2 levels > 1000 ppm, while the EP model shows a slightly higher percentage. For S04, the opening sizing using the Warren model does not consistently maintain CO2 levels < 1000 ppm in the AFN models.
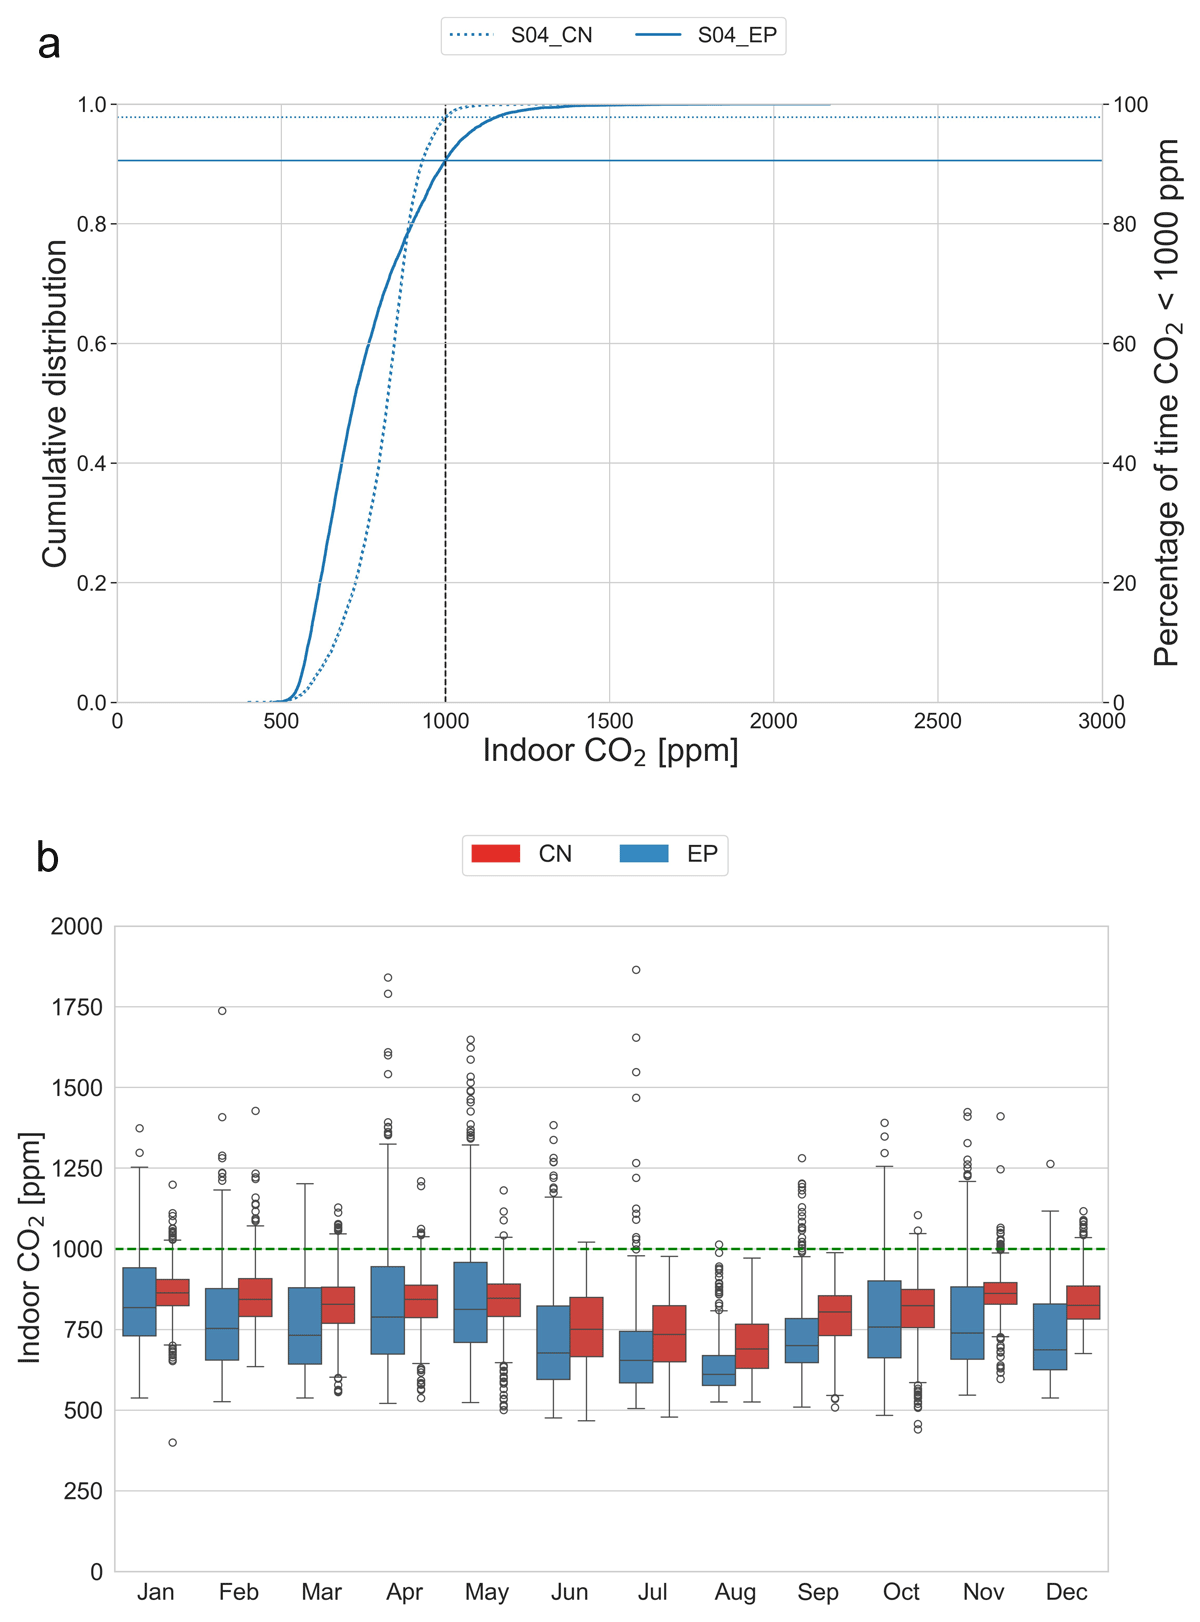
Figure 11
Scenario S04 results: (a) Cumulative distribution of indoor CO2; and (b) monthly indoor CO2.
Note: Horizontal lines show the percentage of time CO2 is < 1000 ppm for EnergyPlus (EP) and Contam (CN).
Figure 11b displays how the CO2 levels generally stay well below the 1000 ppm threshold. Notably, certain months exhibit occasional peaks > 1000 ppm. As for scenario S03, also in this case the assumption of a temperature difference of 3 K is not representative of the reality, as shown in Figure 12.
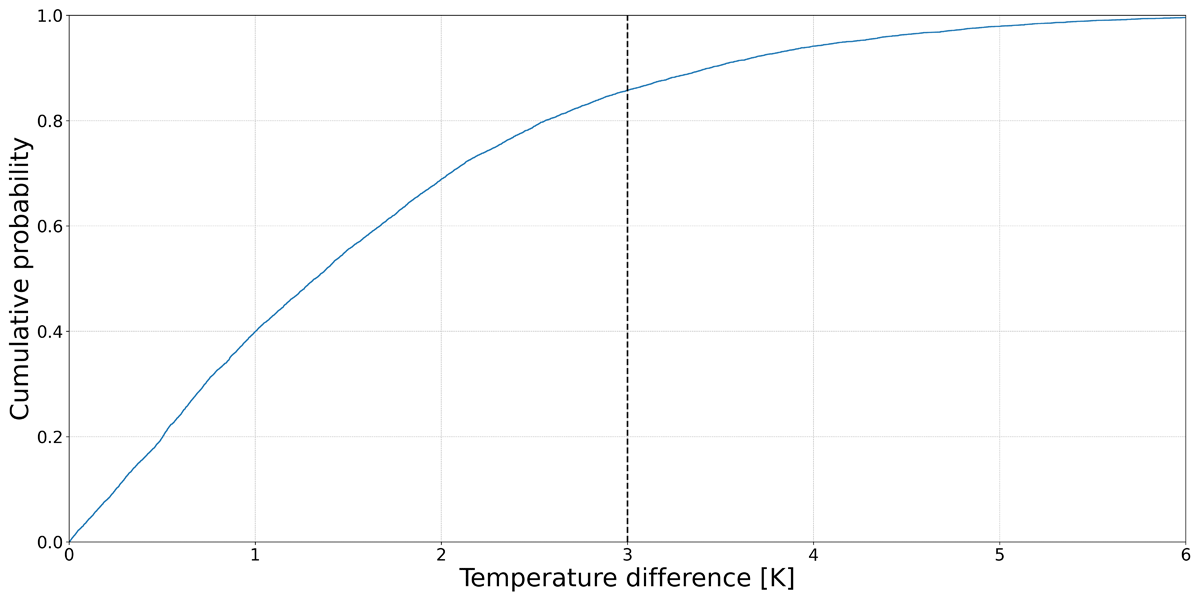
Figure 12
Distribution of the temperature difference in an annual simulation with EnergyPlus (EP) for case S04.
Note: The vertical line shows the selected temperature difference of 3 K.
Similarly, in scenario S05, the opening sizing through Warren is not completely effective in the AFN models. As shown in Table 8, the percentage of time CO2 levels are > 1000 ppm ranges from 2.87% (CN) to 4.39% (EP). This higher percentage indicates that the Warren model might not be always reliable for ensuring an acceptable IAQ in this scenario.
Table 8
Scenario S05 results: percentage of time CO2 is expected to be above the threshold of 1000 ppm in the selected airflow models.
| AIRFLOW MODEL | % OF TIME CO2 > 1000 ppm | % OF HOURS EXPLAINING HOURS WHEN CO2 > 1000 ppm | |||
|---|---|---|---|---|---|
| Δθ < 3 K (%) | AVERAGE Δθ (K) | WIND SPEED = 0 (%) | WIND DIRECTION ≠ 180° | ||
| WR | 0.01% | 0% | n.a. | 0% | n.a. |
| CN | 2.2% | 0% | n.a. | 5.70% | 100% |
| EP AFN | 5.27% | 100% | 0.27 | 0% | 0% |
[i] Note: AFN = airflow network; CN = Contam; EP = EnergyPlus; WR = Warren model; n.a. = not applicable.
As for scenarios S03 and S04, also in S05 for a higher portion of the time, indoor CO2 levels > 1000 ppm (Figure 13a). In Figure 13b, opening size with Warren and simulated in EP generally predicts higher median CO2 concentrations compared with CN. As for S03 and S04, the Warren opening-sizing approach for scenario S05 is less effective in maintaining indoor CO2 levels below the 1000 ppm threshold compared with the wind-driven scenarios. The higher variability in CO2 levels and the substantial percentage of time with CO2 concentrations > 1000 ppm highlight the challenges in achieving effective stack-driven ventilation with the given parameters, especially the temperature gradient (Figure 14).
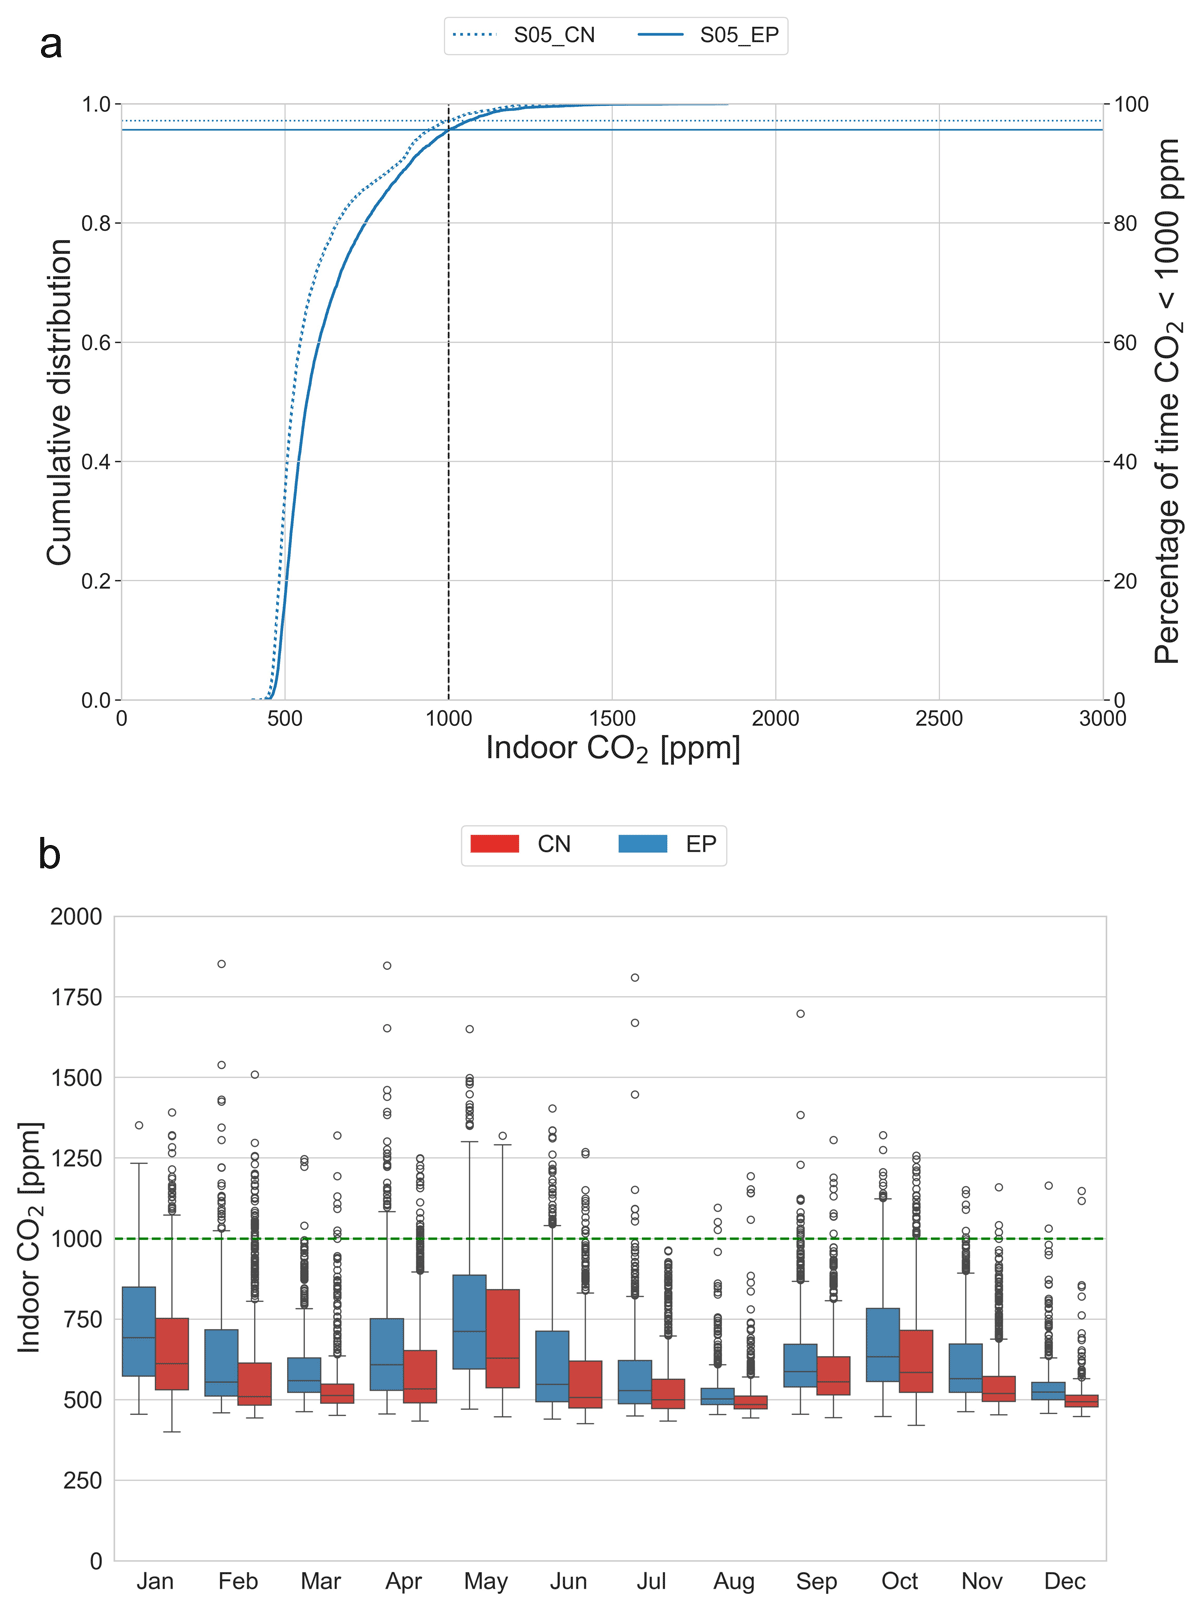
Figure 13
Scenario S05 results: (a) Cumulative distribution of indoor CO2; and (b) monthly indoor CO2.
Note: Horizontal lines show the percentage of time CO2 is < 1000 ppm for EnergyPlus (EP) and Contam (CN).
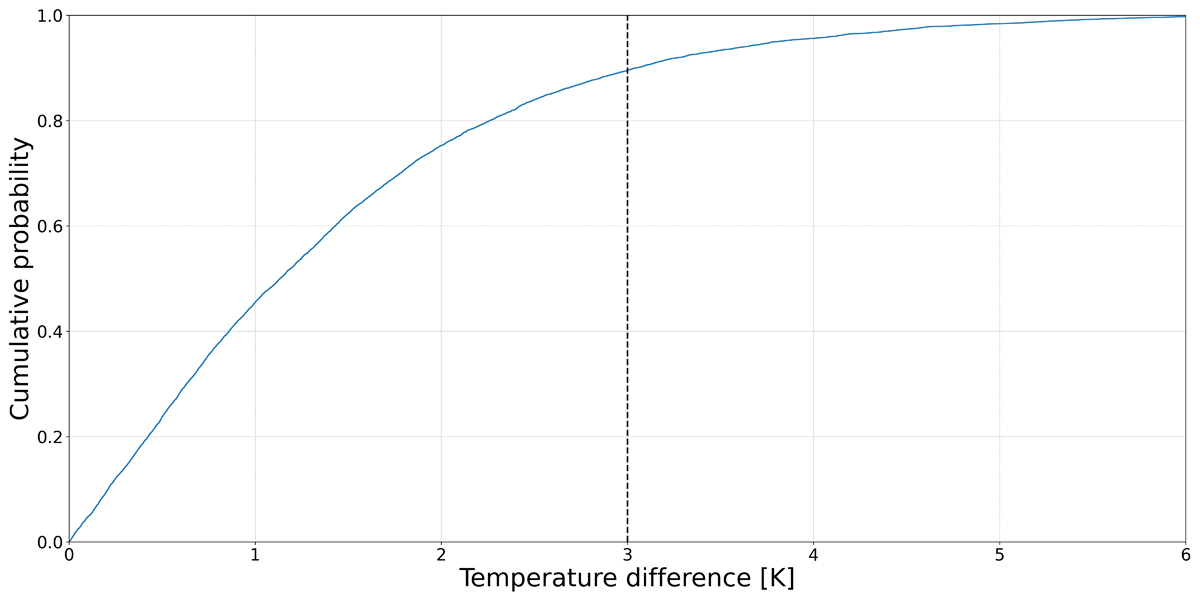
Figure 14
Distribution of the temperature difference in an annual simulation with EnergyPlus (EP) for case S05.
Note: The vertical line shows the selected temperature difference of 3 K.
5. Discussion
Ensuring adequate natural ventilation is crucial for shelters housing displaced populations (Albadra et al. 2020b; Webb et al. 2020). Accurate airflow control through openings is vital for providing sufficient fresh air (Brandan & Espinosa 2018; Escombe et al. 2007).
This study focused on determining the minimum window area required to achieve healthy levels of natural ventilation. It considered two approaches: adopting the minimum ventilation rate of 14 l/s per person, as recommended by the latest COVID-19 guidelines, and maintaining indoor CO2 levels below the threshold of 1000 ppm. Between these two, the method prioritised the worst-case scenario—the smallest window area required—providing a conservative approach to ensure the minimum necessary opening size for a healthy indoor environment.
This research evaluated the Warren model (Warren 1977; Warren & Parkins 1985) for its effectiveness in sizing openings for shelters. The results show that the Warren model offers accurate predictions comparable with AFN models, supporting its use in a simplified framework for shelter design. This knowledge is key to creating healthy shelters (Jayakody et al. 2022) through effective design of openings (Sacht & Lukiantchuki 2017).
5.1 Wind-driven ventilation
The analysis of wind-driven ventilation scenarios reveals that the conservative approach of the Warren models provides a reliable and effective method for informing opening sizing in shelter design (Larsen et al. 2018). Warren’s predictions were not only met but also exceeded by the AFN models, indicating that these simplified approaches can be trusted to maintain adequate IAQ in real-world conditions.
For shelter design, this means that Warren models can be confidently used in the initial stages of design, as also observed previously (Brandan & Espinosa 2018; Vallejo et al. 2015). The conservative nature of these models ensures that the opening sizes will be sufficient to provide a healthy indoor environment for shelter occupants. This simplifies the design process and also ensures that shelters are designed to maintain adequate IAQ standards.
5.2 Buoyancy-driven ventilation
One primary mechanism driving natural ventilation is thermal buoyancy (Fan et al. 2021; Jiang et al. 2023). The effectiveness of this process depends on the temperature gradient between the indoor and outdoor environments. A significant temperature difference (> 3 K) enhances the buoyancy effect, promoting vertical airflow (Terpager Andersen 2003). This is critical in stack-driven ventilation, where thermal buoyancy is the primary driver (Caciolo et al. 2011). However, when this temperature gradient is insufficient, the stack effect weakens, potentially leading to inadequate ventilation and higher indoor pollutant concentrations.
The analysis of buoyancy-driven ventilation scenarios reveals that the assumption of a constant 3 K temperature gradient in the Warren model can sometimes be inadequate. The AFN models, particularly with the thermal simulation capabilities of EP, demonstrate that temperature variations can impact ventilation effectiveness (Arendt et al. 2017).
Comparing the CN and EP models reveals differences in how thermal effects influence ventilation performance. For instance, in scenario S03, when the temperature difference falls below the 3 K threshold, EP predicts CO2 levels > 1000 ppm for 6.52% of the time, compared with just 0.82% in CN. The differences between CN and EP become especially pronounced under small temperature gradients.
While the Warren model offers a practical basis for sizing openings, its assumption of a constant 3 K temperature gradient may not always be sufficient. However, the model maintains CO2 levels < 1000 ppm for 94% of the time, showing it is generally effective, despite occasional shortcomings. These scenarios still meet Etheridge’s (2011) < 10% failure threshold, affirming the Warren model’s robustness.
5.3 Implications for opening size
This study offers key insights into the effectiveness of various airflow models for predicting CO2 concentrations and maintaining IAQ in shelters. In wind-driven scenarios (S01 and S02), the Warren model proved to be a conservative yet reliable method for sizing openings, keeping CO2 levels < 1000 ppm for over 94% of the time, even with varying wind conditions. This makes the Warren model a choice for opening sizing in resource-limited settings.
However, the stack-driven scenarios (S03–S05) posed more challenges. The Warren model was less consistent, particularly when the temperature difference between indoors and outdoors was < 3 K. These results suggest that designers might need to consider larger openings or additional ventilation strategies when relying on thermal buoyancy. In areas with unpredictable temperature variations or lower wind speeds, supplementary strategies such as mixed-mode ventilation or adjustable openings may be required to ensure acceptable IAQ.
5.4 Implications for shelter design
The findings of this study have significant implications for the shelter design sector, which operates under unique constraints compared with conventional building design. Unlike residential or commercial construction, the shelter sector lacks established building regulations or design guidelines to ensure adequate IAQ and natural ventilation performance. This regulatory void leaves shelter designers and humanitarian agencies without a reliable framework to guide their work. This paper serves as a mathematical and methodological foundation for addressing this gap. By validating simplified ventilation models against more complex simulation tools, a robust starting point for developing practical and accessible tools and frameworks is provided. It allows shelter designers to make informed decisions about opening sizing based on scientific principles without requiring extensive computational resources. This accessibility is particularly valuable for improving IAQ in shelters, such as those needed during humanitarian crises (European Parliamentary Research Service 2019).
These future tools could enable shelter designers to do the following:
Calculate the appropriate opening sizes for natural ventilation under different environmental conditions.
Ensure that ventilation rates meet or exceed IAQ benchmarks (Sachs et al. 2022).
Account for the constraints of rapidly constructed, resource-limited shelters in diverse climates.
Although this paper does not directly present a ready-to-use design tool, it establishes the theoretical foundation necessary for such advancements. It also provides a design table (see Table S3 in the supplemental data online) summarising the recommended open area per person for different flow configurations and the associated probabilities of achieving healthy ACH.
Future work will focus on translating these simplified models into accessible, user-friendly tools that can be seamlessly integrated into the shelter design process. By addressing the absence of formal guidelines and regulations in this field, the aim is to equip designers and policymakers with scientifically informed, practical solutions to improve the indoor environments of shelters. Ultimately, this work seeks to enhance the living conditions of displaced populations by providing evidence-based strategies for achieving adequate ventilation and IAQ.
6. Conclusions
In shelter design, particularly in resource-constrained environments, there is a strong need for simplified tools to help designers effectively size openings for natural ventilation and maintain indoor air quality. Complex computational models, though accurate, are often inaccessible to non-specialists due to their technical demands. This study has explored Warren airflow models as simplified alternative for guiding natural ventilation design in such settings.
The findings show that the Warren model is a valuable tool for wind-driven ventilation scenarios, reliably keeping indoor CO2 levels < 1000 ppm, making it a practical choice for shelter designers working with limited resources. Its simplicity and effectiveness highlight its potential to significantly improve air quality in shelters. For buoyancy-driven scenarios, while the Warren model’s performance is less consistent, it still provides valuable guidance within certain limits.
While there is room for improvement to address thermal buoyancy complexities, the model’s overall reliability supports its use across various ventilation scenarios. Further refinement and integration with additional tools could enhance its applicability, helping designers create safer and healthier living environments for displaced populations.
Acknowledgements
The main work was completed when Anna Conzatti was at the Department of Architecture and Civil Engineering, University of Bath, Bath, UK
Author contributions
AC: conceptualization, data curation, formal analysis, investigation, methodology, visualisation and writing – original draft.
DF: the conceptualization, methodology, writing – review & editing, and the supervision.
BC: visualization.
DC: conceptualization and writing – review & editing.
Competing interests
The authors have no competing interests to declare.
Data accessibility
Data are accessible via https://doi.org/10.15125/BATH-01450.
Ethical approval
Ethical consent was not required for this research.
Supplemental data
Supplemental data for this article can be accessed at: https://doi.org/10.5334/bc.497.s1