
| ALCGHGE | annualized life-cycle greenhouse gas emissions |
| APT | apartment building |
| GCC | Gulf Cooperation Council |
| GHGE | greenhouse gas emissions |
| INF | informal building |
| SFH | single-family house |
| TRD | traditional building |
| WANA | Western Asia and Northern Africa |
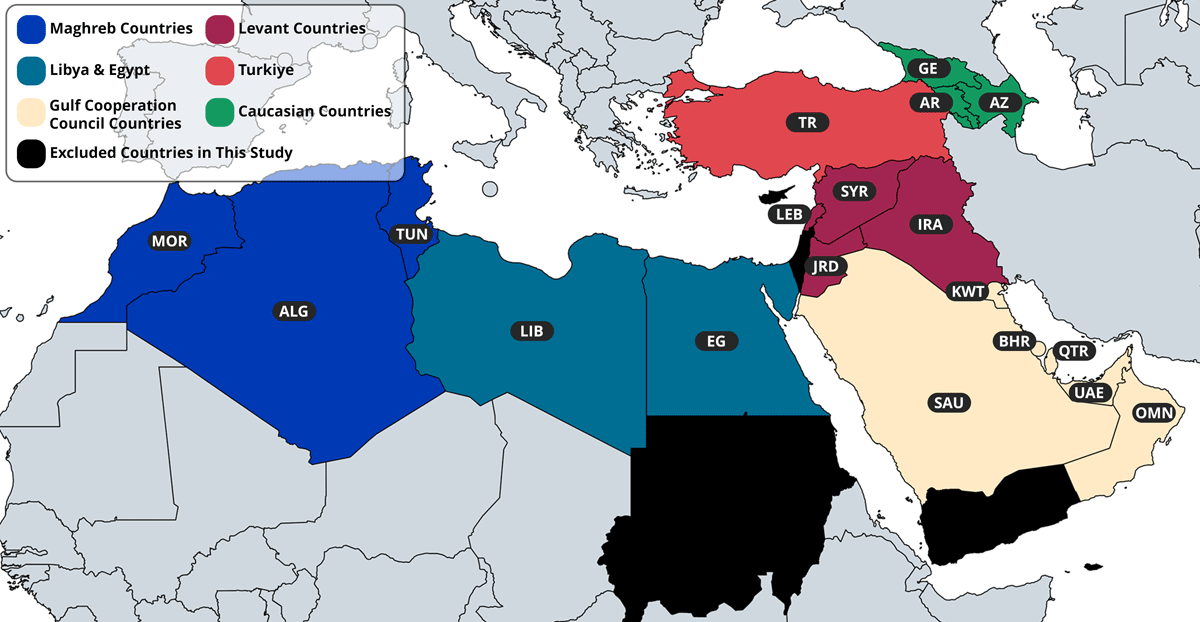
Figure 1
The study focuses on 19 countries in Western Asia and Northern Africa (WANA), examining their residential building stock typologies, operational energy use, material consumption, and related emissions.
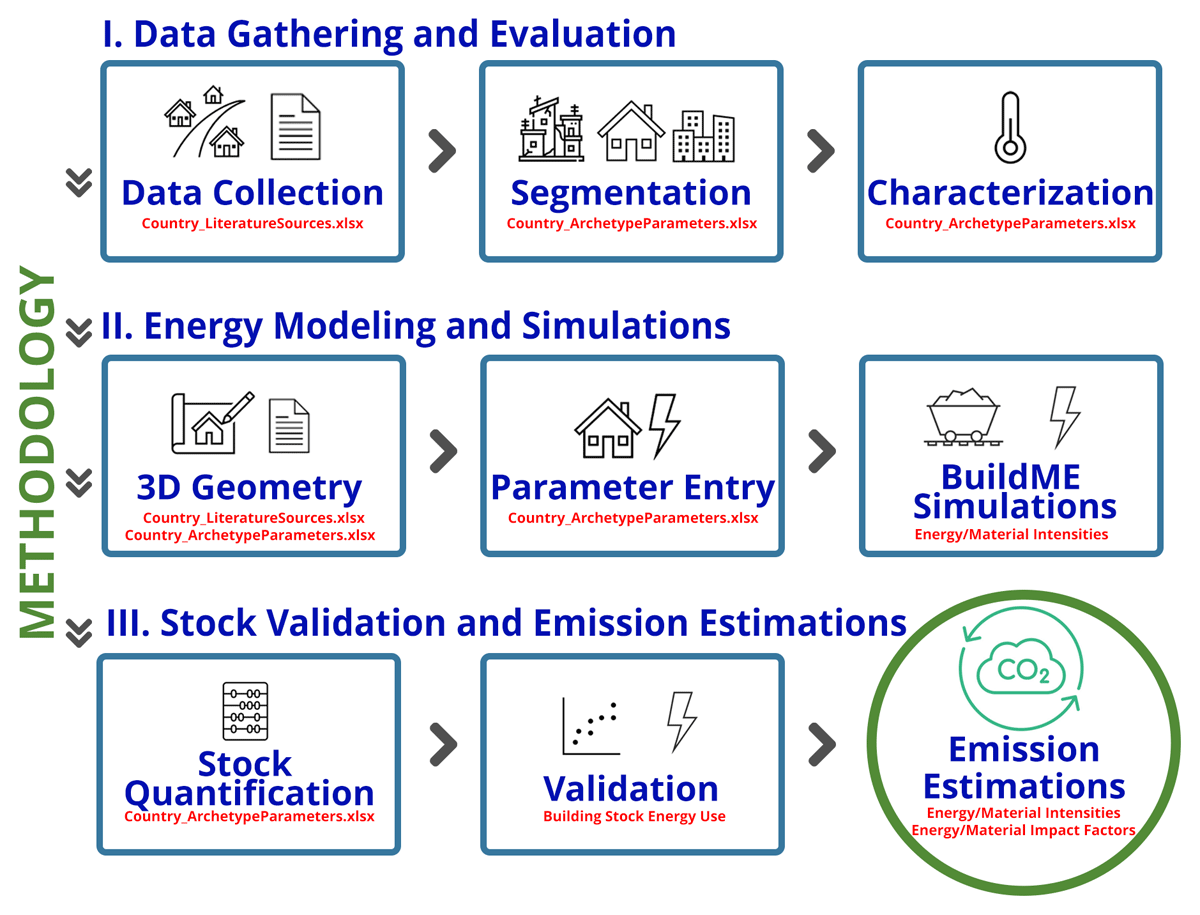
Figure 2
The central methodology of the paper for estimating resource use and related annualized life-cycle greenhouse gas emissions (ALCGHGE) in 19 countries consists of three stages: data-gathering and evaluation (archetype creation), energy modeling and simulations, and, finally, stock validation and emission estimations.
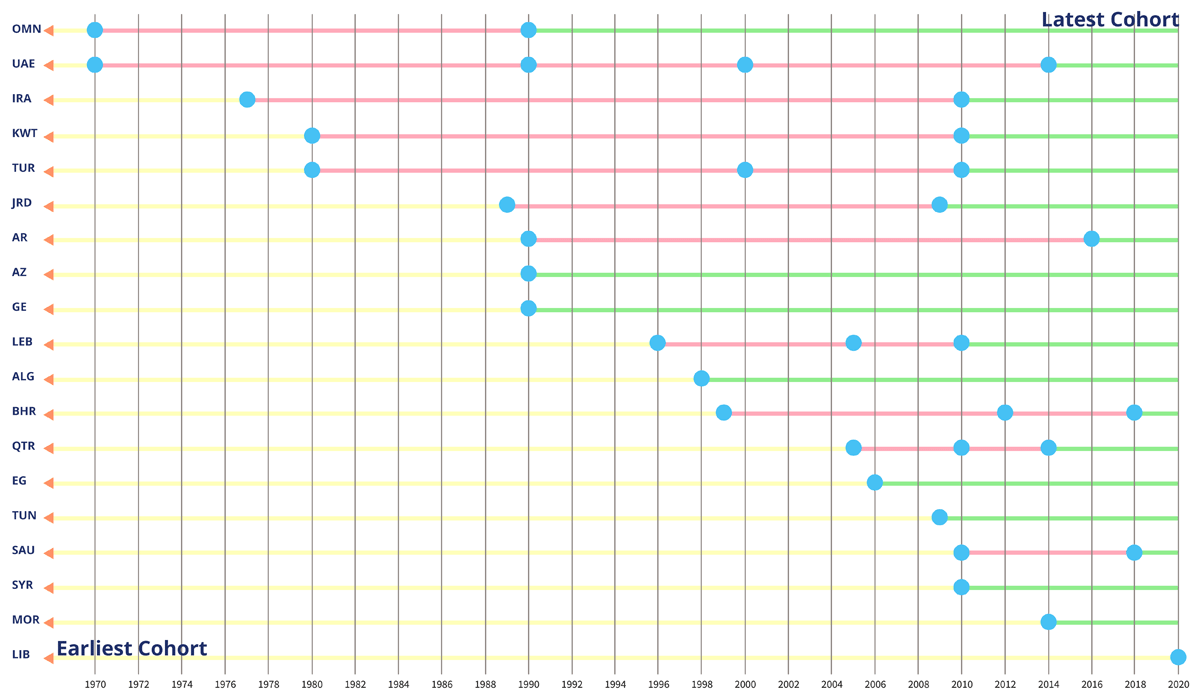
Figure 3
Modeled time-cohort characteristics for each country’s archetypes.
Note: Blue dots indicate the significant turning points or paradigm shifts in the region’s residential construction history. Yellow lines represent the earliest cohorts; pink lines the intermediate cohorts; and green lines the most recent characteristics that are still in action. For country abbreviations, see Figure 5.
Table 1
Proxy countries used for the three-dimensional (3D) geometry for countries without precise data.
| COUNTRIES | PROXY COUNTRIES FOR THE ARCHITECTURAL FORM OF TYPOLOGIES | |||
|---|---|---|---|---|
| APARTMENT BUILDINGS (APTs) | SINGLE-FAMILY HOUSES (SFHs) | TRADITIONAL BUILDINGS (TRDs) | INFORMAL BUILDINGS (INFs) | |
| Tunisia | Jordan | Iraq | Bahrain | Lebanon |
| Algeria | Egypt | Iraq | Bahrain | Morocco |
| Libya | Jordan | Egypt | Bahrain | Lebanon |
| Armenia | Common Caucasian | Türkiye | – | Türkiye |
| Azerbaijan | Common Caucasian | Türkiye | – | Türkiye |
| Georgia | Common Caucasian | Türkiye | – | Türkiye |
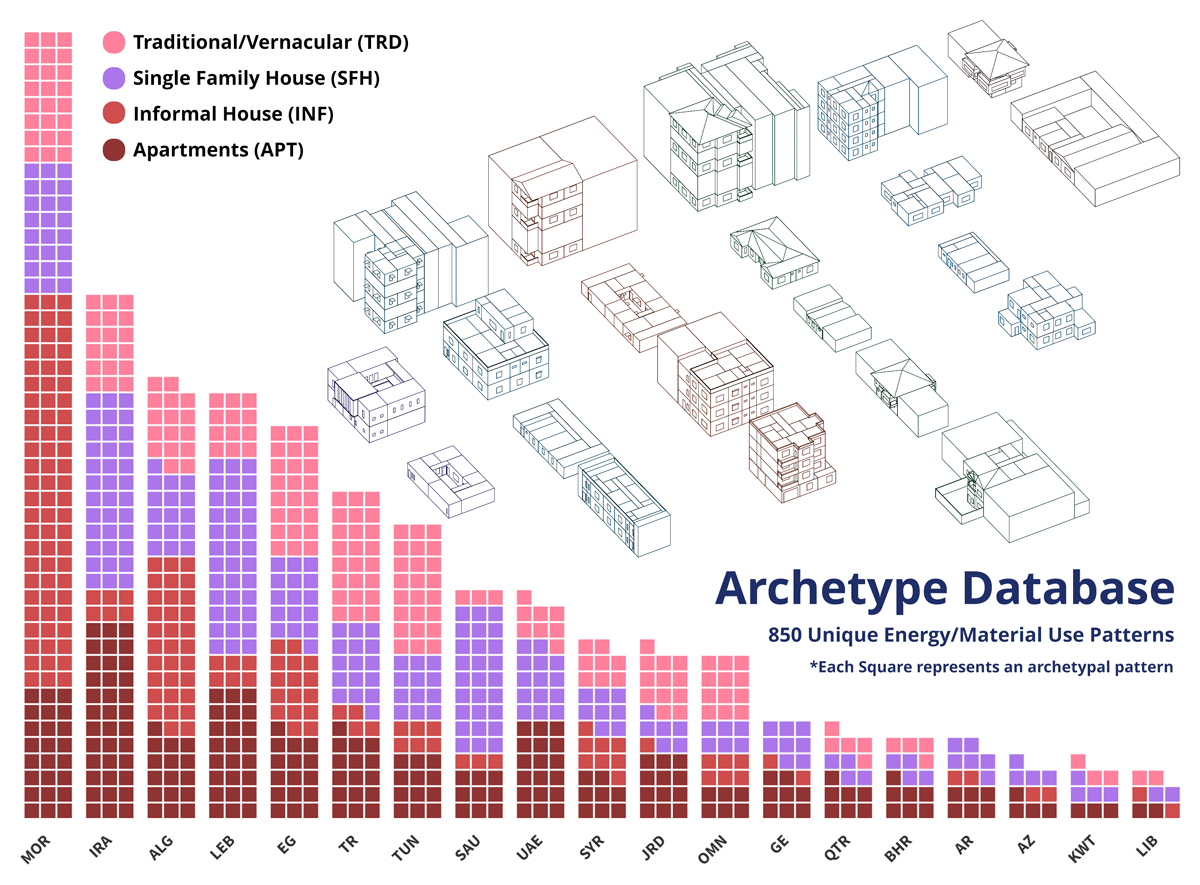
Figure 4
Employed archetypal typologies for countries, along with geometrical examples of the architectural forms that were observed in some countries in 2020.
Note: Given abbreviations are used throughout the paper.
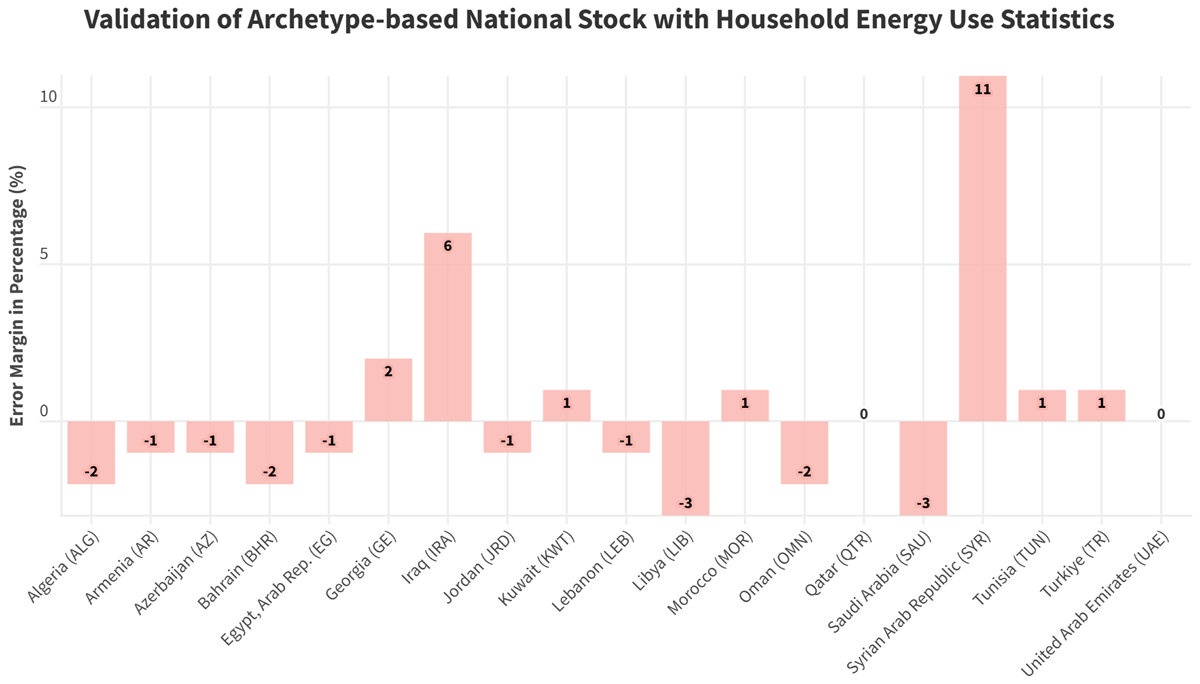
Figure 5
Calculated archetype energy demands extrapolated to the national levels and compared with the average household energy demands statistics sampled from the period 2018–20.
Note: Bars are error margins (%).
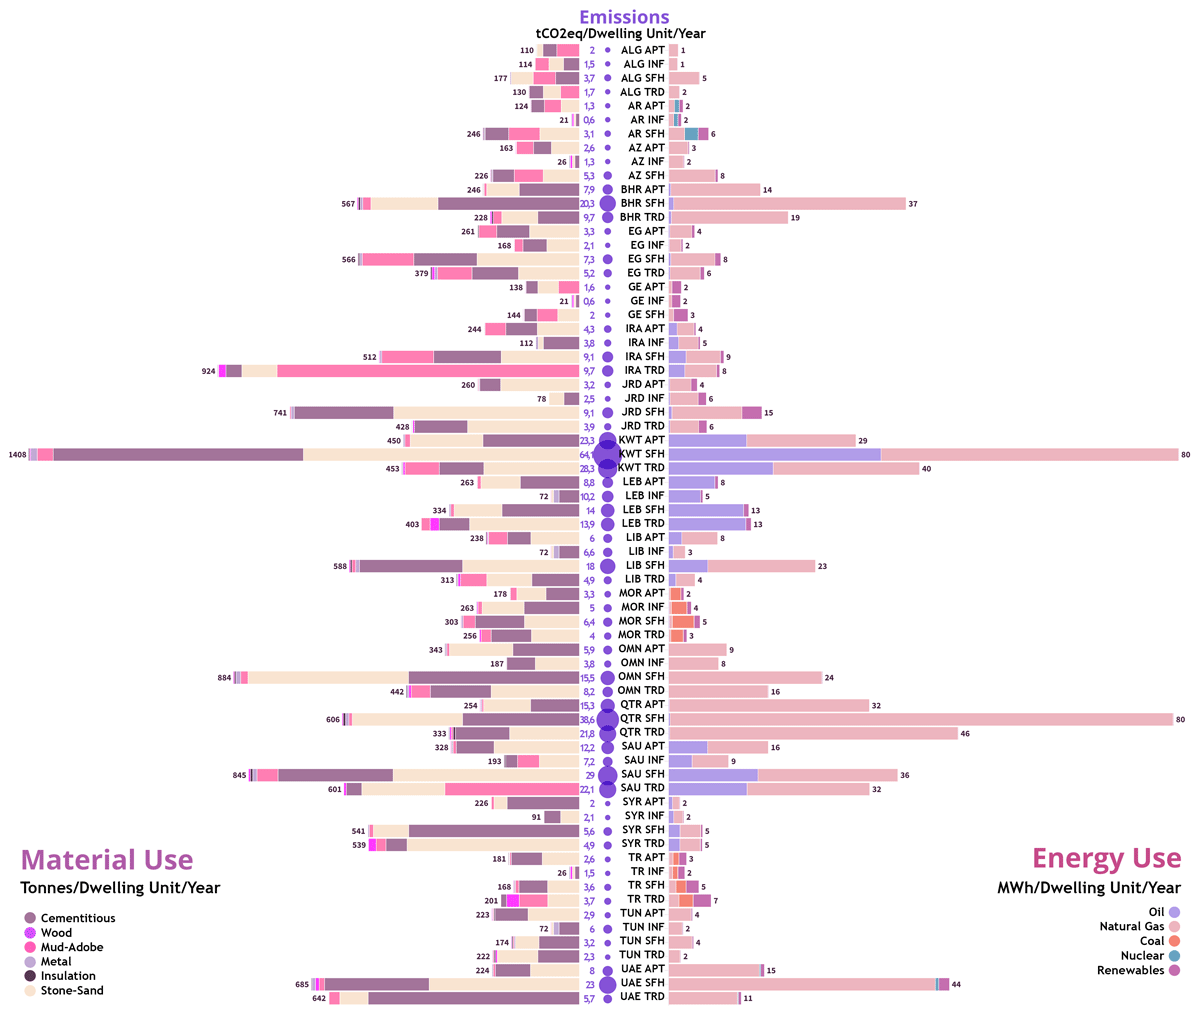
Figure 6
Comparative analysis of annualized material and annual energy use, and annualized life-cycle greenhouse gas emissions (ALCGHGE) in individual residential building dwelling units across Western Asia and Northern Africa (WANA) in 2020.
Note: The left section depicts material use in six major categories (t/dwelling unit/year). The middle section shows the resource use-associated ALCGHGE (tCO2eq/dwelling unit/year), accounting for Stages A1–A4 and B6. The right section presents energy use (MWh/dwelling unit/year) as final energy, including both direct energy (e.g. gas, coal, diesel burned in buildings) and indirect energy (electricity delivered to buildings). Indirect energy is disaggregated by generation source (e.g. oil, gas, coal, nuclear) using national electricity mixes. All values represent final energy use; primary energy inputs and generation losses are not included. Carrier shares and conversion efficiencies were based on the ODYM-RECC v1.2 framework (Pauliuk & Heeren 2020).
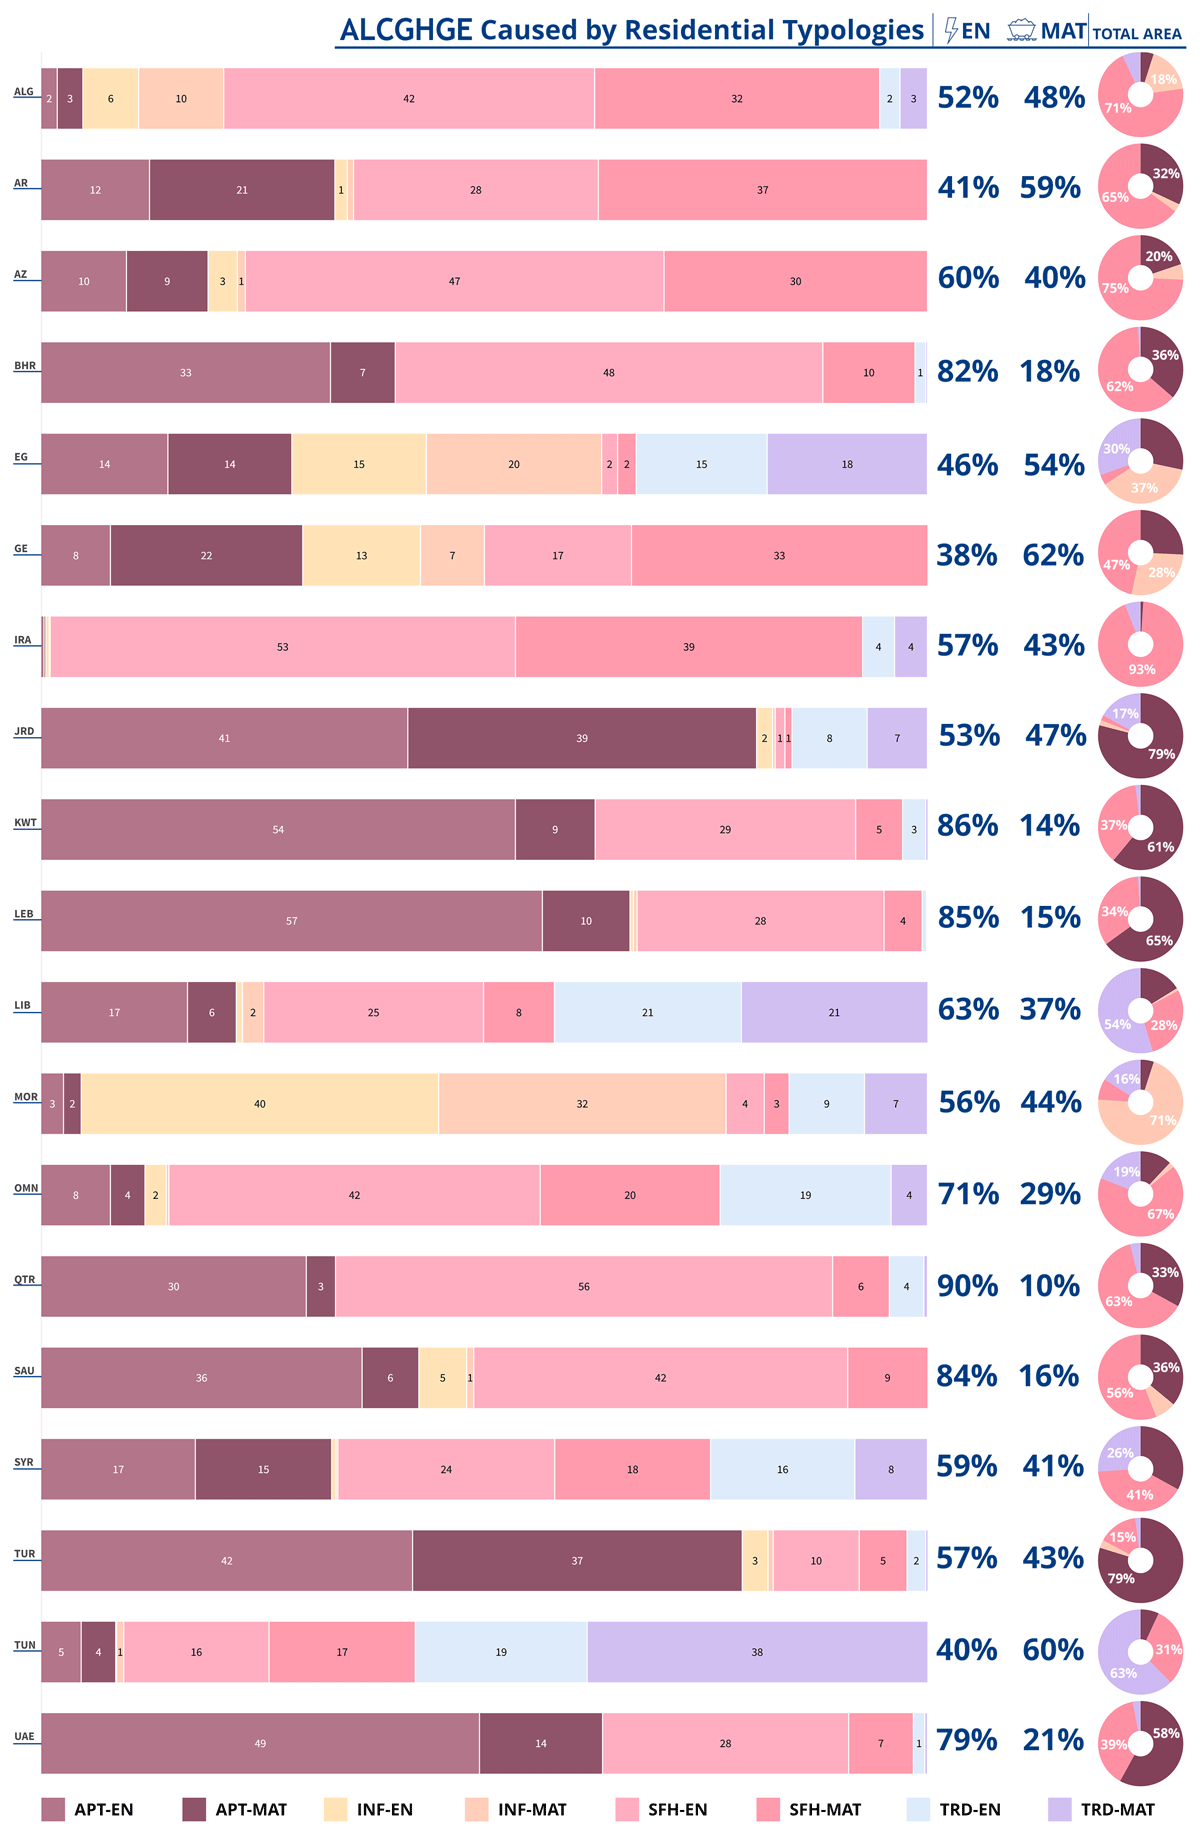
Figure 7
Annualized life-cycle greenhouse gas emissions (ALCGHGE) shares by typologies in national building stocks in 2020.
Note: The left depicts the percentage contribution of each typology to ALCGHGE, broken down by energy use (EN) and material use (MAT). The adjacent section shows the proportion of annualized emissions from material and energy use for the entire national stock. The right displays the percentage of the total area occupied by each typology in the building stocks.
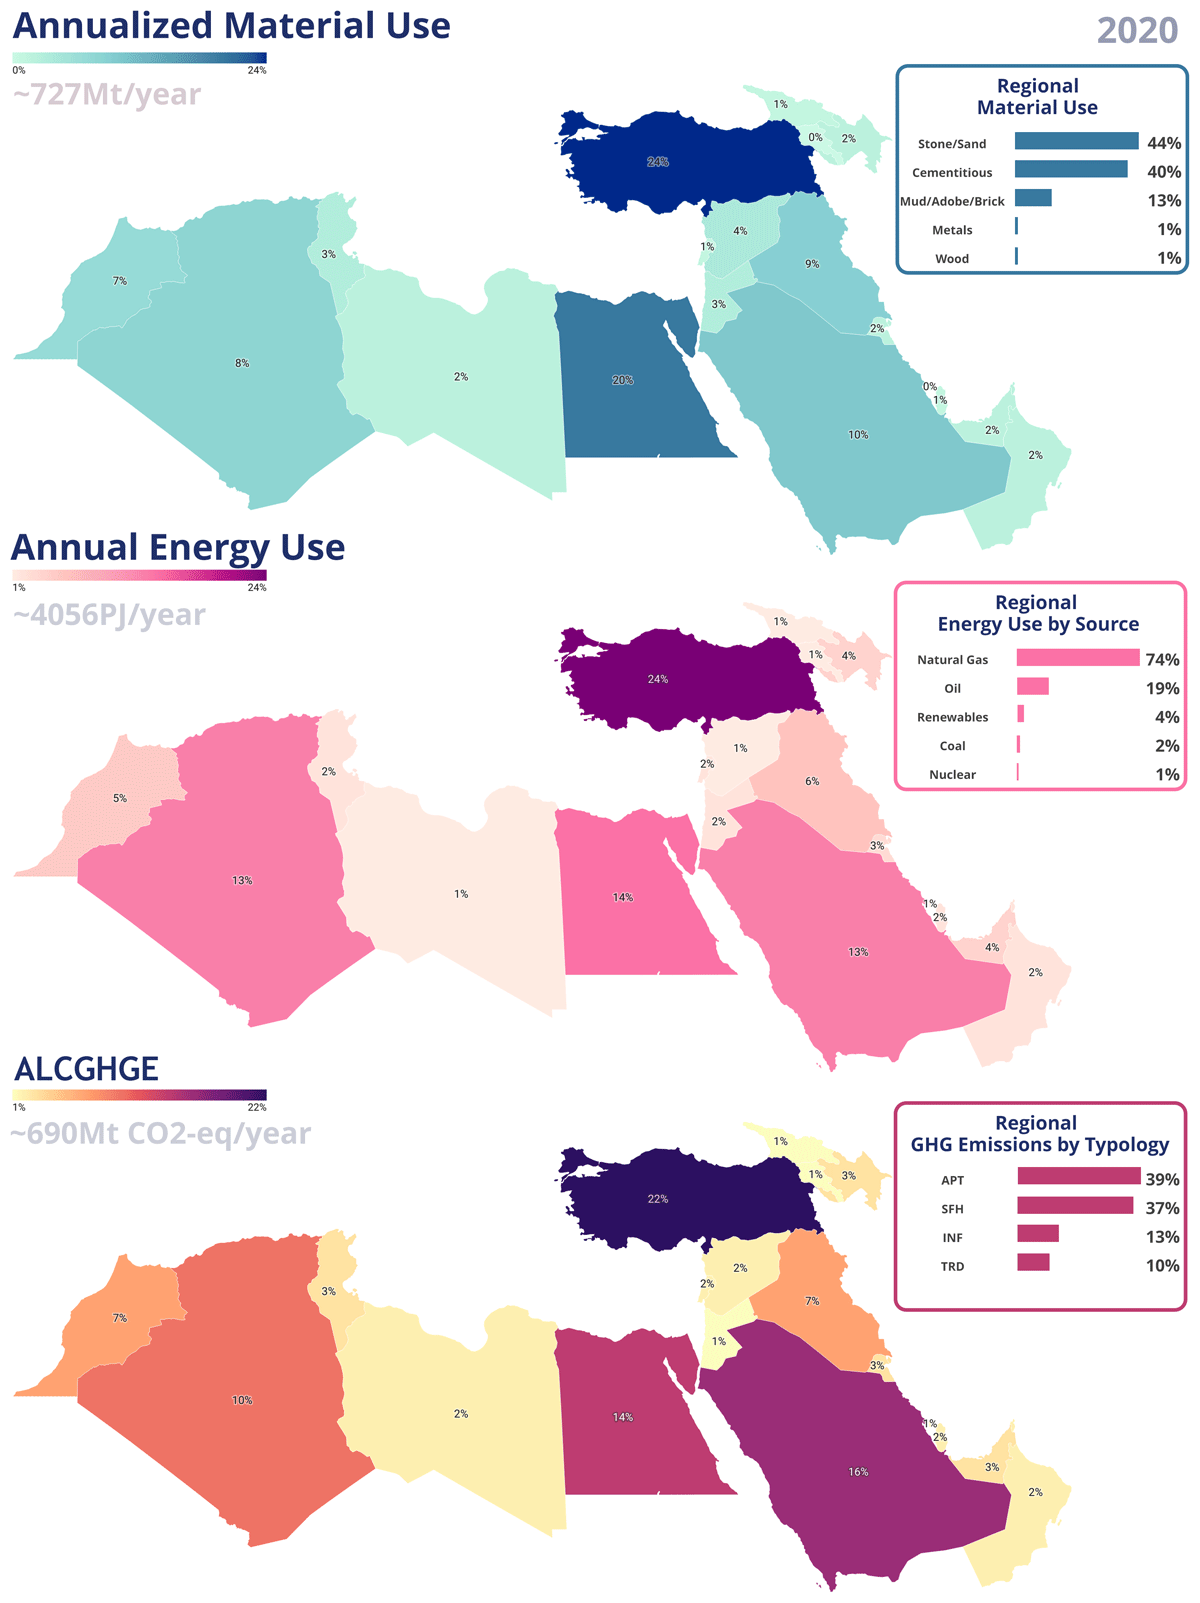
Figure 8
Breakdown of regional annualized material use and annual energy use and related annualized life-cycle greenhouse gas emissions (ALCGHGE) across countries in 2020, including their primary contributors.
Note: Darker colors represent higher percentage shares.

Figure 9
Nexus of annualized life-cycle greenhouse gas emissions (ALCGHGE), energy, and material use per capita.
Note: Number inside circles, as well as the sizes of the circles themselves, represent the ALCGHGE per capita (t/capita/year; tCO2eq/capita/year).
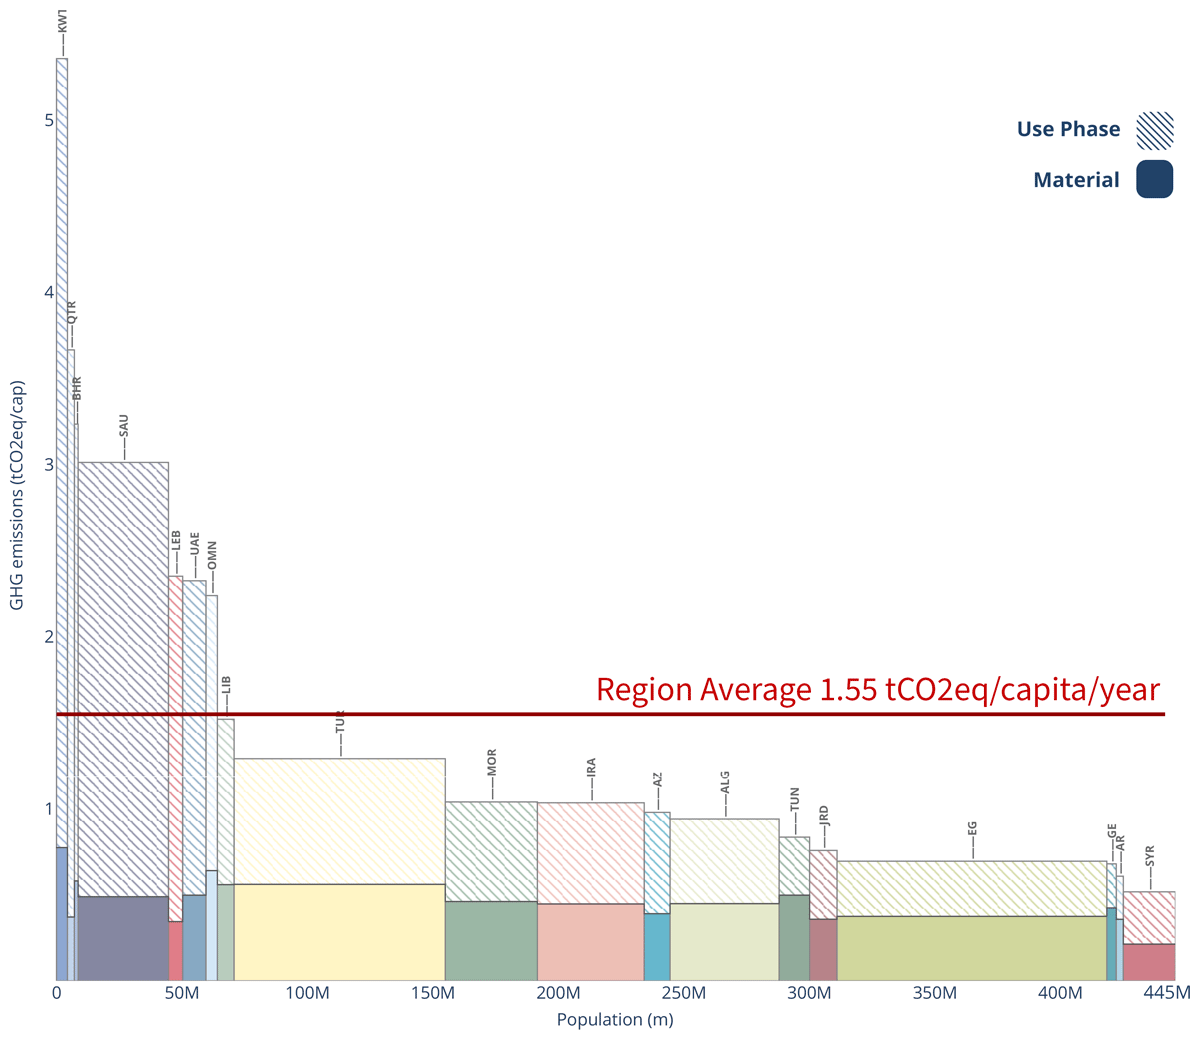
Figure 10
Comparison of total tCO2eq/capita/year among residents of different countries, segmented by annual-use phase and annualized material-related emission contributions. High emitters include the section from Kuwait to Libya, while low emitters include Armenia and Syria. The in-between is referred to as moderate emitters throughout this paper.