
Abbreviations
| ALCGHGE | annualized life-cycle greenhouse gas emissions |
| APT | apartment building |
| GCC | Gulf Cooperation Council |
| GHGE | greenhouse gas emissions |
| INF | informal building |
| SFH | single-family house |
| TRD | traditional building |
| WANA | Western Asia and Northern Africa |
1. Introduction
The increasing urgency of the climate crisis mandates the integration of climate change-mitigation strategies into the United Nations’ (UN) Sustainable Development Goals (SDGs) (UNDESA Sustainable Development 2023), promoting a global effort to reduce greenhouse gas emissions (GHGE) (Röck et al. 2020). The construction industry, particularly the building sector, uses a significant amount of resources, resulting in considerable environmental impacts (Nejat et al. 2015). Projections indicate a significant increase in global raw material usage, particularly in construction materials in developing nations, with extraction and processing expected to rise by 70% by 2060 (UNEP 2022). Buildings are responsible for approximately 40% of global energy use, which significantly contributes to GHGE, pointing out their crucial role in potential emission reductions (IEA 2023). The sector accounts for over one-third of global GHGE. Therefore, substantial reductions in building-related emissions are needed by 2030 through a shift towards low-carbon construction solutions and net-zero energy operations (IPCC 2021).
Examining residential building stocks provides insights into trends of energy and material use, enabling the identification of key areas for improvement in resource efficiency. This examination can also help reveal regional variations in construction practices, user behaviors, and emission profiles, facilitating customized approaches to climate change mitigation (Sandberg et al. 2016). As defined by the SDGs, the Western Asia and Northern Africa (WANA) regions, characterized by rapid urbanization, population growth, and diverse climates, present a unique context for examining the residential building stock (Figure 1).
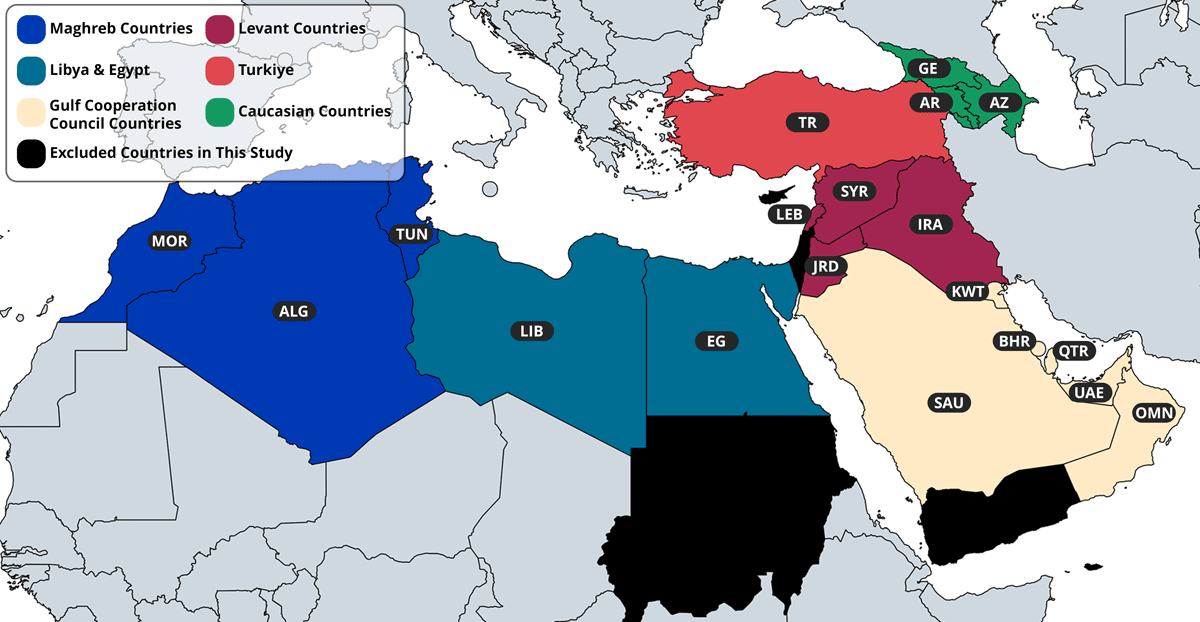
Figure 1
The study focuses on 19 countries in Western Asia and Northern Africa (WANA), examining their residential building stock typologies, operational energy use, material consumption, and related emissions.
WANA hosts a rich variety of architectural styles, from traditional courtyard houses to modern high-rise apartments, reflecting diverse cultural and historical influences that are affecting resource use and emission trends. Many traditional designs, adapted to harsh climatic conditions, incorporate passive cooling strategies and locally sourced materials. However, recent decades have seen a shift towards Western-style construction techniques and materials, often at the expense of climate-responsive designs (Al-Mumin et al. 2003). There has been a shift from traditional, locally sourced materials, such as stone, mud brick, and wood, to energy-intensive materials, such as concrete and steel (Akin et al. 2023). This transition not only increases the material-related emissions of buildings but also often results in structures less suited to the local climate, further increasing operational energy use. Traditional designs, with thick walls, small windows, and internal courtyards, often provide natural cooling and ventilation, reducing the need for mechanical air-conditioning (Al-Hinai et al. 1993). In contrast, modern buildings with large glass facades tend to be more energy-intensive, particularly in hot climates. While recent buildings use the advantages of updated construction standards, existing structures are often omitted, resulting in suboptimal performance across both traditional and modern buildings. This complex interplay of factors underscores the need for a comprehensive analysis of WANA’s residential building stocks to inform sustainable urban development strategies.
Many affluent countries in the region have historically provided energy subsidies, leading to high levels of energy use in residential buildings (Taleb & Sharples 2011). This policy environment, combined with rapid economic growth in some countries, has resulted in energy-intensive lifestyles and building operation practices, particularly in Gulf Cooperation Council (GCC) countries (Krarti & Dubey 2018). Additionally, some countries in the region (i.e. Egypt and Morocco) have significant informal housing problems, presenting unique challenges for energy efficiency and emissions reduction. These informal settlements often lack proper insulation and efficient appliances, leading to high energy use despite low overall living standards (Nutkiewicz et al. 2018).
Comprehensive studies examining residential building stocks across multiple countries in the WANA region are scarce. Previous research has primarily focused on developed countries (Iyer et al. 2023), mostly in Europe and North America (Yang et al. 2022; Mata et al. 2014). Studies in WANA have often focused on individual countries or specific building types (Ahmed et al. 2019; Mehio-Sibai et al. 2017; Cerezo et al. 2017). This study addresses this gap by analyzing residential building stocks across 19 countries in the WANA, aiming to contribute to existing knowledge by characterizing these stocks and identifying patterns in resource use and emissions. It also has implications for knowledge transfer, policymaking, and urban planning practices in terms of climate change mitigation.
2. Methodology and archetypes
For a feasible analysis of resource use and related annualized life-cycle greenhouse gas emissions (ALCGHGE) estimates in 19 countries located in WANA, it is crucial to create local archetypes that consider the unique characteristics of each country’s buildings. These archetypes are influenced by cultural norms that dictate architectural styles and building practices and historical context shaping construction techniques. Other factors include available technological advancements enabling modern designs, climatic conditions necessitating specific features for comfort and sustainability, and economic conditions determining the affordability of different building types (Nayak et al. 2023). By using these archetypes, it becomes possible to estimate energy and material use, as well as to calculate ALCGHGE associated with building construction and operation (Corgnati et al. 2013). The archetypes provide a representative basis for analyzing resource use across different building typologies; however, they remain simplified models that generalize real-world variations. While they effectively capture broad trends in material and energy consumption, certain regional and architectural nuances may not be fully reflected. Despite these limitations, they serve as a practical framework for assessing resource use at national and regional scales.
This study employs a theoretical archetype modeling approach, adopted from Akin et al. (2023), which is broken down into three stages (Figure 2). An additional procedure, life-cycle assessment (LCA), is included for ALCGHGE estimates. The updated approach developed in this paper can be considered a continuation of Akin et al.’s methodology. Details regarding each stage are provided below.
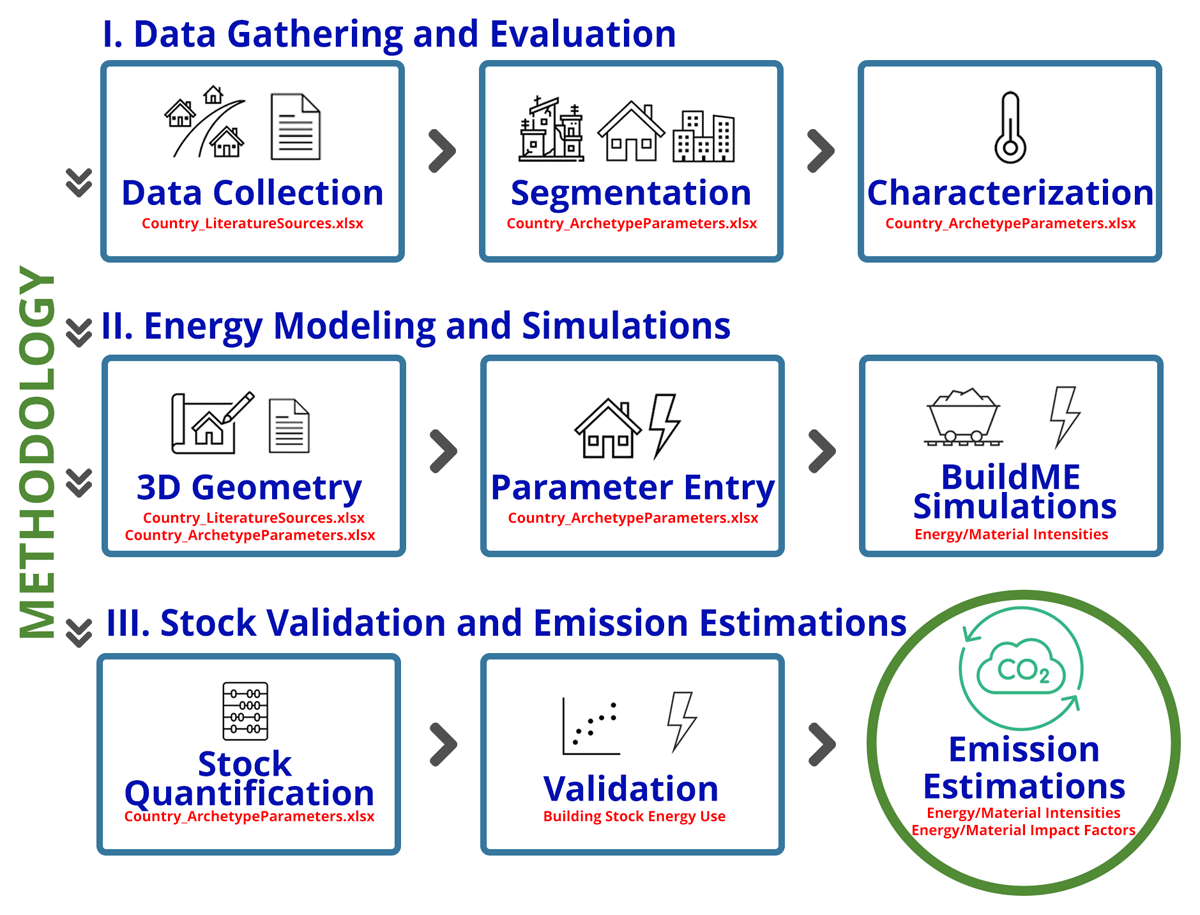
Figure 2
The central methodology of the paper for estimating resource use and related annualized life-cycle greenhouse gas emissions (ALCGHGE) in 19 countries consists of three stages: data-gathering and evaluation (archetype creation), energy modeling and simulations, and, finally, stock validation and emission estimations.
2.1 Data-gathering and evaluation
The data-collection process involves compiling both geometric and technical data related to building stocks from various sources, including textual, visual, or verbal mediums. The main objective of this stage is to identify the common characteristics of buildings, such as their form, envelope, system, and operational features, as suggested by Corgnati et al. (2013). The data collected for each country vary due to differences in data availability and were compiled into Excel sheets, which are publicly available for further examination (Akin et al. 2024).
The collected data are then filtered using a five-segment approach. This approach organizes the data based on typologies, time cohorts, primary construction materials, climate types, and access to cooling and electricity. This segmentation allows for a more accurate representation of the architectural variations in building stocks. The residential building stocks are broken down into four typologies: apartment buildings (APTs), single-family houses (SFHs), traditional buildings (TRDs), and informal buildings (INFs). The share of informal typologies per country is derived from UN-HABITAT data on the population living in slums (Our World in Data 2022).
In urban building energy modeling, cohort modeling is used to categorize buildings based on similarities in energy and material-use trends, as well as the architectural styles associated with specific time periods (Vásquez et al. 2016). The defined cohorts are illustrated in Figure 3, where blue dots indicate significant turning points or paradigm shifts in the region’s residential construction history. These shifts are often linked to major historical or socio-political events, including wars, oil discoveries, migrations, independence movements, or the introduction of new building regulations. To maintain focus, the study considers only those events that had a substantial impact on the resource use of residential buildings between 1970 and 2020, as older building stocks account for only a small portion of current residences. For example, Armenian residential typologies followed a relatively consistent architectural style throughout the Soviet Era until the 1990s. After gaining independence, a shift towards a larger floor area in flats was observed. In 2016, the government introduced the first mandatory building code focusing on operational resource efficiency, which influenced the specifications of new constructions from that point onwards (Republic of Armenia 2016).
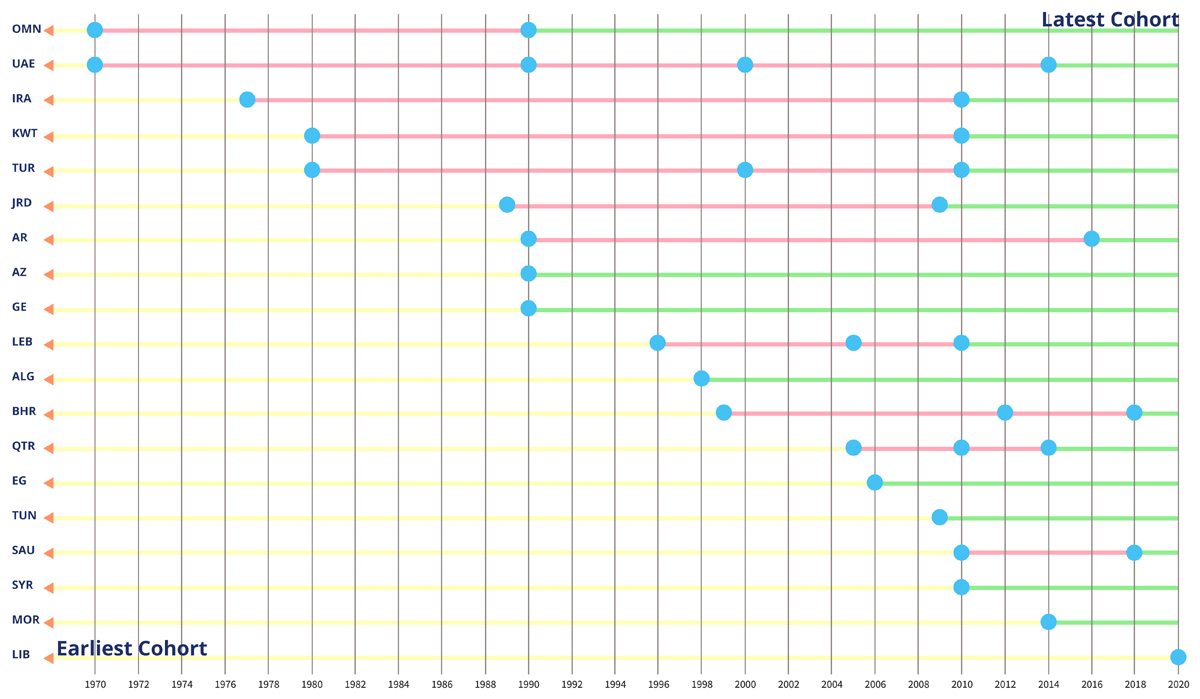
Figure 3
Modeled time-cohort characteristics for each country’s archetypes.
Note: Blue dots indicate the significant turning points or paradigm shifts in the region’s residential construction history. Yellow lines represent the earliest cohorts; pink lines the intermediate cohorts; and green lines the most recent characteristics that are still in action. For country abbreviations, see Figure 5.
The archetype development also involves characterization, where both technical and non-technical parameters that define the archetypes are determined. Form parameters include aspects such as area, floor count, ceiling height, window-to-wall ratio, and architectural design. Envelope parameters comprise construction layers with their respective U-values, structural components, and airtightness aspects. System parameters encompass domestic hot water (DHW) systems, shading devices, and types of lighting fixtures/equipment along with their energy efficiency ratings. Operation parameters include number of occupants, metabolic rates, setpoints, and operational schedules. The data collected for each input parameter are evaluated based on the characteristics of the archetype and then distributed among the archetypes. For instance, if three distinct values are identified for the types of airtightness values, the least efficient option is assigned to the older cohorts of the same typology, unless specific regulations dictate otherwise. When multiple data points exist for the same parameter, the median is calculated using the interquartile range.
The archetypes were also assigned attributes according to the most significant climatic zones of each country, especially those with separate sections on recommended thermal conditions based on different climate zones in their building codes. For example, Türkiye has four prevalent climatic zones, each with diverse recommended thermal resistance values for envelope elements including walls, windows, and roofs (Schimschar et al. 2016).
The methodology resulted in more than 850 different archetypal patterns in WANA, which serve as the foundation and major input for further operational energy modeling. These archetypal patterns along with their characteristics are stored in Excel sheets on ZENODO (Akin et al. 2024). The expanded information on data quality and uncertainty considerations are given in in the Supporting Information section.
2.2 Energy modeling and simulations
The transformation from data in Excel spreadsheets to energy models was carried out in DesignBuilder, a tool designed for building performance simulation (DesignBuilder Software 2017). Here, the three-dimensional (3D) geometry was crafted and the archetype parameters, determined during the characterization phase, were applied, along with the visual references. However, for some countries, due to a lack of data, proxies were used for the 3D geometry from similar countries with high-resolution data (Table 1). These proxy geometries are then customized with country-specific data, such as construction layers, area, occupants, thermal properties of materials, and operational setpoints.
Table 1
Proxy countries used for the three-dimensional (3D) geometry for countries without precise data.
| COUNTRIES | PROXY COUNTRIES FOR THE ARCHITECTURAL FORM OF TYPOLOGIES | |||
|---|---|---|---|---|
| APARTMENT BUILDINGS (APTs) | SINGLE-FAMILY HOUSES (SFHs) | TRADITIONAL BUILDINGS (TRDs) | INFORMAL BUILDINGS (INFs) | |
| Tunisia | Jordan | Iraq | Bahrain | Lebanon |
| Algeria | Egypt | Iraq | Bahrain | Morocco |
| Libya | Jordan | Egypt | Bahrain | Lebanon |
| Armenia | Common Caucasian | Türkiye | – | Türkiye |
| Azerbaijan | Common Caucasian | Türkiye | – | Türkiye |
| Georgia | Common Caucasian | Türkiye | – | Türkiye |
To maintain uniformity across all countries, the same simulation settings were employed. For example, ideal load settings with mixed-mode ventilation were adopted for the main heating, ventilation, and air-conditioning (HVAC) system settings, as it was not possible to find any consistent data on specific HVAC systems used at home in the region. The diverse thermal behavior of the archetype buildings under different climatic conditions is depicted using weather files. The file is chosen based on the most populous and representative cities in each climatic zone and calculated using Meteonorm (Meteotest AG 2023). It is important to note that INFs are assumed to lack HVAC cooling systems in all countries. For other typologies, access to cooling is modeled based on air-conditioning ownership data from national reports, while heating is controlled using nationally recommended setpoints collected from the literature and government documents for each country.
This process resulted in the creation of an archetype database that represents the region through 850 distinct archetypal patterns, each differing in resource use trends (Figure 4). The energy model files from DesignBuilder were exported as input data files, which were then used for additional calculations in BuildME (Heeren et al. 2023), a framework designed for computing building material and energy intensities with batch simulations using EnergyPlus engines. Structural systems, their quantities, and basements were designated as surrogate elements for material calculations, as it was not possible to be modeled accurately in building energy tools. The material calculations were based on assumptions reported in the BuildME tool (Heeren et al. 2023). These structural elements are added by the tool during the calculation of material intensities. The elements are assigned based on specific typology groups’ floor area and primary envelope material. The outcomes for material intensity were classified into 25 broad material categories, which are assumed to be the most prevalent across the regions (see Table S1 in the supplemental data online). On the other hand, energy intensity was categorized by load types, including lighting, cooling, heating, equipment, and DHW loads.
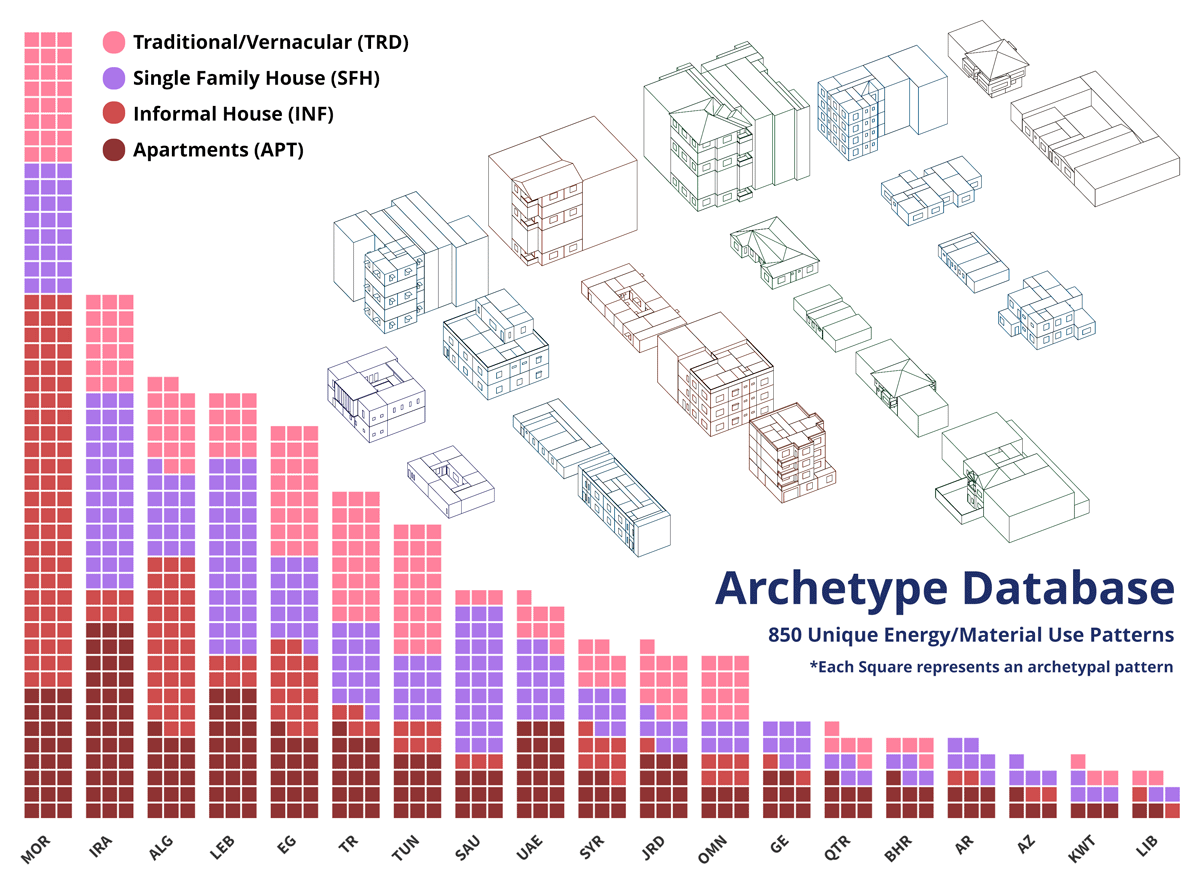
Figure 4
Employed archetypal typologies for countries, along with geometrical examples of the architectural forms that were observed in some countries in 2020.
Note: Given abbreviations are used throughout the paper.
2.3 Upscaling to national stocks
In the process of quantification, computations are carried out to estimate the distribution of archetypes across national building stocks. Along with the distribution of typologies, other factors such as the number of inhabitants per dwelling, the proportion of urbanization, and slum population rates, which were gathered during the data-collection phase, are used. These proportions are applied to the population of the respective countries and juxtaposed with the statistical building census where available. This method allows for the extrapolation of archetype resource use rates to national scales. Vacancy rates, which are sourced directly from statistical bulletins, national building stock reports from relevant ministries or local newspaper articles, are employed to eliminate occupancy-associated energy use in unoccupied dwellings. However, these vacant buildings are still considered for the calculations for the material intensity of the stocks.
The computation of nationwide residential energy use is achieved by multiplying archetypes’ energy use with the estimated number of occupied dwellings of each archetype. The aim was to create a representation for the year 2020. However, due to the unforeseen circumstances brought about by the COVID-19 pandemic, these results were validated with the average energy-use data collected between 2018 and 2020. These data were derived from two key sources: the IEA World Energy Statistics and Balances 2020 (IEA 2020b) and 2020 Energy Balances (United Nations 2023). A comparison (Figure 5) shows that the methodology generally performs well; however, there are a few exceptions. In particular, it tends to overestimate energy use in war-affected regions such as Iraq and Syria, by 6% and 11%, respectively. This overestimation is expected, given the inherent challenges in obtaining up-to-date and reliable data from these areas.
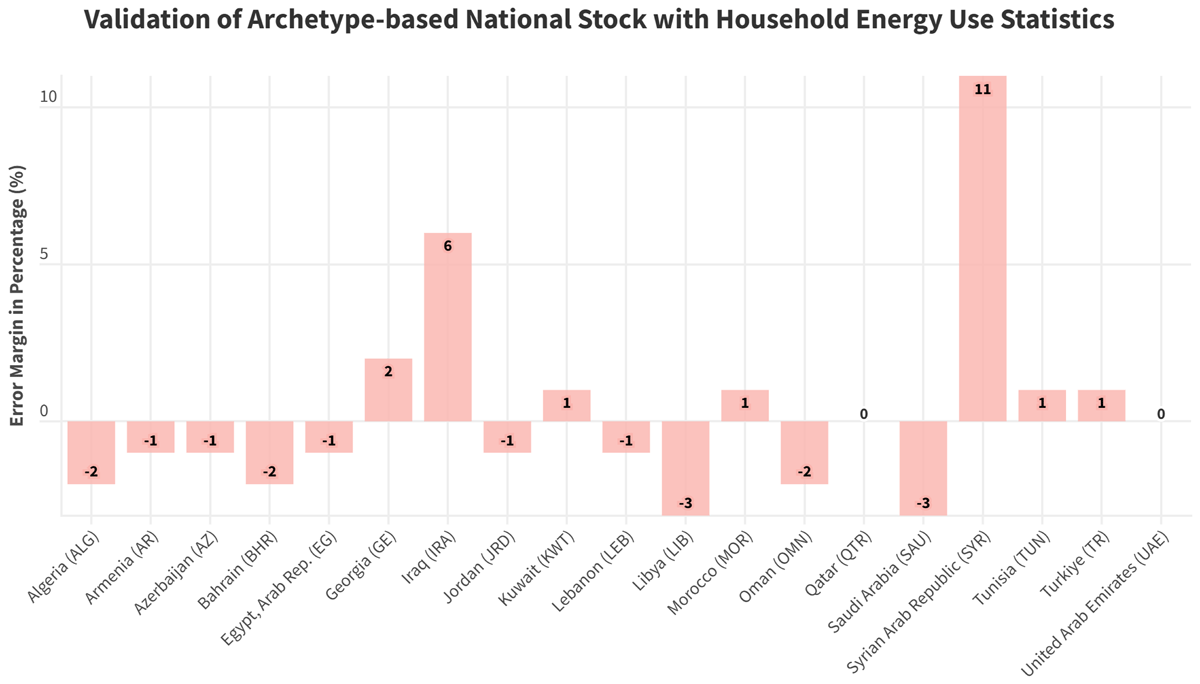
Figure 5
Calculated archetype energy demands extrapolated to the national levels and compared with the average household energy demands statistics sampled from the period 2018–20.
Note: Bars are error margins (%).
2.4 Life-cycle assessment (LCA)
In the final step of this study, resource use metrics were converted into ALCGHGE using LCA data. The analysis followed the ISO 14040:2006 and 14044:2006 frameworks (ISO 2006a, 2006b) with the impact assessment model based on European Standard EN 15978 (BSI 2011). Characterization factors were derived from the ReCiPe 2016 v1.03 life-cycle impact assessment (LCIA) method, using the Ecoinvent 3.10 cut-off system model, accessed in 2024 (Ecoinvent 2024).
The study focused on material-related and operational emissions, concentrating on Stage A (product stage plus transport to site) and Stage B6 (operational energy use). Other stages were excluded due to a lack of data or their relatively low environmental impact stages (Krych et al. 2021; Frischknecht et al. 2019). Specifically, Stage A5 (installation/construction process) was excluded due to insufficient quality data on the installation and assembly of residential buildings, and Stage B4 (replacement) was excluded due to a lack of reliable data on household repair frequency or patterns. Stage D (reuse, recycling, and recovery potential) was not considered due to the scarcity of reliable regional data on demolition and material recovery. However, generic end-of-life emissions (primarily from landfill or incineration) covered under Modules C3 (waste processing) and C4 (disposal) are implicitly included, as the study used the cut-off system model from Ecoinvent for material datasets.
The functional unit for the study is 1 m² of total floor area per year of operation, with an assumed building lifespan of 40 years (El Hafdaoui et al. 2023; Jaber & Ajib 2011). Material-related emissions are presented as annualized values, distributed over an assumed 40-year lifespan. This means that rather than representing emissions from newly constructed buildings in 2020, these values reflect the average annualized contribution of embodied carbon from the existing building stock. This approach, commonly used in building LCAs, enables a direct comparison between operational and material-related emissions over time. On the other hand, operational emissions were directly based on annual energy consumption. The global warming potential (GWP 100) indicator, at a 100-year time horizon, was used as the primary climate change impact metric, ensuring consistency with international climate policy and comparability with other studies. The indicator is expressed in kg CO2-eq as defined by the IPCC AR5 (IPCC 2014; Joos et al. 2013; Huijbregts et al. 2017). Other impact categories were excluded as this study specifically focuses on climate change impacts.
The material and energy-use intensities for different archetype buildings were obtained through simulation-based modeling. Energy demand for heating and cooling was first calculated as useful energy, using ideal loads HVAC systems as described in Section 2.2. To estimate final energy use, conversion factors were applied based on previously collected global data from ODYM-RECC V1.2 (Pauliuk & Heeren 2020). All energy values in this study are reported as final energy. Electricity use is disaggregated by generation source (e.g. oil, gas, nuclear) using country-specific electricity mixes from IEA and UN sources, but the reported values reflect delivered electricity, not primary energy inputs. Upstream generation losses are not included. Direct fuel use (e.g. coal, natural gas, diesel) was modeled separately based on national shares and usage patterns. Direct and indirect emissions were calculated by multiplying energy consumption figures with process-based emission factors, and subsequently converted to GWP using characterization factors from ReCiPe 2016.
The shares of energy sources (fuels and electricity) used in residential buildings were derived from 2020 energy balances (United Nations 2023) and the IEA databases (IEA 2020a). These sources provided country-specific data on household energy consumption, which served as a proxy for residential building energy use and enabled the allocation of electricity and fuel consumption across different end uses. Electricity was categorized as indirect energy use, primarily assigned to cooling, lighting, and appliances, while onsite fuel use (natural gas, biomass, oil) was classified as direct energy use and allocated mainly to heating and DHW demands based on UN data. This approach ensured that energy-use profiles reflected realistic household consumption patterns. Additionally, the country-specific electricity generation mix was obtained from the IEA (see Table S3 in the supplemental data online).
For material-related emissions, the geographic locations of the activities are selected either from the global values or Europe, based on the individual countries’ primary trade partners (see Figure S1 and Table S2 in the supplemental data online). The material-related activities, with their identifiers, are given in Table S3 online. The annualized material use rates for 25 different materials were multiplied by their respective GWP factors derived from the LCIA method. Finally, ALCGHGE results were extrapolated to the national level by scaling archetype-based energy and material intensities according to national building stock characteristics, using total floor area and typology distributions per country.
3. Results and discussion
3.1 Dwelling units
This section represents the average observations of individual dwelling units’ performance across different cohorts, primary construction materials, and climate zones in each country. Figure 6 shows countries’ dwelling unit-wise comparison of average residential dwelling typologies, focusing on annualized material use, annual energy use along with their associated ALCGHGE. It is important to note that the material-related emissions presented here do not reflect emissions from new construction in 2020. Instead, they are ALCGHGE, based on historical material use in the existing building stock and an assumed 40-year lifespan. These values represent a per year share of past embodied emissions attributed to each dwelling unit, allowing comparability with annual operational emissions. The areas of each individual dwelling unit are provided in Figure S2 in the supplemental data online. The 25 material categories initially identified have been further regrouped for visualization purposes, with the classification provided in Table S4 online. The annualized material content of dwelling units is calculated by dividing the material stock quantities by an average lifetime of 40 years and is used consistently throughout the analysis.
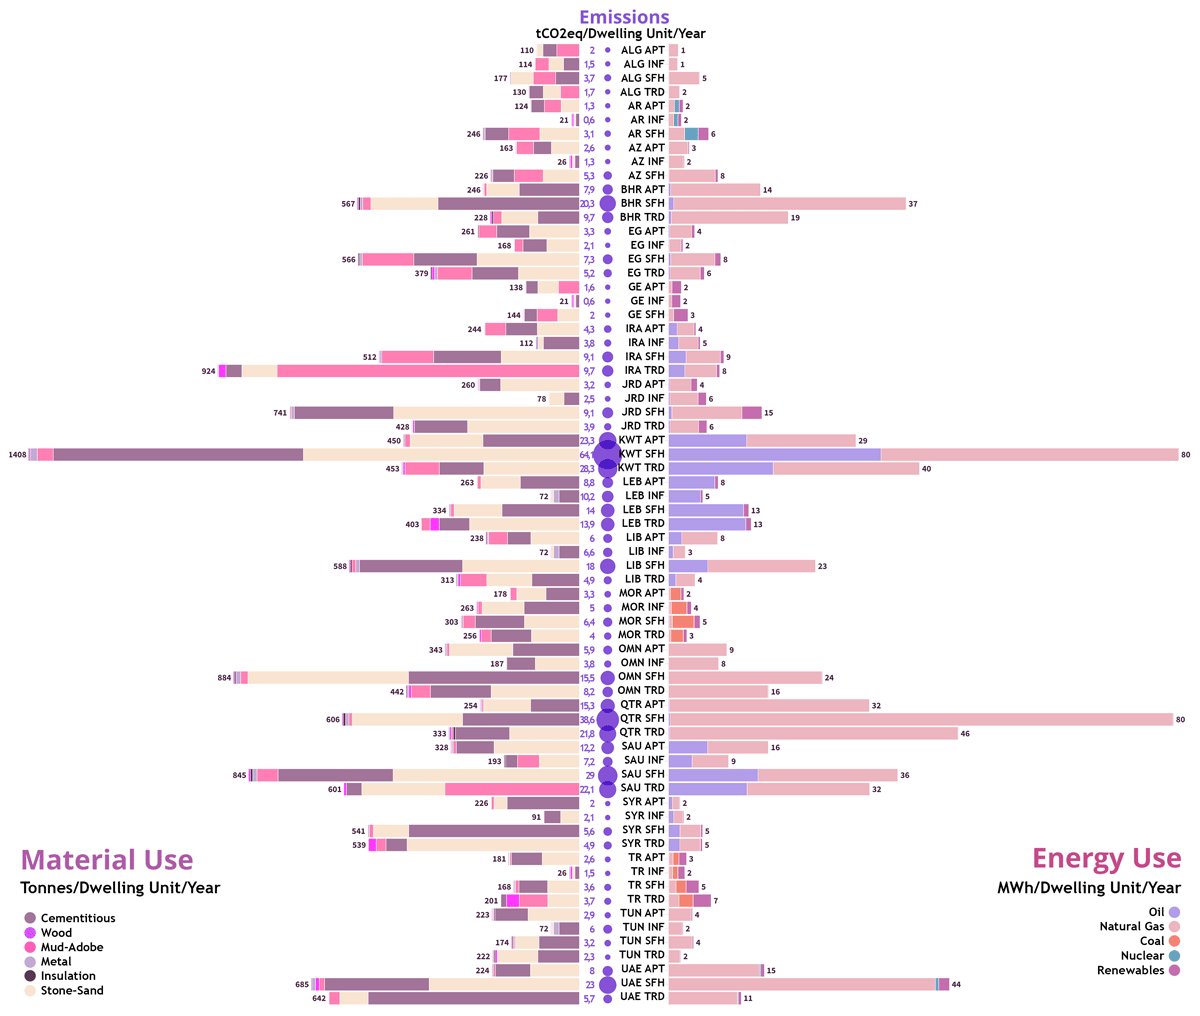
Figure 6
Comparative analysis of annualized material and annual energy use, and annualized life-cycle greenhouse gas emissions (ALCGHGE) in individual residential building dwelling units across Western Asia and Northern Africa (WANA) in 2020.
Note: The left section depicts material use in six major categories (t/dwelling unit/year). The middle section shows the resource use-associated ALCGHGE (tCO2eq/dwelling unit/year), accounting for Stages A1–A4 and B6. The right section presents energy use (MWh/dwelling unit/year) as final energy, including both direct energy (e.g. gas, coal, diesel burned in buildings) and indirect energy (electricity delivered to buildings). Indirect energy is disaggregated by generation source (e.g. oil, gas, coal, nuclear) using national electricity mixes. All values represent final energy use; primary energy inputs and generation losses are not included. Carrier shares and conversion efficiencies were based on the ODYM-RECC v1.2 framework (Pauliuk & Heeren 2020).
Dwellings in the region mainly used cementitious and stone/sand materials, reflecting the high concrete use with its widespread availability and cost-effectiveness. However, there was a noticeable prevalence of mud–adobe–brick materials, particularly in countries such as Egypt and Iraq. This prevalence was even more pronounced in specific typologies within the same country, such as TRDs. Conversely, wood use was limited and mostly endemic to Türkiye, Syria, Lebanon, Georgia, and Iraq, likely due to climatic, economic, and demographic barriers. This suggests that the choice of construction materials was significantly influenced by regional preferences and resource availability over different periods in the region.
The use of insulation materials in GCC countries is identifiable in Figure 6. This trend could be attributed to factors such as affluence, spacious dwelling layouts, or stringent regulations mandating the use of insulation materials in these countries (Ramani & García De Soto 2021). However, a more plausible explanation might be the generous floor areas, as these countries generally exhibit higher total material use compared with others (Alnuaimi 2016).
Kuwaiti SFHs had the highest material use in WANA, with 35 t/dwelling unit/year, which was almost 10 times higher than their Georgian counterparts. On the other hand, INFs consistently used the least materials across all countries, likely due to economic limitations and a lack of construction expertise. In the region, the descending order of annualized material use per dwelling unit was SFHs, TRDs, APTs, and INFs. However, Iraq, Lebanon, and Türkiye were exceptions, where TRDs often require the most material per dwelling unit. Thicker walls, up to 60 cm in vernacular constructions (Ayçam et al. 2020; Yüksek 2013), and more external surfaces due to cumbas (oriels) or courtyards could be considered as contributing factors. The latter necessitates the use of more external walls than those found in the more compact geometries of SFHs and APTs, reflecting a traditional approach to providing comfort, as discussed above. The observed variation in annualized material use suggests there are opportunities to optimize resource allocation and reduce waste in the construction process. Such insights could inform the development of typology-specific and country-focused strategies for climate change mitigation.
Figure 6 shows a consistent pattern in final energy use, with natural gas and oil as the dominant sources, particularly in GCC countries. This includes both direct energy (such as wood burning) and indirect energy (such as electricity generated from fossil fuels). The share of renewable energy sources, on the other hand, was minimal, only becoming noticeable in a few countries in the Levant, Caucasia, and North Africa. The reliance on fossil fuels for energy production indicates that renewable technologies have not yet been fully explored or utilized. Transitioning to renewable energy could provide significant environmental benefits and enhance energy security. When annual energy use per dwelling unit across all typologies in the region was compared, SFHs in Kuwait and Qatar dominated with 80 MWh/dwelling unit/year. In most countries, the highest MWh/dwelling unit/year was found in SFHs, followed by TRDs, APTs, and INFs.
An exception was observed in Türkiye, where TRDs consumed more energy than any other typology. This could be attributed to the larger floor area of Turkish TRDs, predominantly located in smaller towns where an abundance of building lots exists. These TRDs were constructed collectively before the population boom and the subsequent internal migration to larger urban hubs such as Istanbul, Ankara, and Izmir (Biehl 2014). According to the results, APTs and INFs showed the lowest energy use per dwelling unit due to their small sizes. This could also be related to the unaffordability of heating and cooling bills and equipment by the INFs’ habitants (Vilches et al. 2017), which placed this typology at the end of the list. Variations were revealed when comparisons of the same typology across different countries were made. These differences could be attributed to factors such as building insulation standards, the specific climate control needs of each region, and the level of energy efficiency measures adopted within residential buildings.
The relationship between material and energy use is reflected in the tCO2eq/dwelling unit/year values shown in Figure 6. Countries with abundant fossil resources, such as Libya, Iraq, and GCC members, show higher total emissions. This outcome is expected due to their high levels of resource consumption. The heavy use of concrete and reliance on fossil fuel-based energy production are the main drivers of these elevated emissions.
Upon analyzing the average typology groups in the region on a per dwelling unit basis, it is observed that SFHs exhibited the highest emissions, followed by TRDs, APTs, and INFs. This observation aligns with the patterns seen in resource use. However, it is important to clarify that while SFHs appear less favorable on a per dwelling unit basis, they are the least emission intensive when emissions are normalized per m² (see Table S5 and Figure S3 in the supplemental data online). Based on emissions/m², SFHs are followed by APTs, INFs, and TRDs, in that order.
While reporting emissions/m² allows for meaningful comparisons of typologies with varying floor areas, this metric has limitations. In particular, it may obscure sufficiency concerns and mask the total impact of large, resource-intensive dwellings. As such, m²-based indicators should be interpreted alongside per dwelling unit and stock-level assessments to better reflect the alignment of housing emissions with national and global ALCGHGE budgets.
Multiple factors explain why average TRDs in WANA performed poorly in both m2 and dwelling unit-wise comparisons. Many of these buildings were constructed in earlier time cohorts and discontinued due to the influences of Western architectural styles, whereas the majority of SFHs and APTs were built in later cohorts, benefiting from improved building standards and advanced construction technologies. Akin et al. (2023) support this fact, showing that in a cohort-wise comparison of typologies in GCC countries, earlier SFHs typically underperformed compared with the same-era TRDs. Another factor that could contribute to the poor performance of TRDs is the higher infiltration rates, or unintentional airflows, assumed during the modeling for the TRDs. These airflows, which occur through cracks or openings, could significantly affect the performance of these dwellings (Kirimtat & Krejcar 2018). However, in several countries (i.e. Tunisia), TRDs can still be the lowest emission-intensive across average typologies.
3.2 Countries’ building stocks
Examining the country-level results offers another perspective on emission data, given the variations in the quantities of previously studied typologies within building stocks. Figure 7 presents a breakdown of national stock ALCGHGE across different typologies, illustrating the relationship between resource use with occupied areas. As shown in Figure 7, the percentages indicate that the region’s ALCGHGE is predominantly driven by energy use. However, there are notable exceptions, such as Armenia, Georgia, Egypt, and Tunisia, where material use is the primary source of emissions. This trend may be attributed to lower energy use due to economic constraints, limiting the ability of residents to condition every room in their homes or own multiple electrical appliances. Another contributing factor could be the choice of energy production source. For instance, renewable energy plays a significant role in Georgia, while Armenia relies on low-carbon nuclear energy. In Tunisia, where 40% of the annual residential emissions stemmed from energy use, the reason could be explained by the prevalence of low energy-using Tunisian TRDs in its building stock (corresponding to 63% of the national residential floor area) as shown in Figures 6 and 7 collectively.
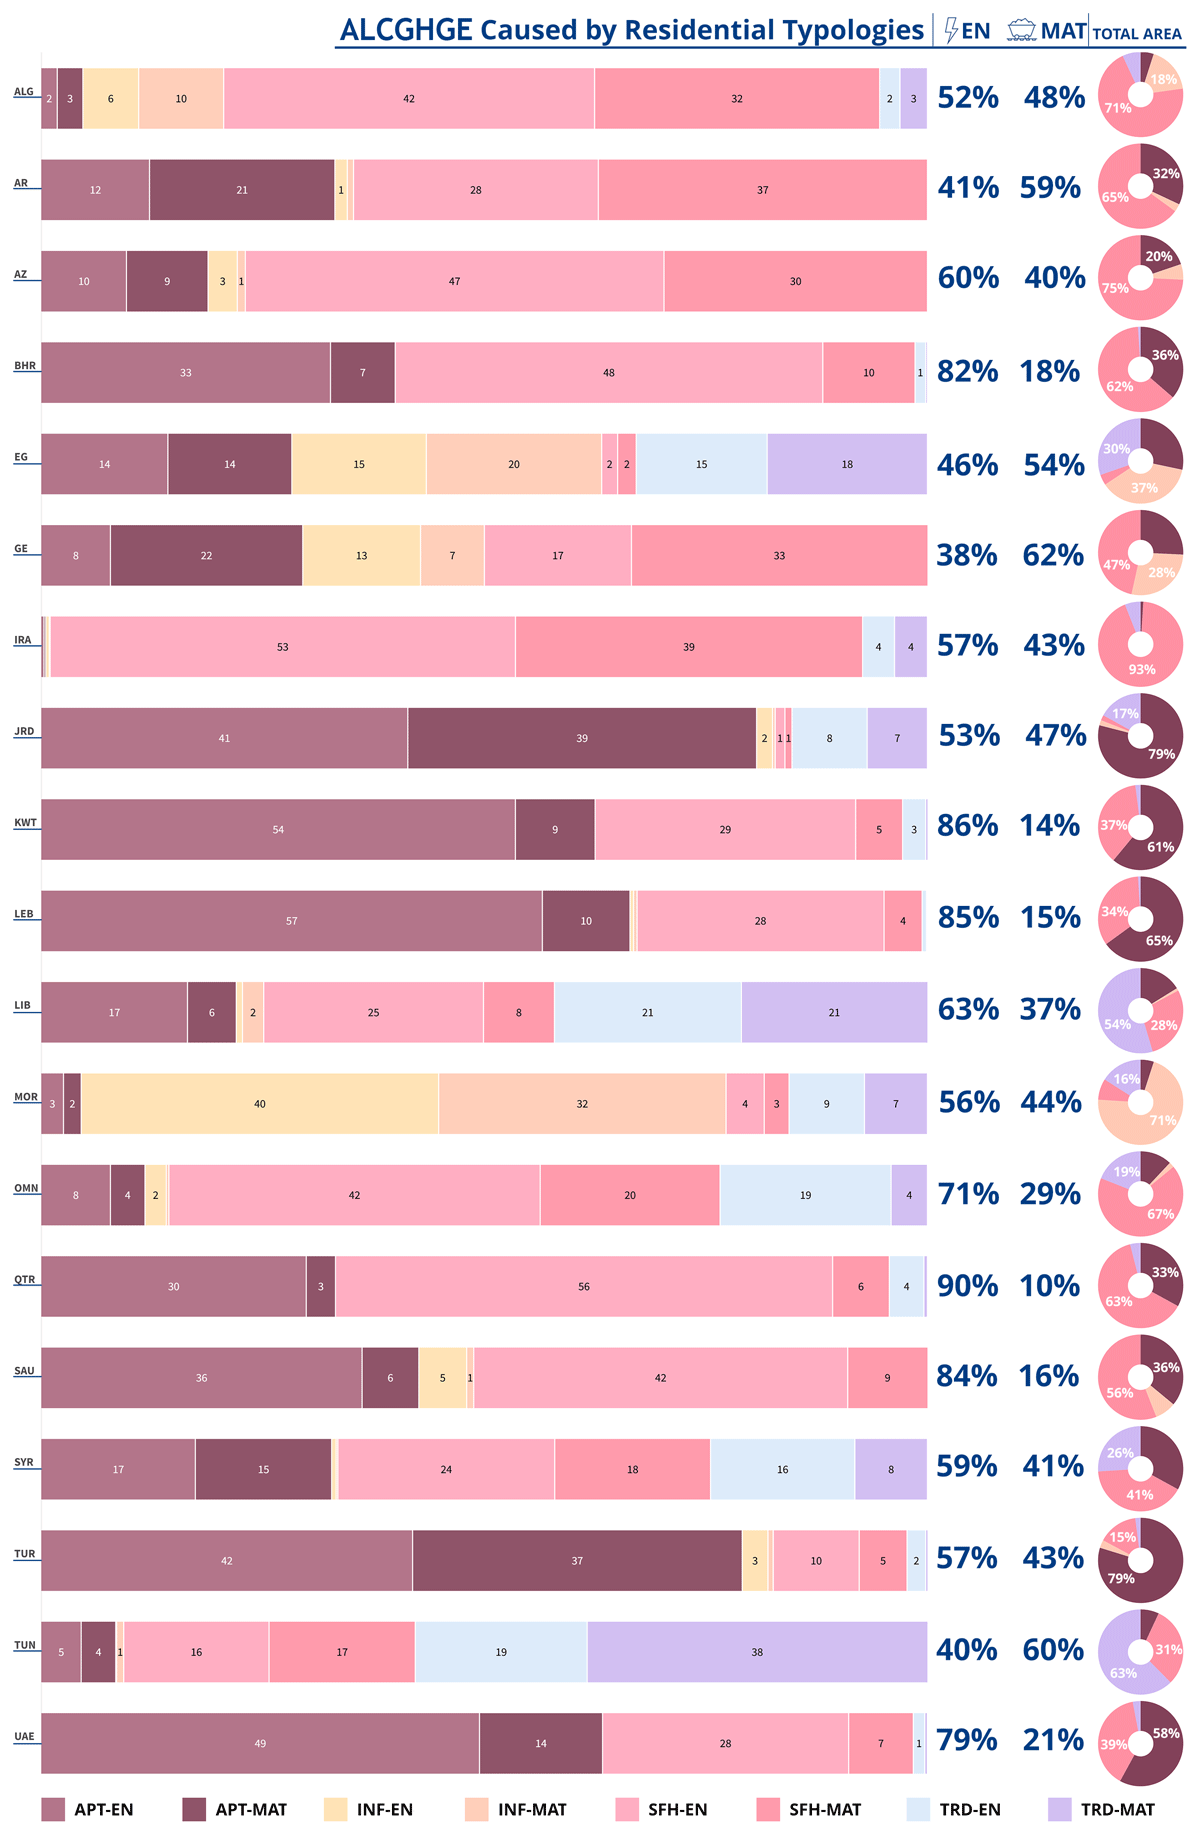
Figure 7
Annualized life-cycle greenhouse gas emissions (ALCGHGE) shares by typologies in national building stocks in 2020.
Note: The left depicts the percentage contribution of each typology to ALCGHGE, broken down by energy use (EN) and material use (MAT). The adjacent section shows the proportion of annualized emissions from material and energy use for the entire national stock. The right displays the percentage of the total area occupied by each typology in the building stocks.
In GCC countries, annual emissions from energy use were almost triple those from annualized material use. In Qatar, 90% of the residential ALCGHGE were caused by energy use. This suggests that GCC inhabitants tend to operate their buildings more intensively or require more energy to condition their rooms, possibly due to the spacious layouts of their dwellings as well as energy subsidies (Ameer & Krarti 2016). Furthermore, the reliance on natural gas and oil is also a significant factor in GCC countries.
Several typologies dominated emissions differently across countries (Figure 7). For instance, in Morocco, most of the emissions were caused by INFs, contributing 72%, with the energy use of this typology alone responsible for 40% of the stock’s emissions. INFs also contributed significantly to emissions in Egypt, Georgia, and Algeria, reflecting their high shares in the building stock. Given these findings, urban redevelopment action plans may explore the possibility of replacing these structures with low-cost, sustainable, and adaptable dwelling units. However, whether these countries can implement such plans independently, considering their developing economies, remains a challenge.
APTs dominated residential emissions in Jordan, Lebanon, Türkiye, Kuwait, and the United Arab Emirates (UAE). While there was a balance between energy and material-use-related emissions in Türkiye and Jordan, the other three countries produced significantly more energy-related emissions, almost five times more compared with material-related ones. The high share of energy-related emissions in APTs suggests that improvements in energy efficiency and the adoption of renewables may significantly contribute to climate change mitigation in these countries.
A comparison across countries provides a wider perspective on emission and resource use in a global context. According to Figure 8, the annualized material use for the entire region was approximately 727 Mt/year, which translates to an average of 1.63 t/capita/year. The regional material use breakdown showed that concrete use in homes was apparent, as stone/sand constituted 44% of mass, followed by cementitious elements at 40%. Metal use in the region was approximately 7.27 Mt/year.
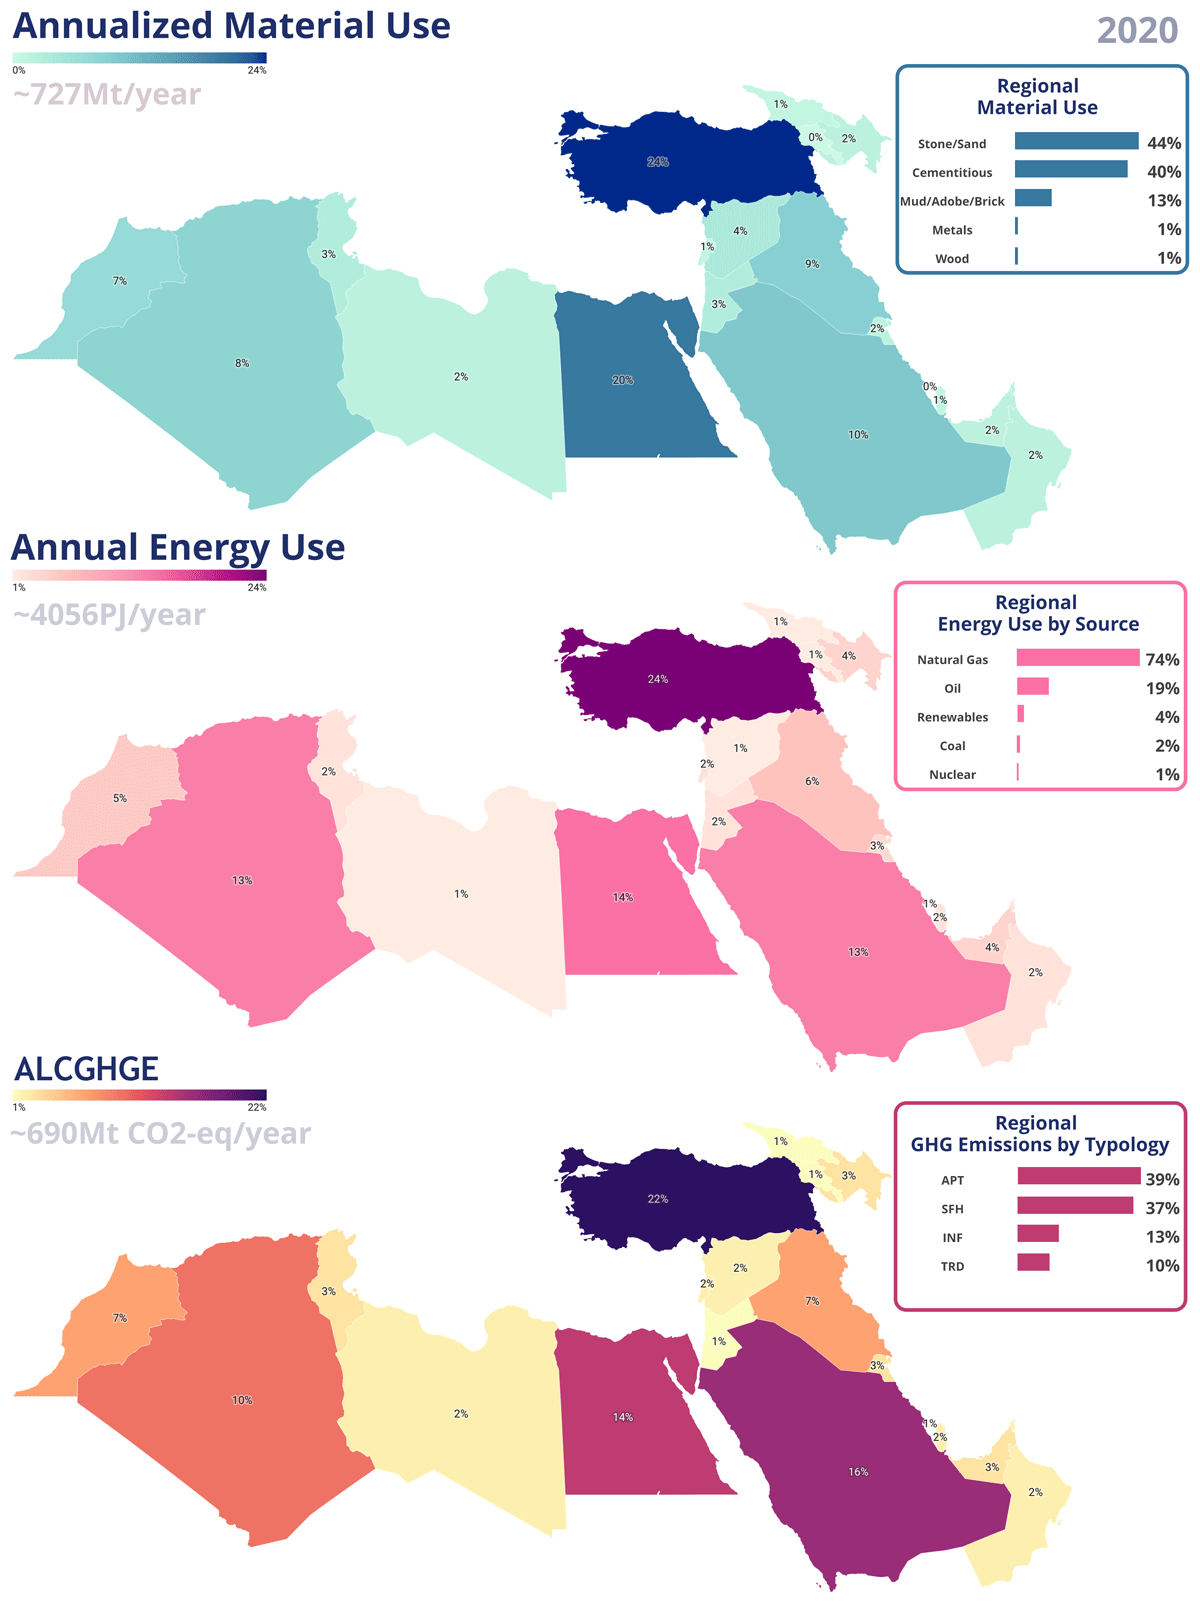
Figure 8
Breakdown of regional annualized material use and annual energy use and related annualized life-cycle greenhouse gas emissions (ALCGHGE) across countries in 2020, including their primary contributors.
Note: Darker colors represent higher percentage shares.
Türkiye accounted for 24% of total material use, followed by Egypt with 20%, while Armenia and Bahrain each contributed < 1%. These figures indicated a proportional relationship between material use and population. Türkiye’s higher material use compared with Egypt’s might be attributed to factors such as a more diversified economy, higher levels of economic development, and an increased need for structural materials due to seismic risks. These observations prompted further examination of how economic, demographic, and geophysical factors drive regional material consumption.
The region’s total annual residential energy use was an estimated 4056 PJ/year (approximately 9.1 GJ/capita/year), with natural gas being the primary energy carrier, contributing 74% of the total. Türkiye led in energy use, accounting for 24% of the regional total, followed by Egypt (14%), Saudi Arabia (13%), and Algeria (13%). Despite WANA’s high potential for solar energy (Imam et al. 2024), renewables contributed only 4% to final energy use. This gap between solar potential and actual renewable energy deployment, especially in high solar irradiance countries such as Saudi Arabia, the UAE, and Egypt, suggested that a complex mix of technological, economic, and policy challenges might be limiting solar adoption.
The region’s resource use caused 690 Mt CO2eq/year (approximately 1.55 tCO2eq/capita/year) of ALCGHGE in 2020. The largest contributors were Türkiye and Saudi Arabia. The emissions were predominantly caused by APTs (39%) and SFHs (37%), with INFs also having a significant effect at 10%. Comparing resource use and emission shares across countries allows an evaluation of the extent of excessive material or energy use relative to the regional average. For instance, Morocco was responsible for 7% of the material use, 5% of energy use, and 7% of the emissions in the region. In contrast, Algeria’s shares were 8%, 13%, and 10%, respectively. This suggests that ALCGHGE in Morocco were mostly driven by material use, while in Algeria, energy use stood out as the main contributor.
3.3 Residents
The analysis of residential resource use and ALCGHGE from a per capita perspective across WANA revealed intricate patterns (Figures 9 and 10). The per capita ALCGHGE varied, ranging from approximately 0.5 to 5 tCO2eq. This 10-fold difference underscores the heterogeneity of residential resource-use patterns in the region. Factors such as economic development levels, climate conditions, energy policies, and construction patterns all contributed to the observed variations.
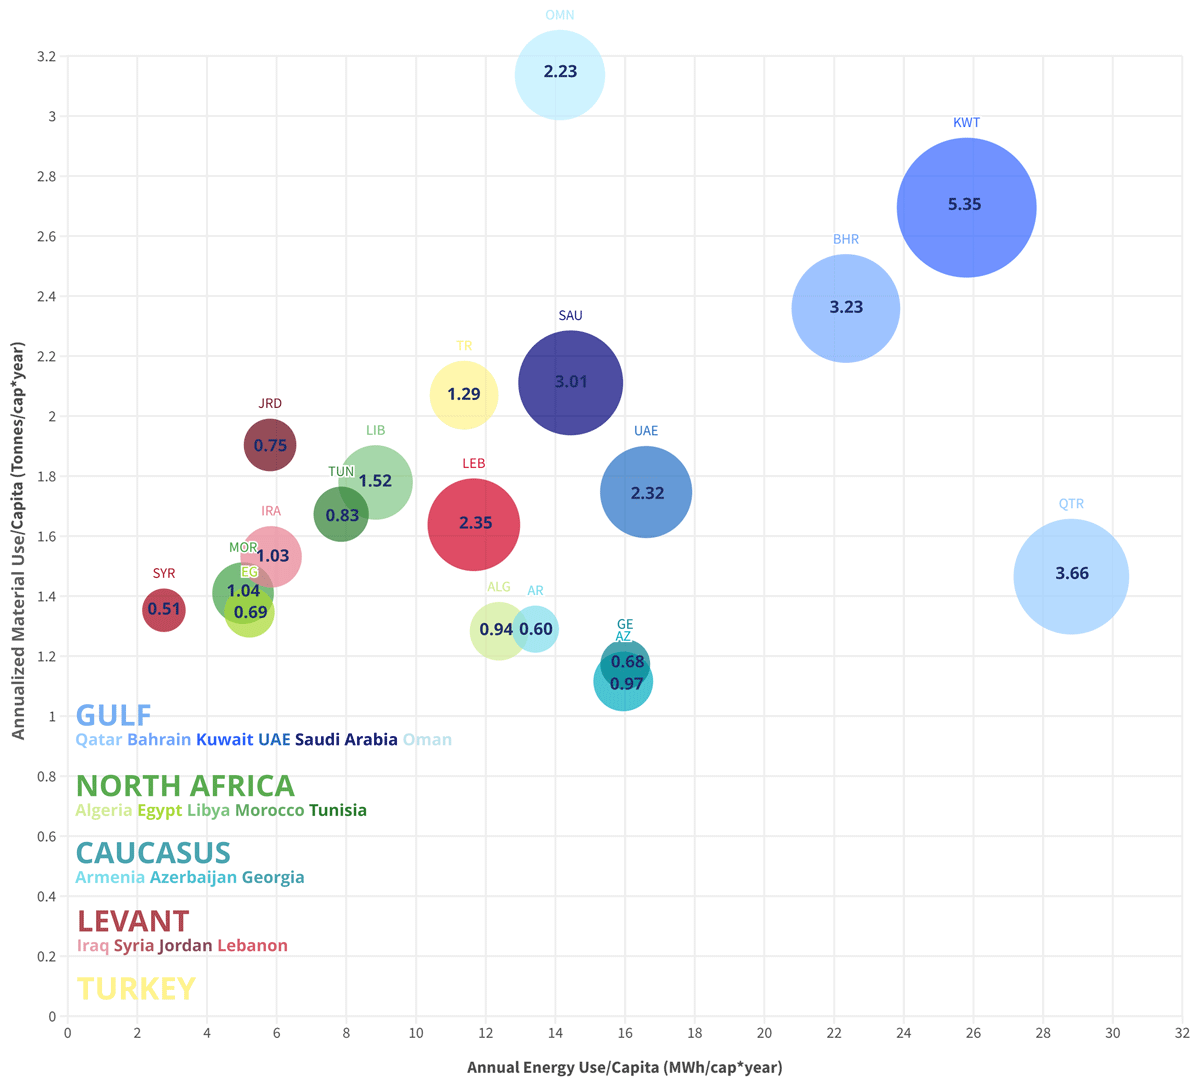
Figure 9
Nexus of annualized life-cycle greenhouse gas emissions (ALCGHGE), energy, and material use per capita.
Note: Number inside circles, as well as the sizes of the circles themselves, represent the ALCGHGE per capita (t/capita/year; tCO2eq/capita/year).
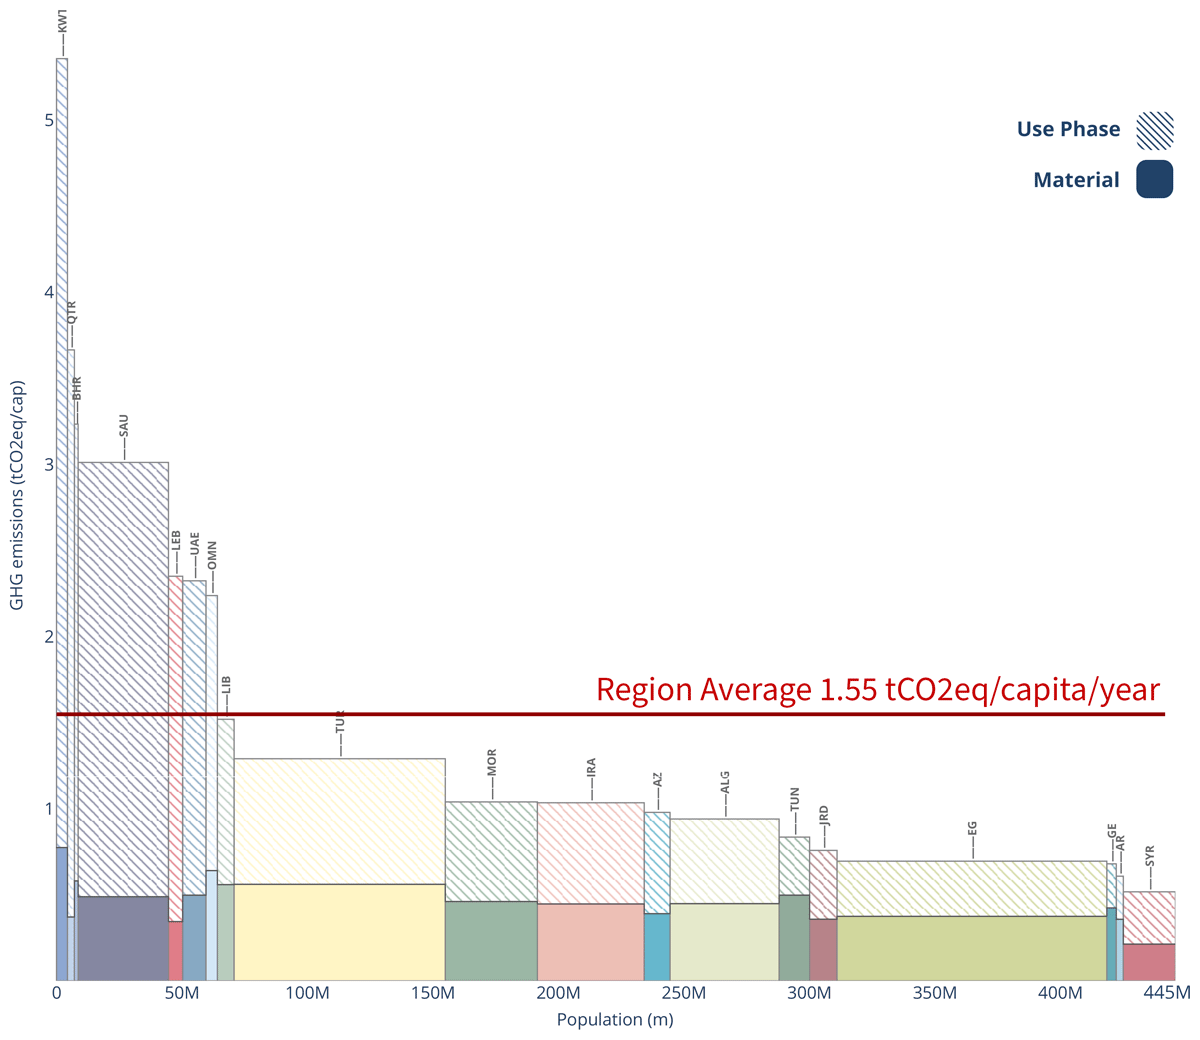
Figure 10
Comparison of total tCO2eq/capita/year among residents of different countries, segmented by annual-use phase and annualized material-related emission contributions. High emitters include the section from Kuwait to Libya, while low emitters include Armenia and Syria. The in-between is referred to as moderate emitters throughout this paper.
Figure 9 shows that while GCC nationals occupy the high-energy and material-use category, North Africans generally exhibit low emissions, and Levantines and Caucasians display lower or more consistent profiles. Figure 10 reveals significant variations in both total residential emissions and the proportion attributed to material- versus use-phase-related sources, expressed as tCO2eq/capita/year. The relatively low variability in material-related GWP impacts across countries can be attributed to several factors. First, standardized material compositions were applied across archetypes, which were developed based on the available literature, national guidelines, and expert input. These sources indicate broadly similar construction methods and material-use patterns across the region, particularly in the use of concrete, steel, and masonry. Second, globalized supply chains limit national differences in embodied emissions. Finally, the use of Ecoinvent 3.10, which applies default global or European life-cycle impact (LCI) data where country-specific inventory or impact data are unavailable, results in similar emission factors being used across countries. As a result, the apparent homogeneity in material-related ALCGHGE reflects both regional construction similarities and the assumptions and limitations of the archetype-based modeling approach.
Most countries use 1–2 t/capita/year of materials for residential purposes, suggesting that variations in construction practices have a smaller impact on overall emissions compared with differences in operational energy use, as evidenced by the much greater variability observed in energy-related ALCGHGE. This consistent dominance of use-phase emissions is evident across many countries, except for a few, such as Georgia, Tunisia, Armenia, and Egypt. In contrast, high gross domestic product (GDP) countries, such as Qatar, Kuwait, and Bahrain (World Bank 2023), show exceptionally high energy use (> 22 MWh/capita/year) (Figure 8), translating into elevated emissions that are often > 3.2 tCO2eq/capita/year (Figures 9 and 10).
Energy-related ALCGHGE variability is driven by two key factors: differences in per capita energy demand, and the carbon intensity of the energy mix. In regions with high energy use—e.g. often due to larger homes (see Figure S2 in the supplemental data online), extensive air-conditioning (Park et al. 2019), and subsidized energy prices—emissions are markedly elevated. Additionally, regions reliant on fossil fuels (e.g. Qatar, Kuwait, and Bahrain) have higher emission intensities, whereas those with greater shares of renewables or nuclear energy exhibit lower overall energy-related ALCGHGE. This underscores the combined impact of consumption patterns and energy-source characteristics on overall emissions.
In contrast, countries at the lower end of the emission spectrum, such as Syria, Armenia, Georgia, and Egypt, are accountable for < 0.7 tCO2eq/capita/year. For Syria and Egypt, this pattern could indicate a lower total energy use, potentially due to economic limitations to demand or the possession of larger homes. The phenomenon cannot be exclusively attributed to their stringent building regulations and milder climatic conditions, as these factors are also observable in numerous other nations that had elevated emissions. In the case of Syria, the low emissions were anticipated due to the ongoing conflicts causing frequent power outages (World Bank 2024). Although this was factored into the research, the results should be interpreted with caution, as the Syrian data were overestimated by 11% (Figure 4). Interestingly, Georgia presented a unique case among the low per capita-emission countries. Despite having the sixth highest energy use (16 MWh/capita/year), Georgians’ total emissions were low at approximately 0.6 tCO2eq/capita/year, with material-related emissions constituting 64% of the total. This anomaly is likely due to Georgia’s significant use of renewable energy sources, underscoring the potential for clean energy to mitigate climate change impacts significantly, even in scenarios of high energy use. In the case of Armenia, the results could be explained by the country’s nuclear energy sources, which constitute 34% of the electricity generation mix.
Figure 10 illustrates that the region’s average per capita residential emissions were 1.55 tCO2eq/capita/year. Between Türkiye and Georgia, the moderate emitters showed a range of residential sector ALCGHGE from 0.7 to 1.3 tCO2eq/capita/year. These variations highlighted significant differences in resource use, which may have reflected diverse building practices, stages of economic development, or policy priorities across the region. Notably, higher emitters within this group, such as Türkiye, Morocco, and Azerbaijan, had significant energy-related emissions. In contrast, countries at the lower end of the spectrum, such as Georgia and Tunisia, displayed a relatively higher proportion of material-related emissions, possibly due to factors such as a high rate of new construction or the use of carbon-intensive building materials.
4. Conclusions and future work
This study provides the first comprehensive analysis of residential building stocks across 19 countries in Western Asia and Northern Africa (WANA). By applying an archetype-based, bottom-up modeling approach integrated with life-cycle assessment (LCA), the energy use, material consumption, and annualized life-cycle greenhouse gas emissions (ALCGHGE) associated with diverse residential typologies were quantified. The findings highlight the significant contribution of operational emissions to total annual emissions in 2020, whereas material-related emissions are assessed through ALCGHGE profiles. While operational emissions reflect annual energy consumption, material-related emissions indicate the long-term environmental burden of past construction activities. The findings indicate that operational energy use is likely the dominant contributor to residential emissions, accounting for approximately 64% of total ALCGHGE. In energy-intensive countries such as Qatar, this share may reach nearly 90%, whereas in nations such as Georgia, energy-related emissions appear to represent only around 38% of the total. In addition, per capita emissions vary widely, with residents in high-income Gulf states (e.g. Kuwait) producing roughly 5 tCO2eq/capita/year, five to ten times more than those in lower emitting countries (e.g. Morocco).
The analysis highlights the importance of assessing emissions at different scales. While single-family houses (SFHs) have the lowest emission intensity per m2, they are the most emission-intensive per dwelling unit. This contrast suggests that although larger homes are more efficient in terms of space, they still result in higher total energy use and emissions. Similarly, material consumption varies across the region. For instance, countries such as Oman, where spacious villas are common, have higher per capita material use compared with those with more compact housing. These findings show the need for a broader assessment of residential impacts that consider both design efficiency and overall resource consumption.
It is important to note that material-related emissions were annualized over a tentative 40-year building lifespan, which was used consistently across countries. This uniform assumption provides comparability, although actual building lifespans and age distributions may vary across the region. Differences in the average age of national building stocks may also contribute to variation in results, as countries with older building stocks may be approaching higher rates of renewal, whereas others with more recently constructed stocks may reflect more current building practices. Addressing these differences in future dynamic stock studies could further improve the precision of regional assessments.
The implications of these findings are far-reaching. For high-emitting countries, there is a strong case for considering aggressive energy efficiency measures and accelerating the adoption of renewable energy to reduce operational emissions. In mid-range emitters, a balanced strategy that enhances both building performance and material efficiency through stricter codes and sustainable construction practices appears warranted. Meanwhile, low-emitting countries might benefit from leveraging their current advantages by leapfrogging to advanced, low-carbon technologies as they pursue economic growth. Moreover, this study highlights an opportunity for regional knowledge-sharing, where countries can learn from both the successes and the challenges of their peers to foster more effective climate policies.
The archetypes developed in this study provide a structured and scalable framework for assessing building stock emissions, energy demand, and material use. These models can serve as a foundation for policy formulation, particularly in energy efficiency regulations, building decarbonization strategies such as nationally determined contributions (NDCs), and resource planning. Additionally, they can be incorporated into further simulation-based studies, such as climate-responsive building designs and retrofitting strategies tailored to the region.
Beyond WANA, the methodology for establishing archetypes may be adapted to other regions with similar data constraints. Future work may enhance the framework by incorporating more detailed local data, refining material compositions based on emerging construction practices, and assessing the long-term impacts of material/energy source choices. Additionally, exploring innovative building technologies suited to regional climates and modeling future housing developments will be crucial for understanding how demographic shifts, urbanization, and technological advancements affect resource use and emissions. These insights may help policymakers and stakeholders design targeted strategies to mitigate emissions and support a sustainable, low-carbon future in WANA and beyond.
Competing interests
The authors have no competing interests to declare.
Supplemental data
Supplemental data to support the findings for this article can be accessed at: https://doi.org/10.5334/bc.488.s1
For reproducibility purposes, the generated simulation files can be shared upon request.
All literature sources used in the development of the archetypes, along with their characteristics and resource use rates, can be accessed for further reference at: https://doi.org/10.5281/zenodo.13380340