
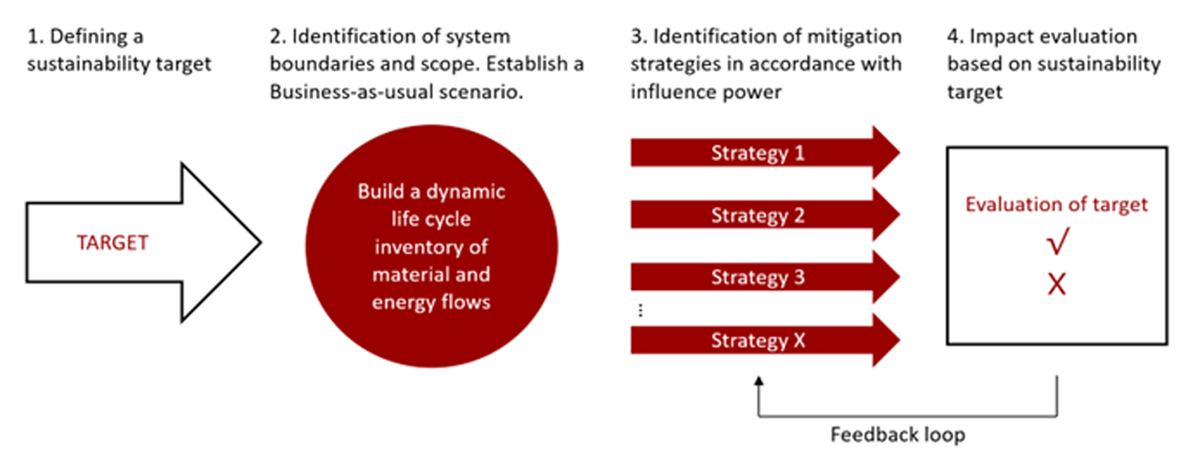
Figure 1
Methodological framework.
Table 1
The business-as-usual scenario (BAU), the mitigation scenarios (MS) and the values applied for each parameter (P)
| P1: PRIMARY RAW MATERIALS REDUCTION | P2: USE OF BIO-BASED MATERIALS | P3: NEW FLOOR AREA REDUCTION | P4: OPERATIONAL ENERGY REDUCTION | DECARBONISATION OF ENERGY GRID MIX | |
|---|---|---|---|---|---|
| BAU (business-as-usual) | 0% | 0% | 0% | 0% | 2023–2035 |
| MS 1 – Reduce primary raw material use | 30% by 2050a | 0% | 0% | 0% | 2023–2035 |
| MS 2 – Use bio-based building materials | 0% | 100% bio- based archetype | 0% | 0% | 2023–2035 |
| MS 3 – Build less by increased utilization of existing buildings | 0% | 0% | 10% by 2040a | 0% | 2023–2035 |
| MS 4 – Reduce operational energy demand | 0% | 0% | 0% | 49% by 2040a | 2023–2035 |
| MS 1 + MS 2 + MS 3 + MS 4 | 30% by 2050a | 100% bio-based archetype | 10% by 2040a | 49% by 2040a | 2023–2035 |
| MS 1 + MS 2 + MS 3 + MS 4 + decarbonisationc | 30% by 2050a | 100% bio-based archetype | 10% by 2040a | 49% by 2040a | 2023–2050 |
[i] Note: aModelled as a gradual linear reduction.
bAll new buildings and renovations are built with bio-based archetype.
cIn this combination, the expected nationwide decarbonisation of the electricity and heat grids is assumed to continue past 2035, when the current projection from the Danish Energy Agency ends.
Table 2
The global GHG budget according to IPCC limiting warming to 1.5°C (with > 50% probability), with no or limited overshoot, planetary boundary (PB) and the SoSOS allocated to the case study
| 2023 | 2025 | 2030 | 2040 | 2050 | ||
|---|---|---|---|---|---|---|
| Global IPCC AR61 | Gt CO2e | 44 [43–45] | 41 [31–49] | 31 [21–38] | 18 [7–23] | 8.09 [3–15] |
| SoSOS IPCC, case study, EPC | kt CO2e | 11.4 [9.5–13.0] | 10.0 [7.5–11.9] | 7.2 [5.0–9.0] | 4.0 [1.55–5.1] | 2.3 [0.6–3.3] |
| SoSOS IPCC, case study, AP | kt CO2e | 20.4 [17.6–23.3] | 17.0 [13.2–20.3] | 8.3 [2.1–12.6] | –1.2 [–8.3–1.3] | –7.4 [–11.5–(–4.2)] |
| SoSOS IPCC, case study, HD | kt CO2e | 0.5 [–1.3–2.2] | –0.9 [–3.4–1.1] | –3.6 [–5.9–(–1.9)] | –6.9 [–9.3–(–5.7)] | –8.9 [–10.3–(–7.5] |
| SoSOS IPCC, case study, GF | kt CO2e | 20.9 [17.5–23.9] | 18.6 [13.9–22.1] | 13.7 [9.5–17.1] | 8.0 [3.1–10.3] | 4.2 [1.2–6.9] |
| SoSOS PB,2 case study, EPC | kt CO2e | 0.61 | 0.61 | 0.59 | 0.56 | 0.54 |
[i] Note: 1Projected median annual GHG emissions for the different allocation principles, with the 5th–95th percentile in brackets. All pathway scenarios are 1.5°C consistent (with > 50% probability), with no or limited overshoot (Byers et al. 2022).
2The planetary boundary annual GHG emissions were assumed to be 2.51 Gt CO2e/year (Petersen et al. 2022). The decrease in SoSOS during time is a result of a growing population (UN Department of Economic and Social Affairs 2019).
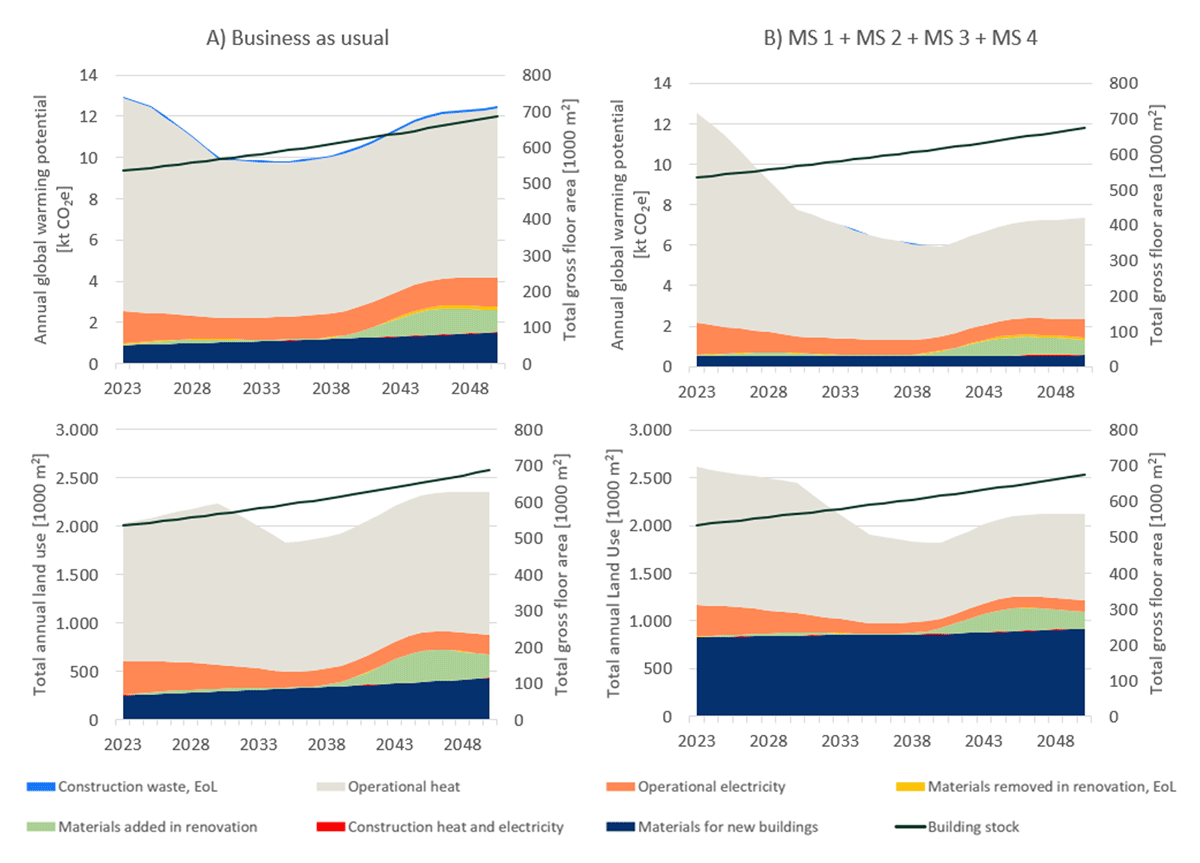
Figure 2
Annual GHG emissions for 2023–2050 for the BAU scenario (A) and the combination of all mitigation strategies (B). The contribution to the total impact is differentiated across life cycle stages.
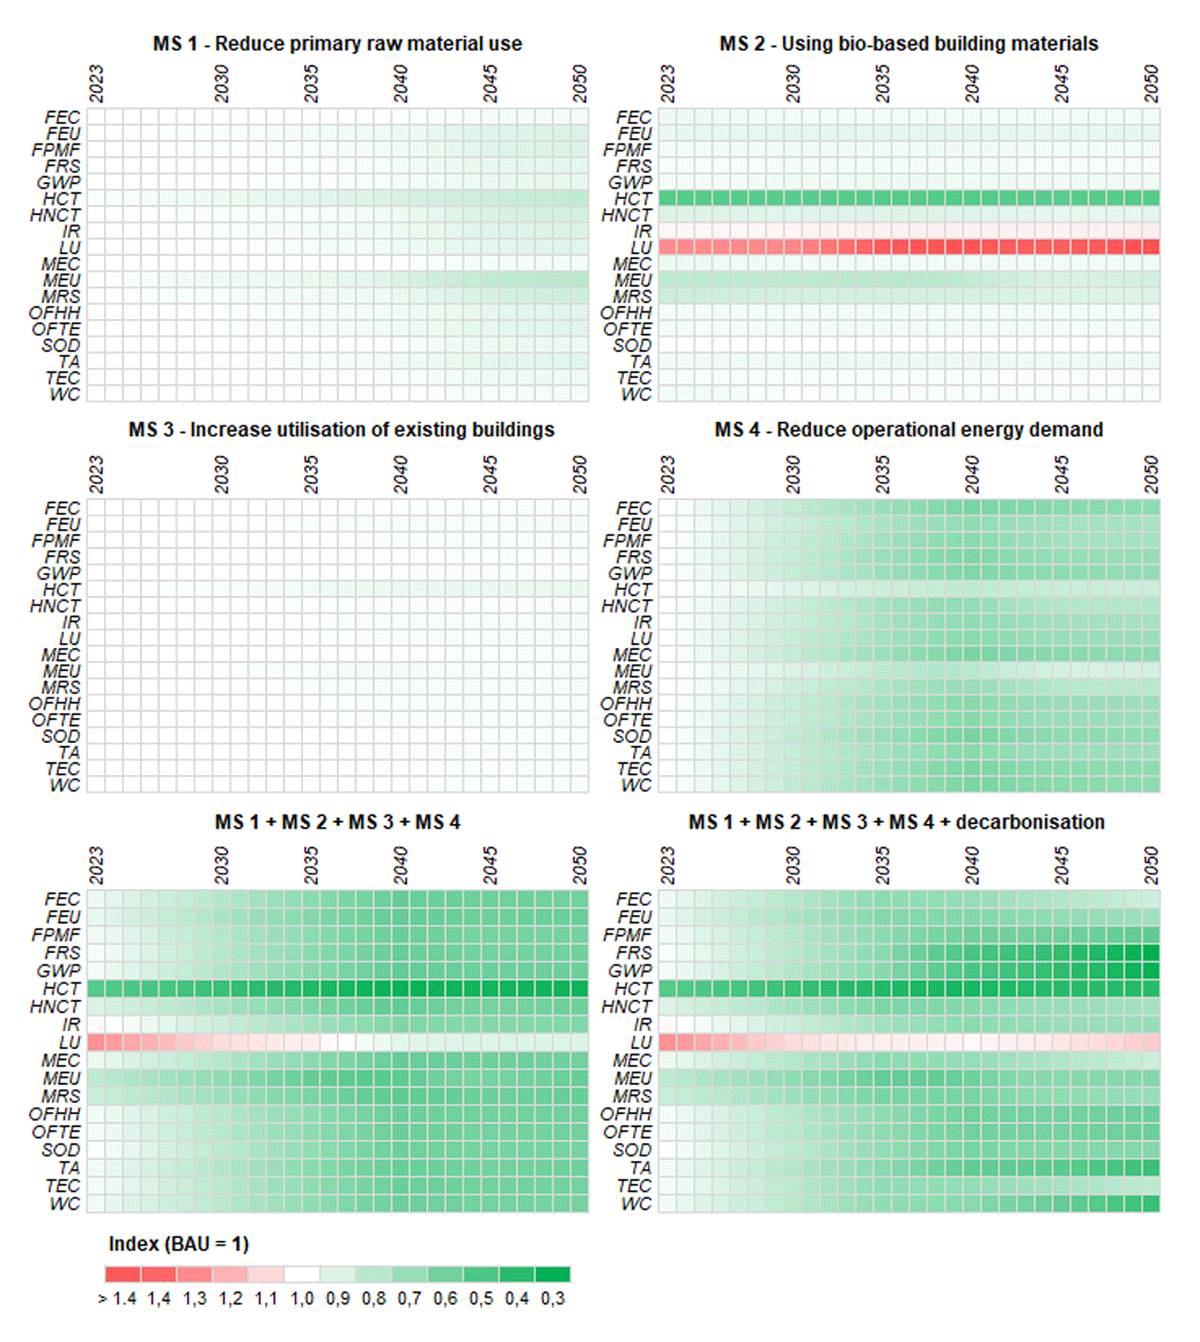
Figure 3
The annual impacts for each mitigation strategy (or a combination of several) are presented relative to the annual impact in the business-as-usual scenario, and a score less than 1 indicates that the result obtained is less than in the business-as-usual scenario.
Note: FEC = Freshwater ecotoxicity, FEU = Freshwater eutrophication, FPMF = Fine particulate matter formation, FRS = Fossil resource scarcity, GWP = Global warming potential, HCT = Human carcinogenic toxicity, HNCT = Human non-carcinogenic toxicity, IR = Ionizing radiation, LU = Land use, MEC = Marine ecotoxicity, MEU = Marine eutrophication, MRS = Mineral resource scarcity, OFHH = Ozone formation (human health), OFTE = Ozone formation (terrestrial), SOD = Stratospheric ozone depletion, TA = Terrestrial acidification, TEC = Terrestrial ecotoxicity, WC = Water consumption.
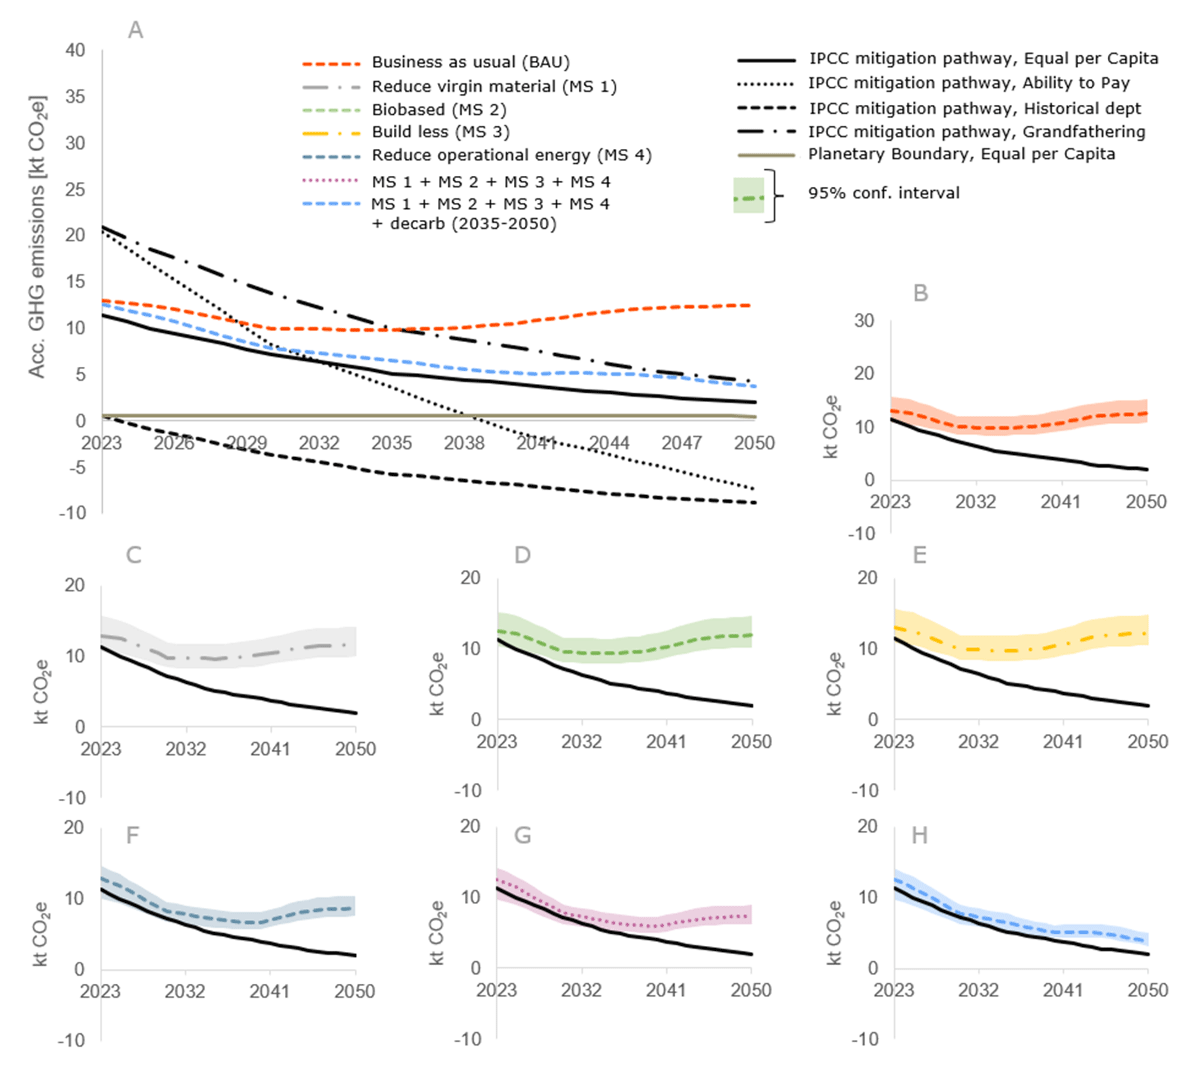
Figure 4
(A): Accumulated GHG emissions for 2023–2050 and targets. The black lines indicate the allocated share of the global reduction target using different allocation principles and the grey line indicates the allocated share of the planetary boundary; (B): business-as-usual scenario; (C–F): the four mitigation strategies; (G–H): a combination of all mitigation strategies both without (G) and with (H) decarbonisation of the electricity and heat mix after 2035.
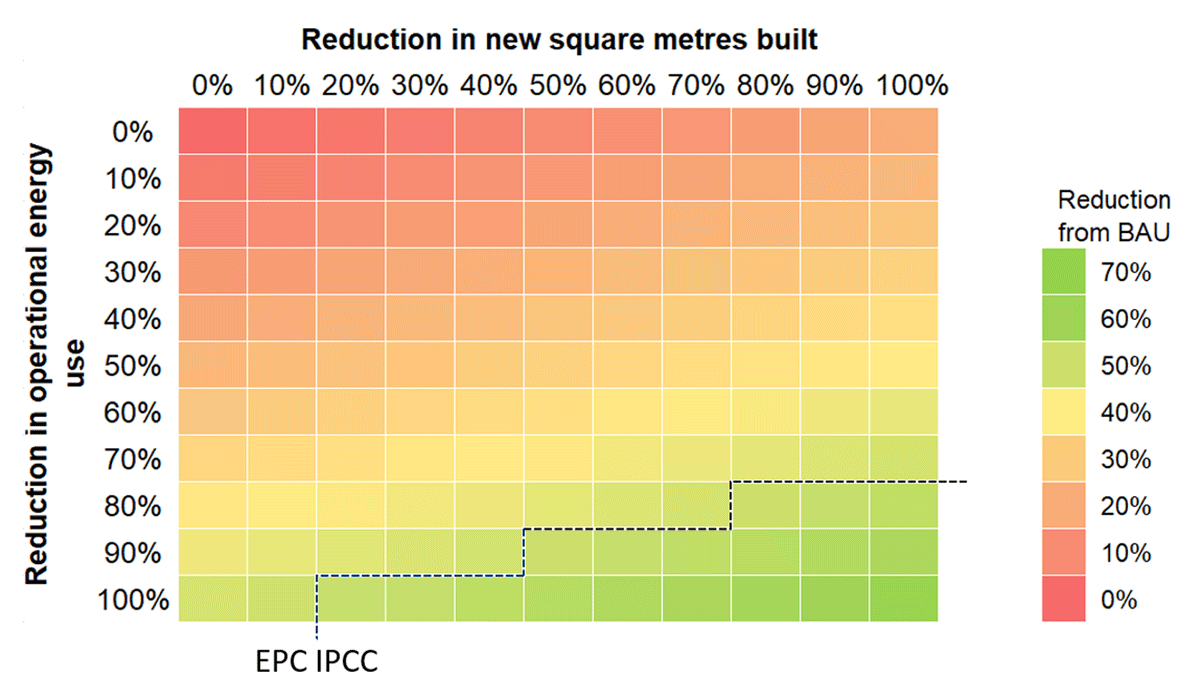
Figure 5
Solution space when combining two parameters.
Note: Green areas below the dashed lines indicate that the resulting emissions for the time period 2023–2050 complies with the target. In this illustration, a scenario is assumed to align if the accumulated impacts are below the accumulated target.