
1. Introduction
Globally, cities are growing as more people are moving from rural to urban areas. In 2018, 55% of the world’s population lived in cities, and the number is expected to be about 68% by 2050 (UN Department of Economic and Social Affairs 2018). In a recent IPCC report (IPCC 2021), it was stated that, unless dramatic reductions in greenhouse gas (GHG) emissions occur in the coming decades, global warming of 1.5°C will be exceeded during the 21st century. With rapid urbanisation, the influence of urban decision makers grows, as does their responsibility for incorporating sustainability targets into strategic urban development. Cities all over the world face the challenge of how growth can be decoupled from emissions to ensure mitigating impacts in absolute terms (City of Copenhagen 2016; City of Melbourne 2018; Tokyo Metropolitan Government 2019).
Strategic planning has no single definition. However, one possible definition is ‘a set of concepts, procedures, and tools that must be tailored carefully to whatever situation is at hand if desirable outcomes are to be achieved’ (Albrechts 2004). Since the beginning of the 1990s, efforts in forming strategies for cities, regions and subregions in Europe have grown (Salet & Faludi 2000). Since the beginning of the 21st century, ‘sustainable development’ has become the most dominant global concept in the narratives of strategic spatial planning (Gunder & Hillier 2009). However, the literature also points to the vagueness of the concept, and that it often simply serves as a ‘feel-good concept’ as no one would argue for ‘unsustainable development’ (Allmendinger & Haughton 2012; Metzger & Lindblad 2020). In this study, strategic urban planning is referred to as the process of developing long-term strategies to guide growth and development with the purpose of meeting the needs of the city.
To create robust environmental urban planning decisions rather than ‘feel-good-concepts’, it is necessary to quantify the environmental impacts of urban development strategies to avoid transgressing potentially catastrophic climate tipping points (Lenton 2011). By evaluating strategies against an absolute target, relative sustainability assessments are moved towards absolute sustainability. Absolute environmental sustainability assessments compare the environmental impact of an anthropogenic system to an allocated share of the carrying capacity of the earth system, e.g. as derived from the 1.5°C climate limit (Bjørn et al. 2020). In this study, the GHG targets are tested in relation to the environment’s carrying capacity, as defined in the planetary boundaries, but also on mitigation pathways that allow emissions within a budget that keeps temperature increases below 1.5°C (Byers et al. 2022). These two different approaches were chosen to demonstrate how a reduction roadmap aligned with the Paris Agreement could be outlined starting from current emission levels. However, they also show what the end goal being in alignment with the planetary boundaries would require (Petersen et al. 2022).
While countries have hesitated to take action, many large cities have taken a proactive role in climate mitigation. Forty-one cities have published 1.5°C-compatible climate action plans through the C40 Climate Action Planning Program (C40 Cities 2022). These plans focus on Scope 1 and 2 emissions following the Greenhouse Gas Protocol (GPC) Framework (WRI et al. 2018). Scope 1 emissions are defined as GHG emissions from sources located within the city boundary and Scope 2 emissions are associated with energy provided by the grid. Scope 3 emissions, defined as other emissions occurring outside the city boundary as a result of activities taking place in the city, are often neglected (C40 Cities; ARUP 2016). Scope 3 emissions include impacts from construction products produced outside the city but used within it. On a global scale, materials for buildings are responsible for 9% of total process-related and energy-related GHG emissions (UNEP 2022), underlining the importance of cities taking responsibility for their consumption of construction products. Targets for cities typically prioritise infrastructure, mobility, waste, energy use and supply, as seen for Copenhagen, London, Tokyo and Melbourne (City of Copenhagen 2016; City of Melbourne 2018; Greater London Authority 2018; Tokyo Metropolitan Government 2019). This paper explores how local authorities, portfolio owners and other decision makers can strategically address the building stock, including embodied emissions from materials, by considering Scope 1, 2 and 3 emissions.
Aligning GHG targets for the construction sector with national climate change commitments such as nationally determined contributions (NDCs) currently represents an important knowledge gap. Countries only report on territorial emissions, i.e. excluding all imported materials (Giesekam et al. 2018). For construction, non-territorial emissions present a significant contribution, e.g. in the UK this contribution is estimated to 30–40% of GHG emissions related to the built environment (UKGBC 2021). Currently, there is therefore a risk of overlooking the potentially overshadowing indirect emissions occurring outside national or city boundaries (Mi et al. 2016; Wiedmann et al. 2021). To close this gap, this study accounts for all consumption-related emissions. The term consumption-based emissions refers to emissions induced by activities in the area, regardless of whether the emission actually occurs outside the area. Consumption-based accounting holds that the consumer should be held accountable for creating the demand (Torpman 2022).
To study the long-term effects of strategic planning, a combination of material flow analysis (MFA) and life cycle assessment (LCA) can be used (Dias et al. 2018). MFA can be used to simplify complex systems, such as a neighbourhood or city, by using archetypes to understand material flows, processes and stocks. Furthermore, MFA allows for retrospective analysis of past developments, and future forecasting-based trends and assumptions, such as technological developments, and changing drivers, such as consumer behaviour (Brunner & Rechberger 2016). By coupling traditional LCA modelling with MFA, the static LCA inventory is adapted with a temporally dynamic approach, providing transparency on long-term potentials and a better understanding of emission timing. Applying a dynamic assessment framework is especially relevant when studying building stocks because of buildings’ long life spans, as well as the possibility to look into several possible futures by integrating parameters over time based on past observations and realistic assumptions (Stephan et al. 2022).
The contribution of this modelling framework is demonstrated through a case study on a building stock in an urban area. The method applied seeks to illustrate the potential of a) analysing environmental impacts of different mitigation strategies and b) evaluating the strategies consistency with the global commitments to limiting climate change as set by the Paris Agreement and the planetary boundaries for climate change.
2. Materials and methods
2.1 Methodological framework
This section introduces the methodological framework to quantify the long-term effects of strategic decisions. Sections 2.2–2.5 clarify how this was carried out for the case study. The methodological framework consists of a step-by-step structure, as illustrated in Figure 1, to set targets, analyse and draw conclusions based on different mitigation strategies’ compliance with the defined targets. The first step is to define a sustainability target, e.g. comply with the planetary boundaries. The second step involves defining the system boundaries and scope. The scope and thus level of detail should reflect the targeted decision maker’s influence and power. As the task of building a dynamic inventory and establishing a business-as-usual (BAU) scenario can be very time-consuming, it is important to keep in mind the means of mitigation that are under the influence of the decision maker. The third step involves identifying mitigation strategies based on a hotspot analysis of the BAU scenario. Apart from establishing the sources of the activities that contribute the most and are thus the most important to address, the mitigation strategies should be based on which actions are within influence of the decision makers. Lastly, the mitigation strategies are evaluated based on the sustainability targets.
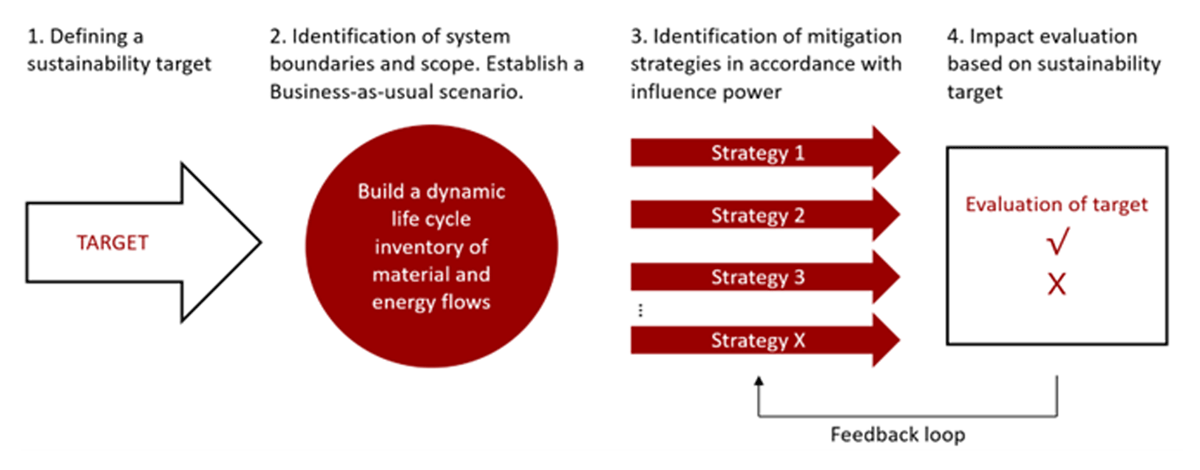
Figure 1
Methodological framework.
2.2 Case study, scope and system boundaries
The case study investigated in this work is a university campus of roughly 110 hectares. The campus investigated is the Technical University of Denmark’s (DTU) Lyngby campus, located in Lundtofte, north of Copenhagen, DK. This particular campus area serves as a proxy for a small city or neighbourhood. The existing building stock is relatively diverse in terms of a mix of end uses: residential and non-residential, construction types, construction year, etc. The case study is considered relevant for the purpose of illustrating the potential of the methods suggested in the work, as the area faces many of the same challenges as cities all over the world, namely how to handle a growing population and thus the additional demand for new building stock as well as the huge demand for renovation while mitigating impact in absolute terms. Furthermore, as illustrated by (Röck et al. 2021), most existing studies on the environmental impacts of building stocks focus solely on residential buildings, while only a few focus on building stocks with mixed end uses. As non-residential buildings often have markedly higher environmental impacts than residential buildings (Bahramian & Yetilmezsoy 2020), it is crucial that building stocks with other end uses are not overlooked. This study contributes to expanding the currently scarce knowledge on building stocks that are not dominated by residential buildings.
The geographical system boundary is defined by the campus area currently comprising buildings with total gross floor areas of 530,000 m2. The temporal scope spans 28 years, investigating environmental impacts during 2023–2050. The assessment considers material and energy flows associated with the built environment, including the construction of 157,000 new m2 based on DTUs development strategy to accommodate the increasing population of student and staff, projected to grow by 2% annually (DTU Campus Service 2018). Additionally, the study covers renovation and waste treatment of construction products and operational energy in both existing and new buildings. In this study ‘renovation’ is modelled as a theoretical addition and removal of construction products based on their expected life span (Haugbølle et al. 2021).
This study adopts the functional unit proposed by Ohms et al. (2024) in their Section 2.1, namely ‘operation and renovation of the building stock and construction of 157,000 additional m2 on the DTU Lyngby Campus from 2023 to 2050’. Additionally, the system boundaries outlined in Ohms et al. (2024) are respected, meaning that only the building stock within the campus limits is considered, thus excluding infrastructure and food consumption. Furthermore, technical building installations such as ventilation systems, sewers, and electrical wiring are not considered.
2.3 Building a dynamic model
The present study builds on an inventory of the DTU Lyngby Campus (Ohms et al. 2024). Ohms et al. (2024) conducted a bottom-up building stock mapping using the MFA methodology to form the basis of a dynamic inventory. The MFA methodology involves defining building archetypes and estimating material, electricity and heat intensity coefficients for each archetype. An overview of the archetypes can be found in the supplemental data online (file 1, section 1). The archetypes were defined based on four key attributes, namely the age cohort (i.e. year of construction), the end use of the building, the main structural material and window share of the façade. These four attributes allowed a functional but simple differentiation in the building stock, resulting in 11 representative building archetypes within the campus. A representative building for the archetype is selected and used as a basis for detailed analysis of the material, electricity and heat use for each archetype.
The BAU scenario forecasting future material and energy flows in Ohms et al. (2024) is adopted in this BAU scenario as well. This scenario represents a development in the case study area, where the demand for new building stock is met (i.e. the construction of 157,000 m2) but no additional measures are taken to reduce environmental impact. In the BAU scenario, the new buildings are modelled as Archetypes 10 and 11, which are the most contemporary buildings and thus assumed to be the best proxy for future buildings. To account for material waste during the construction of the buildings, an additional 10% of all materials are added (Danish Center for Energy Savings in Buildings 2020).
Renovations of both existing and new buildings are assumed to follow 40-year cycles, with a normal probability distribution function with 99% of the renovations occurring within a 35- to 45-year period. The 40-year cycle for a given building starts from the year of construction. Note that the possible effects of renovations that may reduce the operational energy use are not investigated in the present work. It is furthermore important to note that the demolition of buildings is not considered relevant for this particular case study, as most of the buildings on campus have architectural heritage value and demolitions are thus unlikely.
Electricity and heat consumption were assumed to remain constant during the considered time scope, but the electricity and heat grid mix was modelled to follow the official projections made by the Danish Energy Agency. The electricity consumed is based on measured data for the buildings in 2021 (Ohms et al. 2024). However, no distinction was made between electricity used for lighting and ventilation (which should be included in a building LCA) and electricity used for equipment such as computers. When comparing impact assessment results to an allocated share of the target, it is crucial that the system boundaries of the study are aligned with what has been allocated. Rasmussen and Johannsen (2016) estimate that, for Danish single-family housing, lighting and ventilation are responsible for 12% and 14%, respectively, of total electricity consumption. As there is a lack of more representative data (i.e. on electricity consumption for lighting and ventilation in Danish university buildings), these shares were applied to the measured electricity consumption presented in Ohms et al. (2024). Ventilation is only included for non-residential buildings built after 2000 (i.e. Archetypes 8–11).
To enable environmental impact assessment of the building stock during 2023–2050, the material and energy flows are coupled with Ecoinvent (version 3.7) life cycle inventory data (Wernet et al. 2016) using the cut-off system model and evaluated with the impact assessment method ReCiPe 2016 (Huijbregts et al. 2017). The effects of data and process uncertainties are assessed through a Monte Carlo analysis.
2.4 Mitigation strategies
To evaluate which mitigation strategy is the most effective in the context of the building stock under investigation, multiple mitigation strategies should be investigated. The most relevant mitigation strategies are chosen based on the hotspot analysis for the BAU scenario. Although the mitigation strategies presented in this paper do not present an exhaustive list of mitigation strategies, the selected strategies showcase how these can be defined and incorporated in the model as dynamic parameters enabling quantification of impacts of a strategy over time. The authors acknowledge that the mitigation strategies tested in this work are typically beyond the control of urban planners, but the method applied is still relevant to urban planners.
In their case study, Ohms et al. (2024) found that operational electricity and heat demand are an impact hotspot for a majority (16 out of 18) of the impact categories. Furthermore, their results revealed that the environmental impacts embodied in materials used in new buildings and for renovating the existing buildings represent an increasing share of the building stock’s total environmental impact. Mitigation strategies should thus target these hotspots to deliver the greatest potential reductions. In this work, four different mitigation strategies are investigated (Table 1). Apart from assessing the mitigation strategies separately, the four mitigation strategies were also combined to highlight the potential of taking multiple mitigation actions. The estimated reduction potentials are based on ARUP and UK Green Building Council (2021). This was found to be the best available estimate on future potentials for building stocks, although they do not represent the same geographical context as the case study. For the purpose of testing the impact reduction potential of the mitigation strategies, it was, however, deemed to be an acceptable proxy. A more elaborate description and reasoning of the mitigation strategies can be found in the supplemental data online (file 1, section 2).
Table 1
The business-as-usual scenario (BAU), the mitigation scenarios (MS) and the values applied for each parameter (P)
| P1: PRIMARY RAW MATERIALS REDUCTION | P2: USE OF BIO-BASED MATERIALS | P3: NEW FLOOR AREA REDUCTION | P4: OPERATIONAL ENERGY REDUCTION | DECARBONISATION OF ENERGY GRID MIX | |
|---|---|---|---|---|---|
| BAU (business-as-usual) | 0% | 0% | 0% | 0% | 2023–2035 |
| MS 1 – Reduce primary raw material use | 30% by 2050a | 0% | 0% | 0% | 2023–2035 |
| MS 2 – Use bio-based building materials | 0% | 100% bio- based archetype | 0% | 0% | 2023–2035 |
| MS 3 – Build less by increased utilization of existing buildings | 0% | 0% | 10% by 2040a | 0% | 2023–2035 |
| MS 4 – Reduce operational energy demand | 0% | 0% | 0% | 49% by 2040a | 2023–2035 |
| MS 1 + MS 2 + MS 3 + MS 4 | 30% by 2050a | 100% bio-based archetype | 10% by 2040a | 49% by 2040a | 2023–2035 |
| MS 1 + MS 2 + MS 3 + MS 4 + decarbonisationc | 30% by 2050a | 100% bio-based archetype | 10% by 2040a | 49% by 2040a | 2023–2050 |
[i] Note: aModelled as a gradual linear reduction.
bAll new buildings and renovations are built with bio-based archetype.
cIn this combination, the expected nationwide decarbonisation of the electricity and heat grids is assumed to continue past 2035, when the current projection from the Danish Energy Agency ends.
2.5 Implementation of a climate target
Reduction targets (at both national and regional levels) are often based on territorial emissions, and omit the contribution of Scope 3 emissions. The present study applies a consumption-based target (i.e. covering Scope 1–3 emissions) by allocating a share of the global allowable emissions. This study will evaluate the results both relating the resulting emissions to the IPCC pathways consistent with the 1.5°C target forming the basis of a dynamic emission boundary, as well as the planetary boundaries (PBs) translated into a constant annual emission boundary by Bjørn and Hauschild (2015) and later updated by Petersen et al. (2022). This constant annual emission boundary can be interpreted as an end goal for the regeneration back to the planetary boundary for climate change (Petersen et al. 2022).
Translating these global targets into more granular levels requires agreement on how to apportion the global budgets among countries and activities within those countries. To calculate the Share of Safe Operating Space (SoSOS) for an activity, sharing principles are applied. Sharing principles are normative and based on different ethical norms (Bjørn et al. 2020; Ryberg et al. 2020). To determine a national budget, four principles are applied: equal per capita (EPC), ability to pay (AP), historical debt (HD) and grandfathering (GF). The formulas as well as the data applied for each principle can be found in the supplemental data online (file 1, section 3). To assign EPC shares, population projections by the UN were applied (UN Department of Economic and Social Affairs 2019). Another approach is AP, where the national share depends on the country’s baseline emissions and GDP per capita. The equation applied for AP is based on van den Berg et al. (2017). The reduction for each country is based on its baseline emissions and the wealth of the country, measured in GDP per capita. A country with higher GDP per capita than the global average is required to reduce more than the global average and vice versa (Lucas et al. 2020). However, using this formula, a country with high baseline emissions will also receive a high initial budget (Horup et al. 2023).
The third approach, HD, holds countries accountable for previously emitted GHG emissions. HD acknowledges that GHG emissions emitted into the atmosphere in the past contribute to current climate change and therefore stipulates that countries with historically above-average per capita emissions should pay back in the future through compensating these with below-average per capita emissions (Neumayer 2000). Countries are held accountable for past emissions from 1990 to 2022, with a payback period of 50 years from 2023 to 2072. The term payback period refers to the assigned number of years the country must compensate by ‘paying back’ the accumulated above-average emissions through below-average emissions, here assuming an equal yearly distribution. The year 1990 was chosen because this was the year of the first assessment report by the IPCC, and it marks a point in time when policymakers could no longer justify disregarding their responsibility (Tilsted & Bjørn 2023). The payback period was chosen to be until 2072, as this is the year where the average IPCC pathway applied in this work becomes global net zero.
The GF approach stipulates that the national share follow the current distribution of emissions. GF is not an equity-based approach (Caney 2009) and the resulting GHG budgets should not be interpreted as fair shares but rather as baselines for comparison. To assign shares according to AP, HD and GF, this study applied historical data on GHG emissions, GDP and populations from Our World in Data (Ritchie & Roser 2023).
To allocate shares to activities within the countries, sharing principles often attempt to capture the relative value of the activities under investigation (Bjørn et al. 2020). In the present study, the share for the area under investigation was based on the areas’ activities (number of residents, workplaces, students and children in daycare), weighted by current average m2 uses for these activities in Denmark. Data applied to this calculation were retrieved from Danish Statistics (Statistics Denmark 2023). Details on this activity-based allocation principle can be found in the supplemental data online (file 1, section 2.2.1). Lastly, the share assigned to the built environment was applied based on the current share that buildings are emitting in Denmark, namely 27% of consumption-based emissions (Energistyrelsen 2022). The global climate budget and the allocated climate budget to the case study are presented in Table 2.
Table 2
The global GHG budget according to IPCC limiting warming to 1.5°C (with > 50% probability), with no or limited overshoot, planetary boundary (PB) and the SoSOS allocated to the case study
| 2023 | 2025 | 2030 | 2040 | 2050 | ||
|---|---|---|---|---|---|---|
| Global IPCC AR61 | Gt CO2e | 44 [43–45] | 41 [31–49] | 31 [21–38] | 18 [7–23] | 8.09 [3–15] |
| SoSOS IPCC, case study, EPC | kt CO2e | 11.4 [9.5–13.0] | 10.0 [7.5–11.9] | 7.2 [5.0–9.0] | 4.0 [1.55–5.1] | 2.3 [0.6–3.3] |
| SoSOS IPCC, case study, AP | kt CO2e | 20.4 [17.6–23.3] | 17.0 [13.2–20.3] | 8.3 [2.1–12.6] | –1.2 [–8.3–1.3] | –7.4 [–11.5–(–4.2)] |
| SoSOS IPCC, case study, HD | kt CO2e | 0.5 [–1.3–2.2] | –0.9 [–3.4–1.1] | –3.6 [–5.9–(–1.9)] | –6.9 [–9.3–(–5.7)] | –8.9 [–10.3–(–7.5] |
| SoSOS IPCC, case study, GF | kt CO2e | 20.9 [17.5–23.9] | 18.6 [13.9–22.1] | 13.7 [9.5–17.1] | 8.0 [3.1–10.3] | 4.2 [1.2–6.9] |
| SoSOS PB,2 case study, EPC | kt CO2e | 0.61 | 0.61 | 0.59 | 0.56 | 0.54 |
[i] Note: 1Projected median annual GHG emissions for the different allocation principles, with the 5th–95th percentile in brackets. All pathway scenarios are 1.5°C consistent (with > 50% probability), with no or limited overshoot (Byers et al. 2022).
2The planetary boundary annual GHG emissions were assumed to be 2.51 Gt CO2e/year (Petersen et al. 2022). The decrease in SoSOS during time is a result of a growing population (UN Department of Economic and Social Affairs 2019).
3. Results and discussion
The results showcase that combining MFA and LCA can assist in decision-making for urban development by integrating dynamic parameters into the LCI, and how strategies can be assessed in relation to global targets.
3.1 Annual GHG emissions: land use and hotspot analysis
In this section, annual GHG emissions and land use are assessed from 2023 to 2050. Impact results for all other impact categories at midpoint are available in the supplemental data online (file 2, Table S2). Figure 2 illustrates the annual GHG emissions and land use from 2023 to 2050 for the BAU scenario, as well as the combination of the four mitigation strategies.
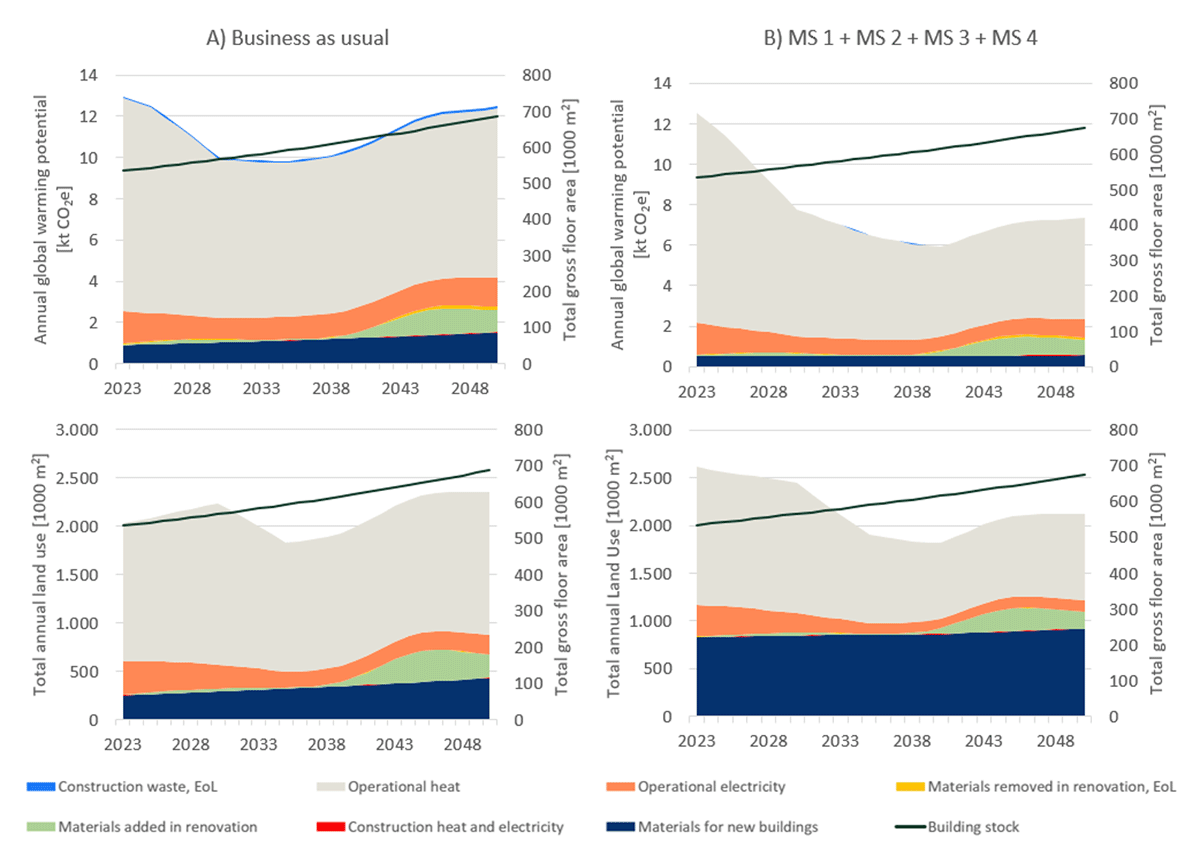
Figure 2
Annual GHG emissions for 2023–2050 for the BAU scenario (A) and the combination of all mitigation strategies (B). The contribution to the total impact is differentiated across life cycle stages.
Figure 2 shows the annual contribution from different activities, revealing that the four dominating contributors to both GWP and LU are materials for new buildings and added in renovation, operational electricity and heat. In the BAU scenario (Figure 2A), where no mitigations means for the case study area are taken, we see a substantial reduction in GHG emissions from 2023 to 2030 due to the decarbonisation in the energy grid. However, this is counteracted by the growing building stock, illustrated with a black line. In the scenario illustrated in Figure 2B, this counteraction is less pronounced but still present. In 2050, when combining all four mitigation strategies, the annual GHG emissions for the building stock are assessed to be 31% lower than the BAU scenario. The accumulated reduction in GHG emissions from 2023 to 2050 is 95,536 t CO2e (95% confidence interval, 95%CI: 82,280; 114,028). The greatest relative reduction (63%) occurs in the GHG emissions associated with producing construction products for new buildings. The reduction occurs mainly as a consequence of MS 1 (reducing primary raw materials) and MS 2 (using bio-based materials). In total, the accumulated GHG emissions from material production is reduced by 18,262 t CO2e (95%CI: 17,125; 19,702). The greatest absolute reduction is achieved in GHG emissions from operational heating, with annual emissions reduced by 39% in 2050 compared to the BAU scenario, and when accumulated from 2023 to 2050 the total reduction is 62,142 t CO2e. Acknowledging that relying on future energy efficiencies is not sufficient, and thus that significant reductions in consumption are necessary, is not a new finding (Calwell 2010). However, it is still relevant to address. Figure 2A and 2B show the contribution to land use for the BAU scenario and the combination of the mitigation strategies. The shift to bio-based materials (MS 2) increases the accumulated impact on land use from 2023 to 2050 by 260% for the ‘materials for new buildings’ category. While MS 1 and 3 have very little effect on LU, MS 4 reduces LU markedly; however, this is counteracted by MS 2.
It is important to acknowledge that the composition of the building stock (building age, use types etc.) under investigation and the characteristics of the heat and electricity sector in the country will strongly influence the results and thus which mitigation strategies will be evaluated as most effective. The building stock investigated in this study is located in Denmark and is dominated by non-residential buildings, the majority of which was built in the 1960s. Thus, the conclusions obtained in this study would likely be different e.g. a newer residential building. This underlines the importance of presenting methods to quantify and assess the environmental impacts of building stocks to enable decision makers to address the most effective strategies to the specific area.
3.2 Impact burden-shifting for mitigation strategies
Section 3.1 demonstrated that, for global warming potential, the mitigation strategies indeed deliver substantial impact reductions from 2023 to 2050. However, it is imperative that the mitigation strategies do not result in shifting the environmental burden from one impact category to another. Additionally, the mitigation strategies with limited reduction potential for impact on global warming may have the potential to reduce impacts for other impact categories. Therefore, the mitigation strategies are investigated for 18 impact categories at midpoint from 2023 to 2050. Figure 3 shows the annual impact for each impact category for a given mitigation strategy relative to the BAU scenario. Figure 3 shows that MS 1 reduces impacts across all categories, i.e. there is no burden-shifting between the impact categories with this mitigation strategy. MS 2 reduces the impact dramatically for human carcinogenic toxicity (48% every year from 2023 to 2050). However, the impact burden is shifted to land use, where the impact increases dramatically (30–46%). The new archetype replacing Archetypes 10 and 11 does not have any aluminium or steel structural parts, which are the main materials contributing to human carcinogenic toxicity. MS 3 has little effect on any of the impact categories, thus indicating that the modelled 10% decrease in demand for new buildings is too modest to deliver notable impact reductions. MS 4 delivers the greatest reduction across impact categories, with reductions in all impact categories.
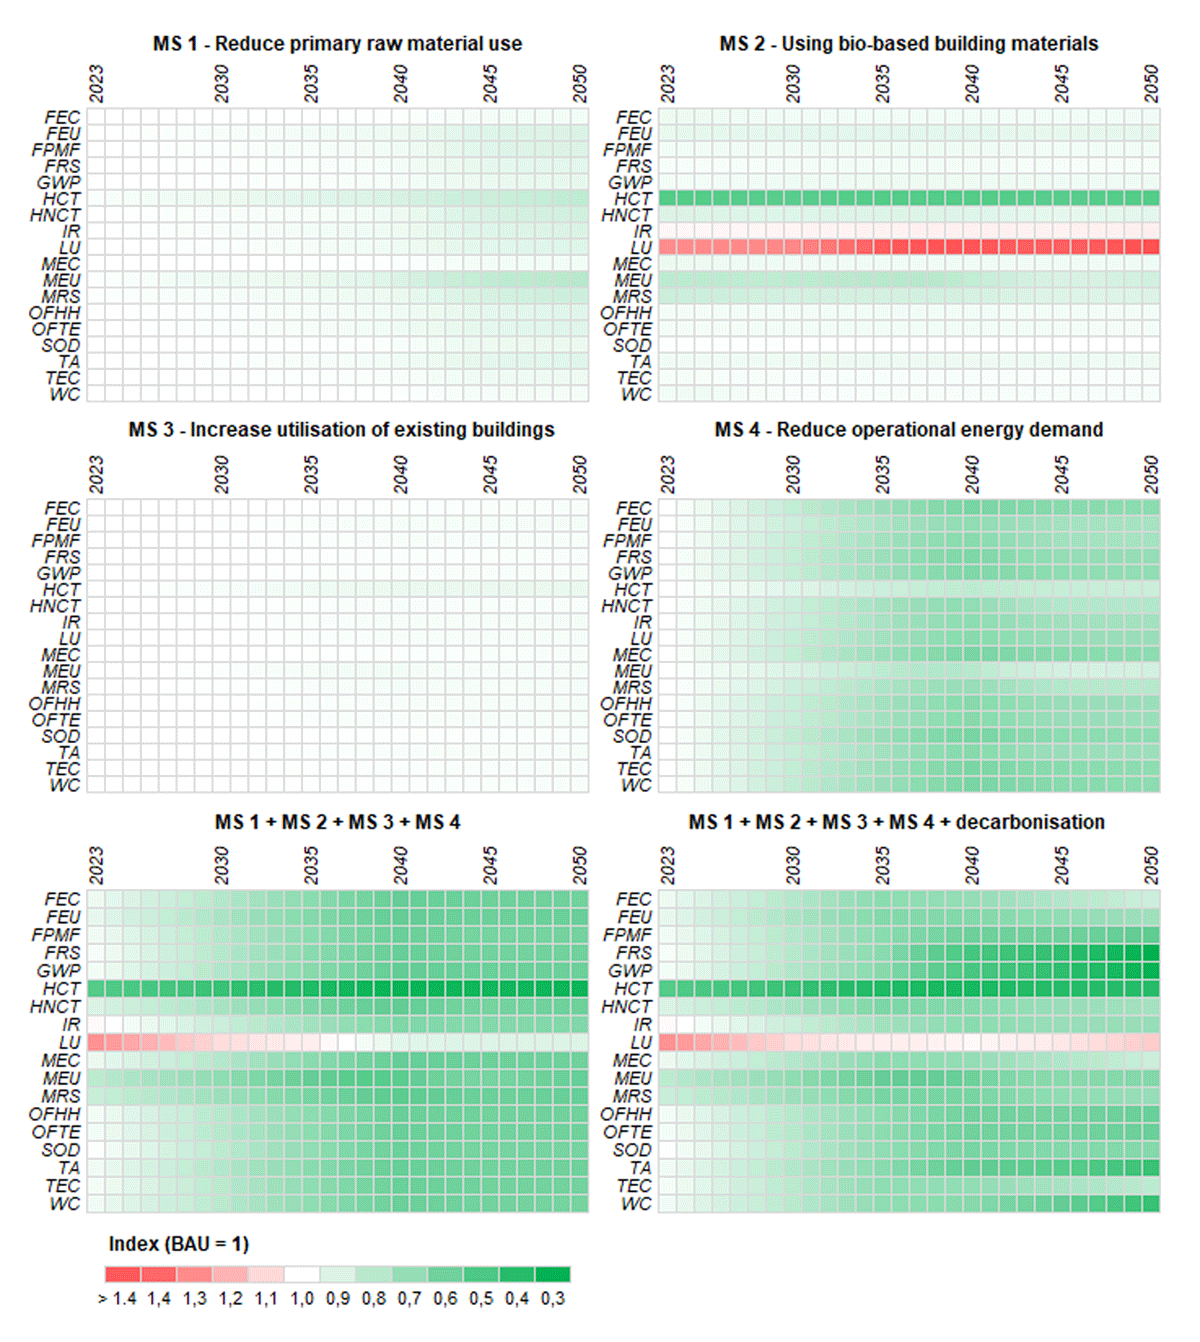
Figure 3
The annual impacts for each mitigation strategy (or a combination of several) are presented relative to the annual impact in the business-as-usual scenario, and a score less than 1 indicates that the result obtained is less than in the business-as-usual scenario.
Note: FEC = Freshwater ecotoxicity, FEU = Freshwater eutrophication, FPMF = Fine particulate matter formation, FRS = Fossil resource scarcity, GWP = Global warming potential, HCT = Human carcinogenic toxicity, HNCT = Human non-carcinogenic toxicity, IR = Ionizing radiation, LU = Land use, MEC = Marine ecotoxicity, MEU = Marine eutrophication, MRS = Mineral resource scarcity, OFHH = Ozone formation (human health), OFTE = Ozone formation (terrestrial), SOD = Stratospheric ozone depletion, TA = Terrestrial acidification, TEC = Terrestrial ecotoxicity, WC = Water consumption.
Combining all four mitigation strategies, the burden-shifting occurring between human carcinogenic toxicity and land use becomes less pronounced, as the total impact on land use is reduced due to MS 4. However, the impact on land use is still higher than in the BAU scenario until 2036. All other impact categories benefit from the combination of mitigation strategies, and the increase in impact due to the renovations after 2040 is largely counteracted by the combined benefits of MS 1, MS 2, MS 3 and MS 4. Including the expected decarbonisation of the electricity and heat supply after 2035 decreases the impact even further for fossil resource scarcity and global warming potential, where the impact is reduced by 72% and 70%, respectively. However, for several of the other impact categories, decarbonisation increases the impact after 2035, e.g. land use and freshwater, marine and terrestrial ecotoxicity.
The focus of the present research is on overarching strategies, so the actual initiatives within each strategy are not decided and thus not quantified. A limitation is that some potential burden-shifting is not considered. For example, a reduction in operational heating consumption (P4) will likely entail adding more insulation to the building envelope, and therefore create further emissions embodied in insulation materials. Another example involves improved utilization of the existing building stock (P3), which may entail changing the building floor plan through construction work. To ensure that any such burden-shifting does not challenge the potential benefits, the chosen actions within each strategy should be investigated before being implemented.
3.3 Relating accumulated emissions to global climate targets
To evaluate whether the impact on global warming is in compliance with the global targets set by the Paris Agreement, the annual impacts on global warming are compared to the annual GHG budgets presented in Table 2. Table 2 presents the annual results obtained with the four mitigation strategies as well as the GHG budgets. A strategy is only considered successful in being aligned with the global target if the annual emissions do not exceed the annual budget of any year. Figure 4 shows that, under the assumptions presented in Section 2, the combined efforts of all four mitigation strategies together with the expected decarbonisation of the electricity and heat mix after 2035 would align the annual emissions with the GHG budget using the GF principle. However, it would not align with EPC, AP or HD. No scenario manages to ever comply with the PB; the scenario that manages to reduce the most (illustrated with a blue line) stills overshoots the SoSOS of the PB seven times in 2050.
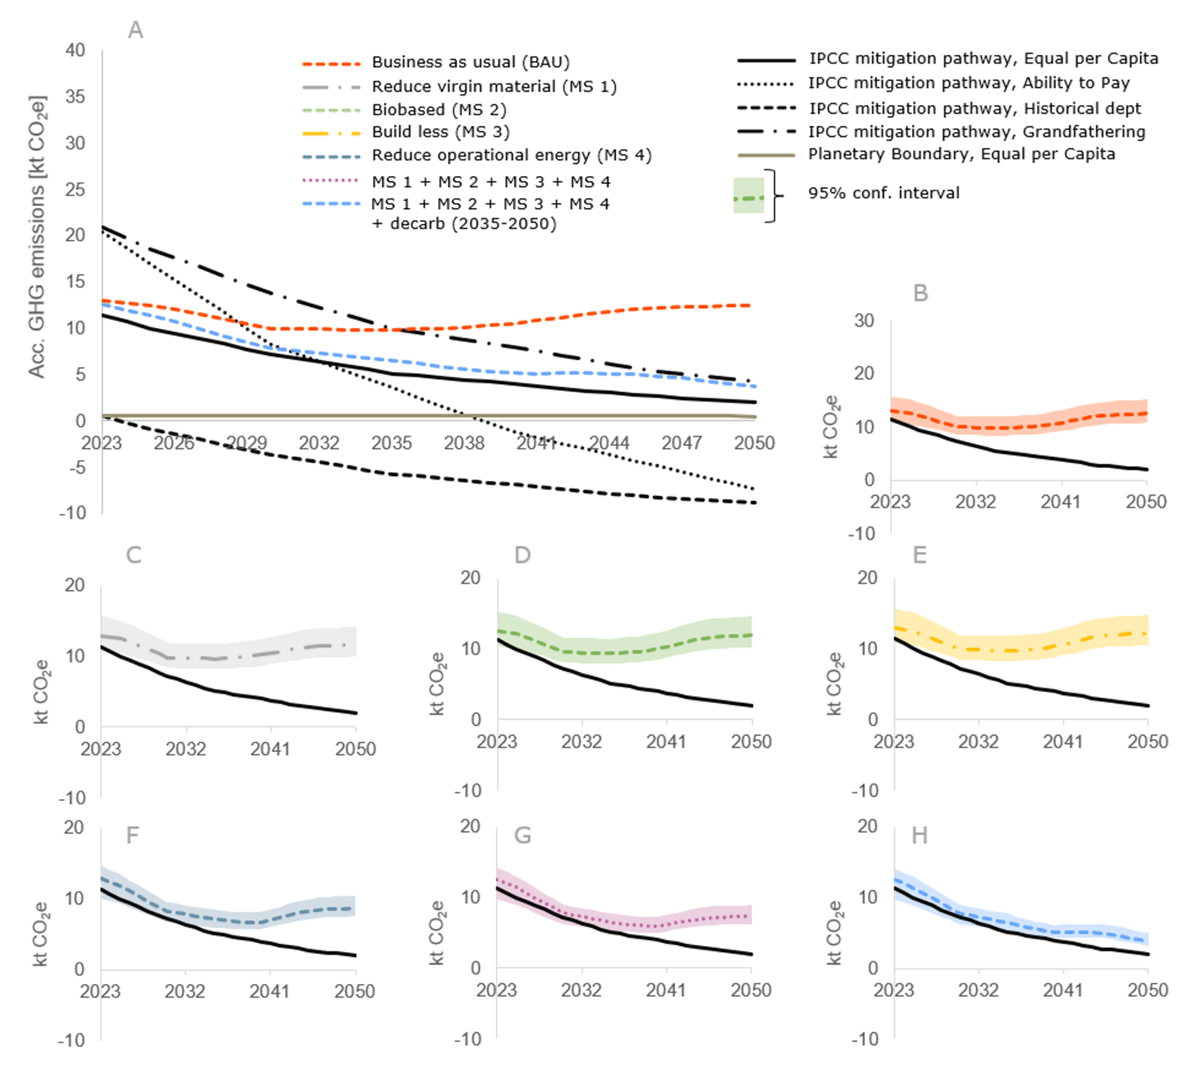
Figure 4
(A): Accumulated GHG emissions for 2023–2050 and targets. The black lines indicate the allocated share of the global reduction target using different allocation principles and the grey line indicates the allocated share of the planetary boundary; (B): business-as-usual scenario; (C–F): the four mitigation strategies; (G–H): a combination of all mitigation strategies both without (G) and with (H) decarbonisation of the electricity and heat mix after 2035.
The calculation of the share of the GHG budget (Section 2.4) is based on ethical approaches to how the global budget can be distributed. As such, these cannot be defined as subjectively true or correct, as there is yet no consensus on how to split the global budget among countries and sectors (Lucas et al. 2020). To test the sensitivity of choosing other sharing principles when assigning a share of the national target to an area and further down to the built environment, a total of 16 combinations were applied. Figure 4 illustrates the sensitivity of the allocation principles applied to assign a national share. To test the sensitivity of using activity to assign a share to an area, the study tested using a ‘grandfathering building stock’ approach, in which the building stock in the area relative to the total building stock in Denmark was applied. This resulted in a 40% reduction of the target values compared to using the activity in the area as a proxy for the value that the area brings to the nation. This indicates that the case study area already uses the buildings more efficiently than the average in Denmark. Furthermore, the authors tested the sensitivity of using grandfathering emissions of the built environment relative to total consumption-based emissions. This found that using a sufficiency principle based on decent living energy (DLE) would result in 30% reduced target values. Using both grandfathering building stock and DLE, instead of the principles behind the target values presented in Table 2, would result in 58% lower emission targets. This study tested 16 approaches; four are presented and the rest are used as a sensitivity analysis. All allocation principles and the resulting 16 target pathways can be found in the supplemental data online. The very high sensitivity underlines the importance of the allocation principles being transparently communicated, when applied as a design criterion. Other sharing principles are encouraged to be explored in future studies as well. Furthermore, the authors encourage implementation of absolute targets for other impact categories to avoid burden-shifting to other environmental problems.
3.4 Solution space complying with global climate target
Section 3.3 showed that, even if all mitigation strategies were combined, reductions sufficient to comply with the emission targets on GHG emissions were not achieved. While the estimates for the mitigation strategies are based on the best available knowledge on a realistic reduction potential, it is possible that further reductions could be achieved. Integrating parameters into the dynamic inventory allows a more target-oriented focus – asking questions such as ‘how much should we reduce the existing operational energy to achieve an EPC IPCC target?’, ‘how many m2 of floor area can be built and still remain within the GF IPCC target?’ and so on. Furthermore, the parameters can be combined, allowing the decision maker to assess the outcome of activating different mitigation levers. This could be carried out in an interactive tool allowing the user to investigate multiple parameters. To illustrate the potential, Figure 5 presents the accumulated impact on GWP relative to the BAU scenario when combining two mitigation levers, namely ‘reduction in operational energy use’ and ‘reduction in new floor area (m2)’. In this assessment, the parameters are not limited to the estimates provided in Table 1 and thus indicate what is required to reach emission targets, to incentivise ambitions and technology to go even further than the literature has until now considered possible. The reduction potentials presented in Figure 5 are purely theoretical, as the technology and methods to reduce operational energy use by 100% do not exist. Figure 5 shows that, with 80–100% reduction in the new build, the operational energy use needs to be reduced by 80% to align with the IPCC 1.5°C pathway calculated with an EPC approach. Figure 5 also highlights that, if there is no reduction in the growth of the building stock, then operational energy needs to reduce to nearly zero. This is not practically possible. Furthermore, reducing energy use over time becomes a less effective method of reducing GHG emissions, as the share of non-renewable energy sources in the heat and electricity mix is substituted by renewable sources. Accumulated results for combining the other mitigation strategies are available in the supplemental data online (file 2, Table S4).
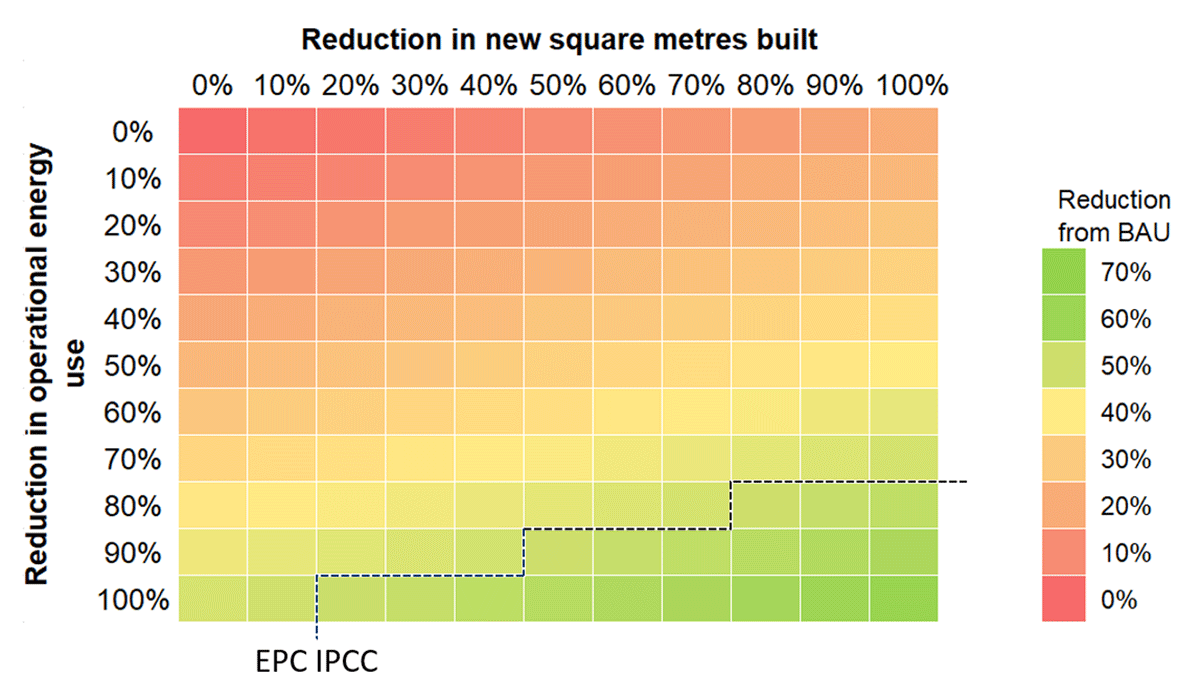
Figure 5
Solution space when combining two parameters.
Note: Green areas below the dashed lines indicate that the resulting emissions for the time period 2023–2050 complies with the target. In this illustration, a scenario is assumed to align if the accumulated impacts are below the accumulated target.
3.5 Limitations and further work
Using archetypes to conduct bottom-up mapping has the advantages of enabling a detailed mapping of a large building stock in terms of material and energy flows with a high temporal and geographical resolution. The method, however, also suffers from a substantial uncertainty due to the potential misrepresentation when using archetypes. This study has argued that the method used could potentially be used for entire cities. However, mapping existing and future building stocks in terms of materials and energy flows is a very time-consuming task, and thus the larger the area, the more uncertainty, as it would be necessary to make rougher assumptions. In practice, the level of detail should be chosen that fits with the decisions maker’s level of influence.
This work is based on the process-based life cycle inventory presented in Ohms et al. (2024). However, with a process-based approach, some of the environmental impacts occurring up- and downstream of the material supply are cut off from the analysis (Lenzen et al. 2000, Crawford et al. 2021). Crawford et al. (2021) find that, for construction materials such as concrete, metal and timber, the environmental impacts obtained using a process-based approach are substantially underestimated compared to a hybrid approach. Future studies should therefore investigate the effect of using a hybrid approach, as the overshoot of the boundaries observed in this work may be even more severe, and thus require even more drastic reduction efforts.
4. Conclusions
This research demonstrates that combining MFA and LCA can enable exploration of the long-term environmental consequences of strategic urban planning. Coupling MFA with LCA to create a parameterized and dynamic life cycle inventory allows decision makers to explore long-term effects of multiple scenarios and mitigation strategies. The quantification of environmental impacts provides decision makers such as local authorities, urban planners and portfolio owners with the ability to make informed decisions and promotes sustainable urban development. The analysis helps identify the most effective strategies and avoids suboptimisations.
Four mitigation strategies were investigated separately and combined in the context of a case study. The environmental impacts of the building stock on a university campus were quantified annually from 2023 to 2050. This illustrates how impacts were distributed among activities. The four mitigation strategies’ potentials to reduce impacts were evaluated against an absolute target that ensures alignment with a sustainable development within climate change.
The results (Section 3.1) show that combining all four mitigation strategies reduces the GHG emissions markedly from 2023 to 2050. The greatest relative reduction achieved in GHG emissions came from embodied impacts in construction products, but the greatest absolute reduction was achieved for emissions associated with the operational heating consumption. This is because the case study has a large mature building stock (with high operational energy use) from the starting point (2023), whereas a new area with more new (energy-efficient) buildings would mean a shift towards larger reductions from mitigation strategies addressing embodied impacts from the materials. The results (Section 3.2) emphasize the importance of considering multiple impact categories to prevent burden-shifting. For example, in MS 2, the use of bio-based materials reduced GHG emissions but led to significant increases in land use impacts.
Decision makers should prioritise a comprehensive assessment that considers possible burden-shifting to avoid unintended consequences. To ensure that urgent actions are incentivised – rather than sustainability as a ‘feel-good concept’ – decision makers are encouraged to set targets aligned with environmental boundaries. Going beyond what the literature currently considers realistic mitigation actions, the findings (Section 3.4) suggest what is necessary to achieve sufficient emission reductions. The results demonstrate that reducing emissions embodied in materials is on its own not sufficient to achieve the necessary reductions to align with the target, even if zero new materials are used. This indicates that, in urban areas with a considerable amount of existing building stock, addressing operational energy use is essential to be able to align with the 1.5°C target outlined by the Paris Agreement. However, the results also show that both the emissions embodied in materials and operational energy use must be reduced to comply with the IPCC equal per capita target.
These findings stress the need to address the rate of construction (i.e. the addition to the existing building stock). It is not enough to reconsider material use or transition to a circular economy. It is necessary to challenge the consistent increase in demand for new buildings in order to decouple growth from emissions.
Competing interests
The authors have no competing interests to declare.
Data availability
Data will be made available upon reasonable request.
Ethical consent
Ethics approval was not required.
Funding information
This work was supported by the Danish Innovation Fund, Realdania and Rambøll Fonden.
Supplemental data
Supplemental data (2 files) for this article can be accessed at: https://doi.org/10.5334/bc.413.s1. File 1 contains further information related to method and data. File 2 contains Tables S1–S4. Table S1: Allocating a share of the global allowable emissions to a building stock; Table S2: Results at midpoint differentiated across life cycle stages for the BAU scenario and MS1 + MS2 + MS3 + MS4; Table S3: Results at midpoint for the four mitigation strategies and the two combinations; Table S4: Accumulated impact (in 2050) on global warming potential with combination of two mitigation strategies.