
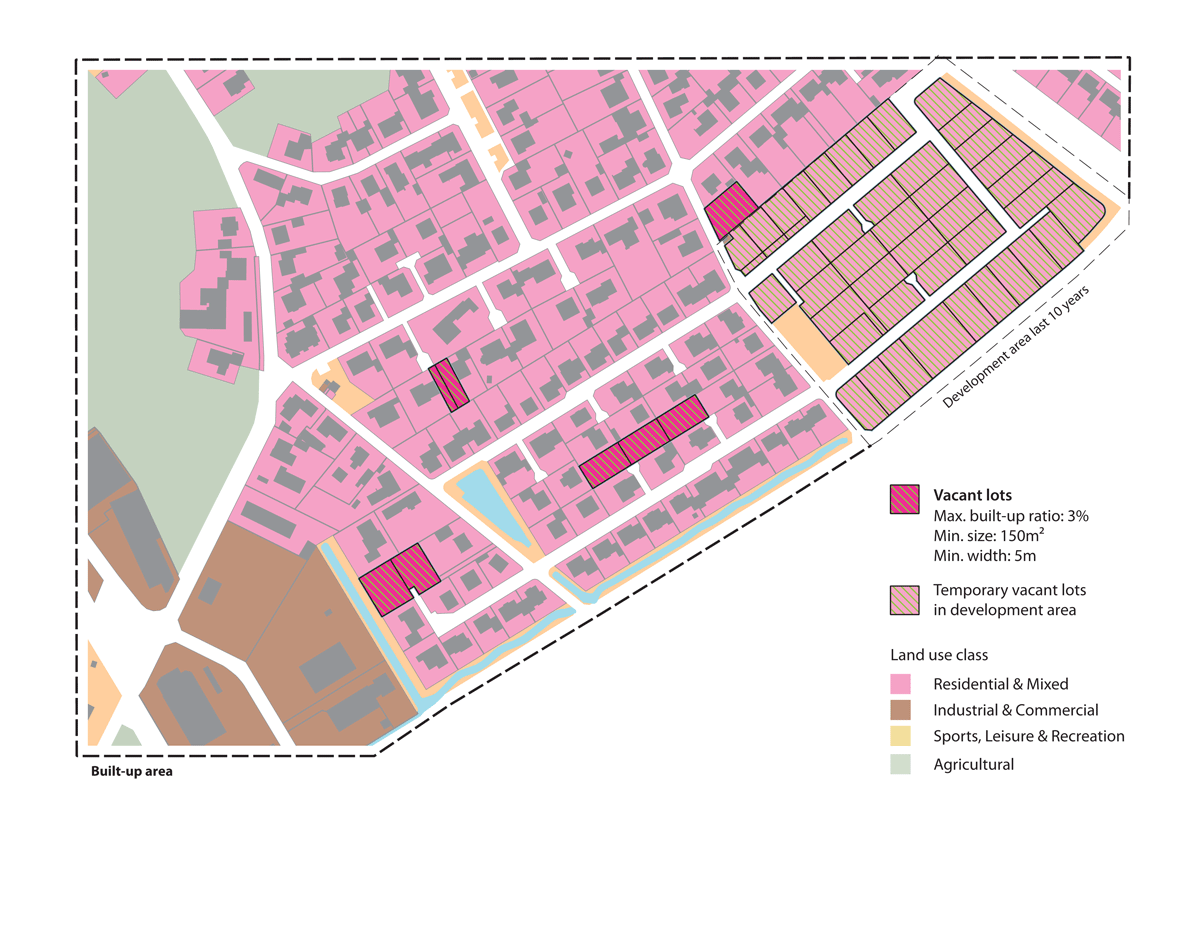
Figure 1
Schematic representation of vacant lot definition.
Source: Authors.
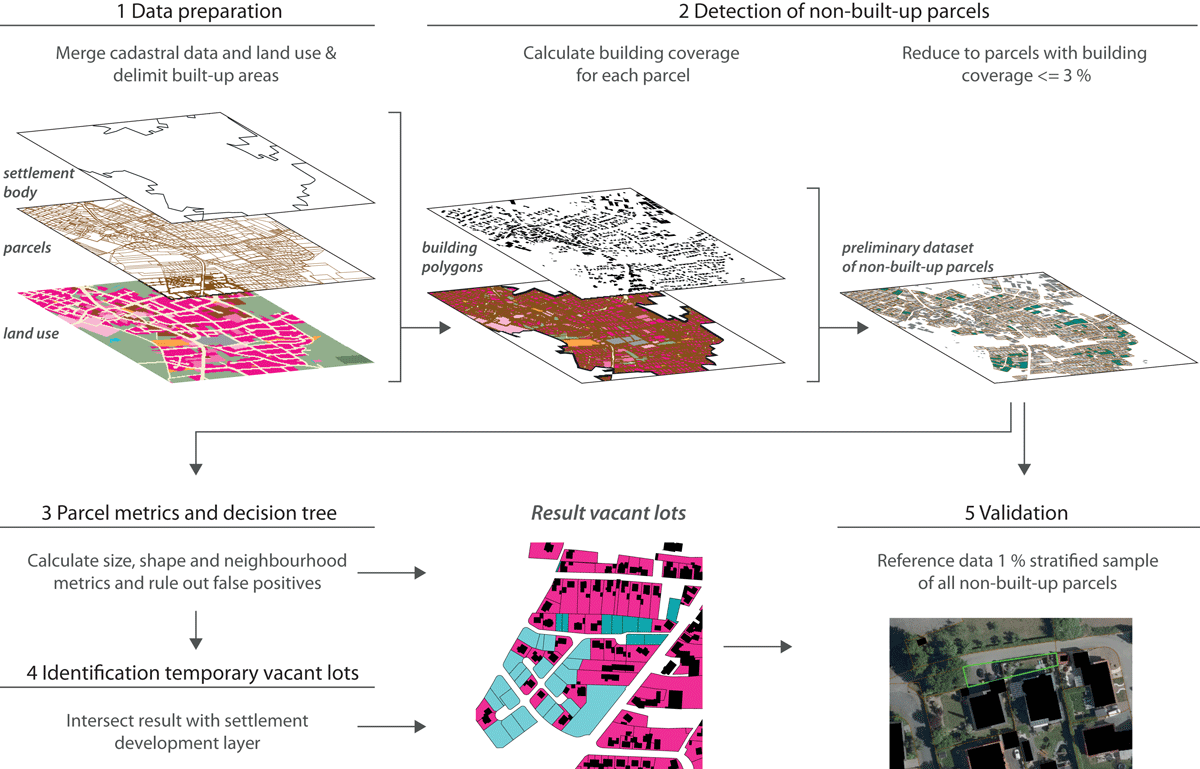
Figure 2
Workflow diagram with the processing steps of the automatic detection of vacant lots.
Source: Authors.
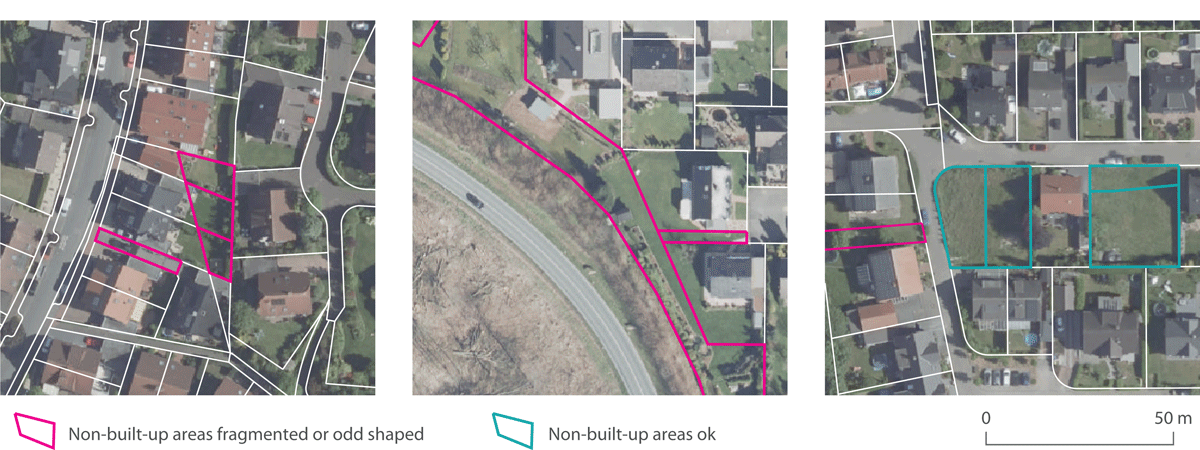
Figure 3
Examples of the preliminary dataset of non-built-up parcels.
Source: Authors.
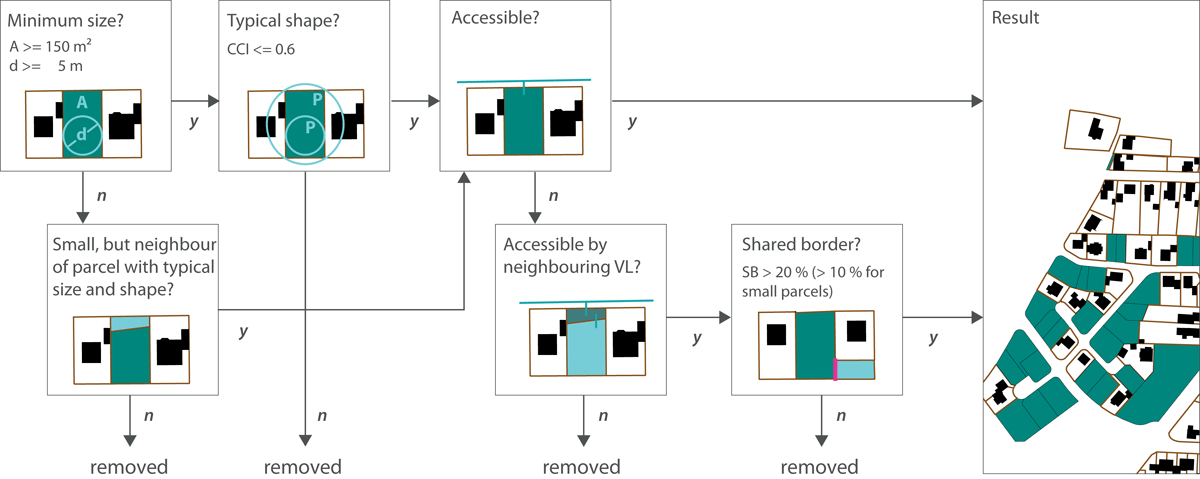
Figure 4
Hierarchical decision tree with size, shape and neighbourhood metrics.
Source: Authors.
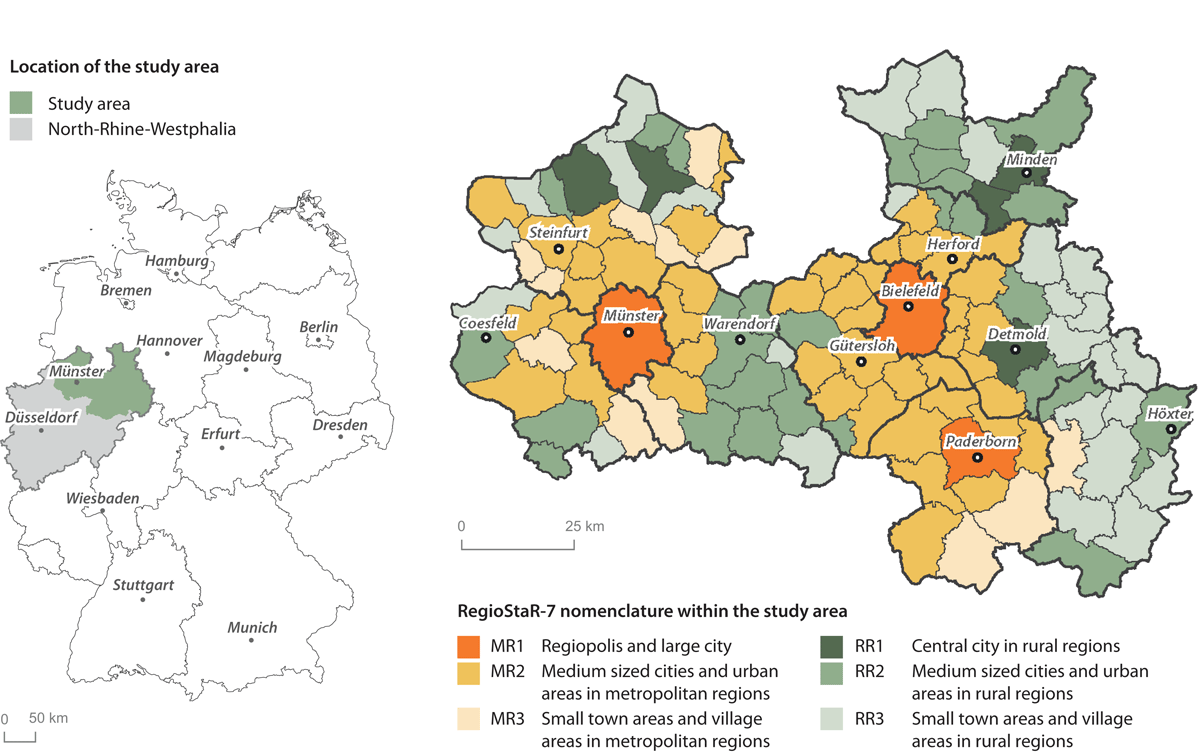
Figure 5
Location of the study area in Germany and North Rhine-Westphalia (NRW) and RegioStaR-7 nomenclature within the study area.
Source: Authors using geodata VG25 © Geobasis-DE/BKG 2019.
Table 1
Summary of the input data
| DATASET | YEAR | SOURCE |
|---|---|---|
| German Authoritative Real Estate Cadastre Information System (ALKIS®) | 2021 | www.opengeodata.nrw.de |
| Building polygons (HU-DE) | 2011, 2021 | © Geobasis-DE/BKG |
| Digital basic landscape model (ATKIS Basic DLM®) | 2001, 2011, 2021 | © Geobasis-DE/BKG |
| Administrative boundaries | 2019 | © Geobasis-DE/BKG |
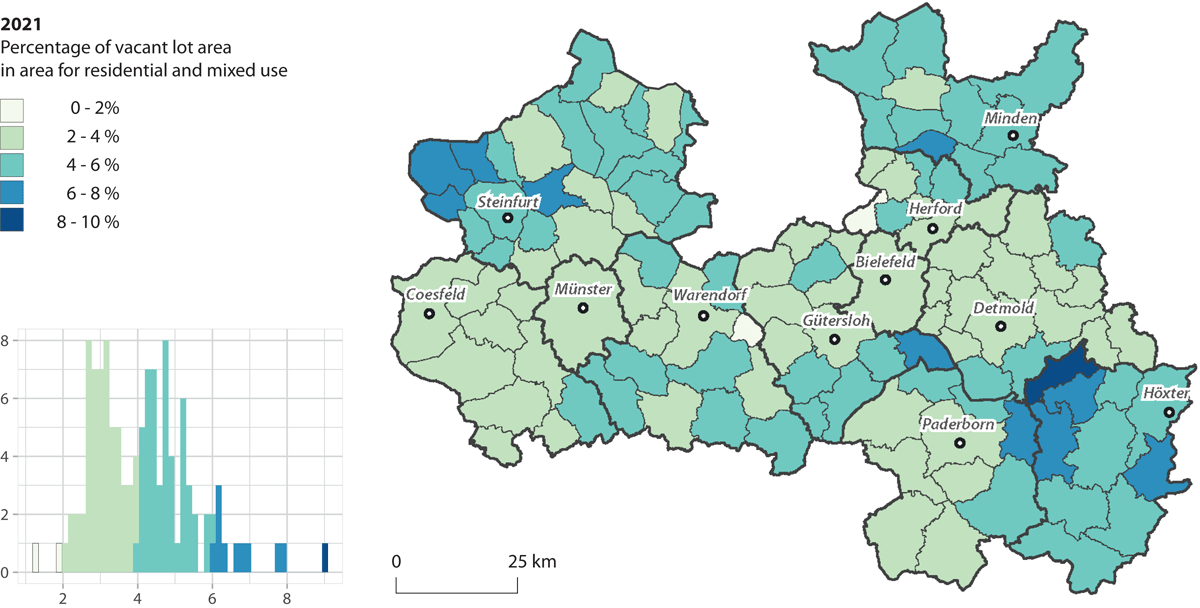
Figure 6
Spatial distribution of vacant lot area in 2021.
Source: Authors using geodata VG25 © Geobasis-DE/BKG 2019.
Table 2
Statistics of vacant lot size and width, 2021
| MINIMUM | MAXIMUM | MEDIAN | MEAN | Q25 | Q75 | |
|---|---|---|---|---|---|---|
| Area (m²) | ||||||
| Vacant lots (< 2,000 m²) | 10 | 1,998 | 437 | 480 | 206 | 672 |
| Non-built-up reserves (≥ 2,000 m²) | 2,001 | 24,234 | 2,682 | 3,285 | 2,259 | 3,496 |
| Diameter of maximum inscribable circle (m) | ||||||
| Vacant lots (< 2,000 m²) | 0.1 | 42.3 | 15.8 | 15.1 | 9.1 | 20.7 |
| Non-built-up reserves (≥ 2,000 m²) | 9.8 | 136.8 | 40.0 | 42.2 | 34.0 | 47.5 |
Table 3
Number of neighbouring vacant lots (only vacant lots ≥ 150 m²)
| NUMBER OF NEIGHBOURS | ||||||||
|---|---|---|---|---|---|---|---|---|
| 0 | 1 | 2 | 3 | 4 | 5 | 6–10 | > 10 | |
| Direct neighbours | 22,399 (60.60%) | 9,952 (26.92%) | 3,390 (9.17%) | 916 (2.48%) | 235 (0.64%) | 64 (0.17%) | 8 (0.02%) | 0 (0%) |
| Vacant lots within a 100 m buffer | 6,852 (18.54%) | 7,611 (20.59%) | 6,386 (17.28%) | 4,766 (12.89%) | 3,508 (9.49%) | 2,356 (6.37%) | 4,327 (11.71%) | 1,158 (3.13%) |
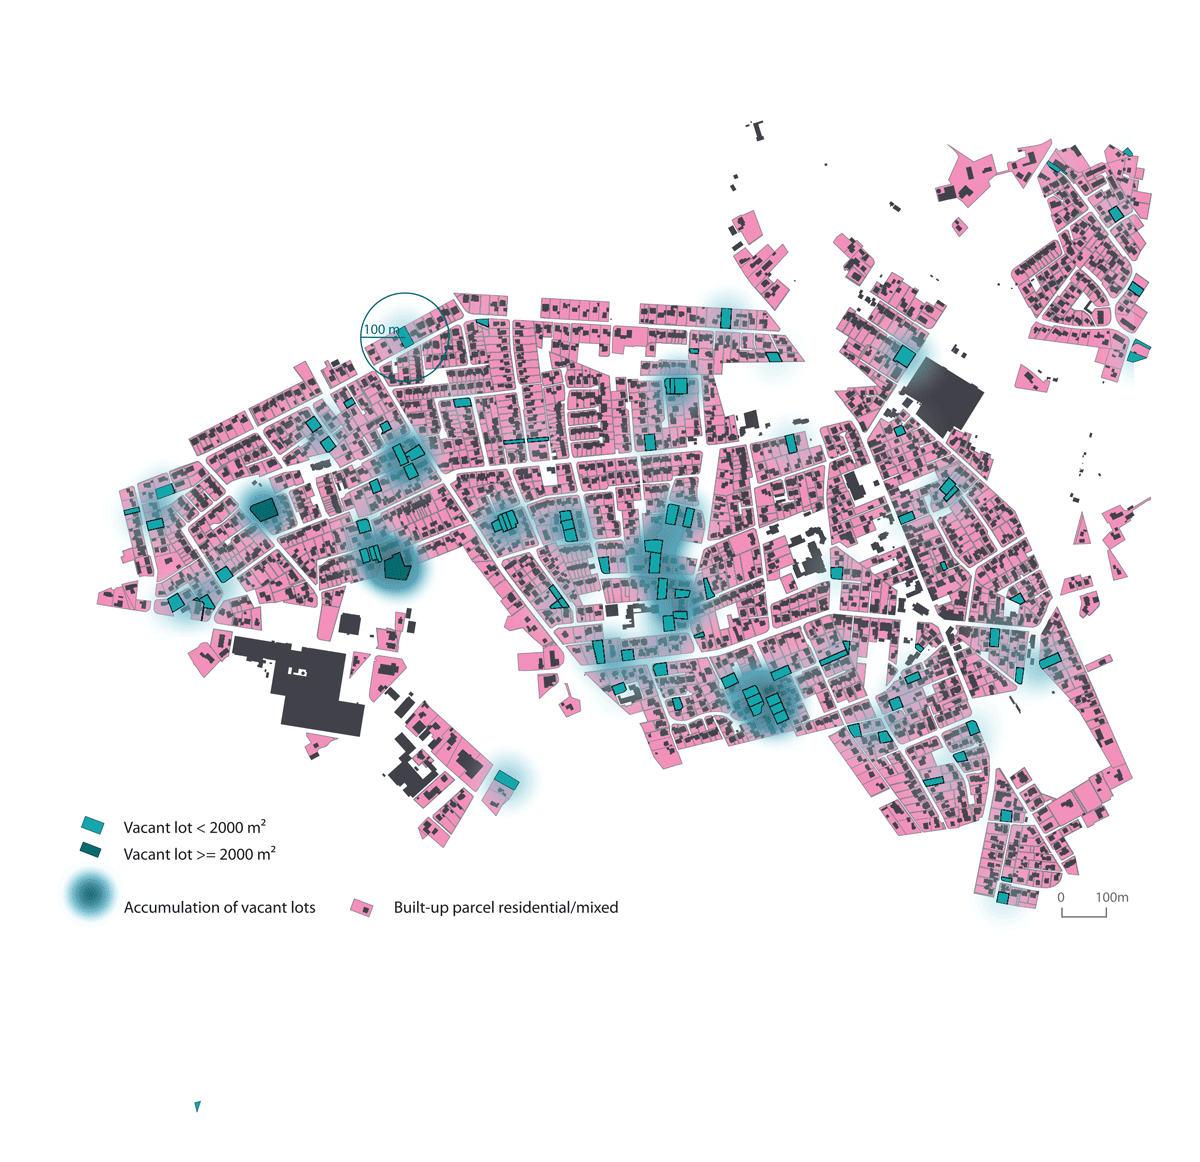
Figure 7
Small-scale spatial distribution of vacant lots with identification of agglomerations.
Source: Authors.
Table 4
Statistics on vacant lots in 2011 and 2021; and change, 2011–21
| VL | 2011 | 2021 | REDUCTION IN VL | NEW VL | Δ2011–21 |
|---|---|---|---|---|---|
| Area (ha) | 2,611 | 2,403 | –621 | 413 | –208 |
| % base 2011 | –23.78% | 15.82% | –7.96 percentage points |
[i] Note: VL = vacant lots.
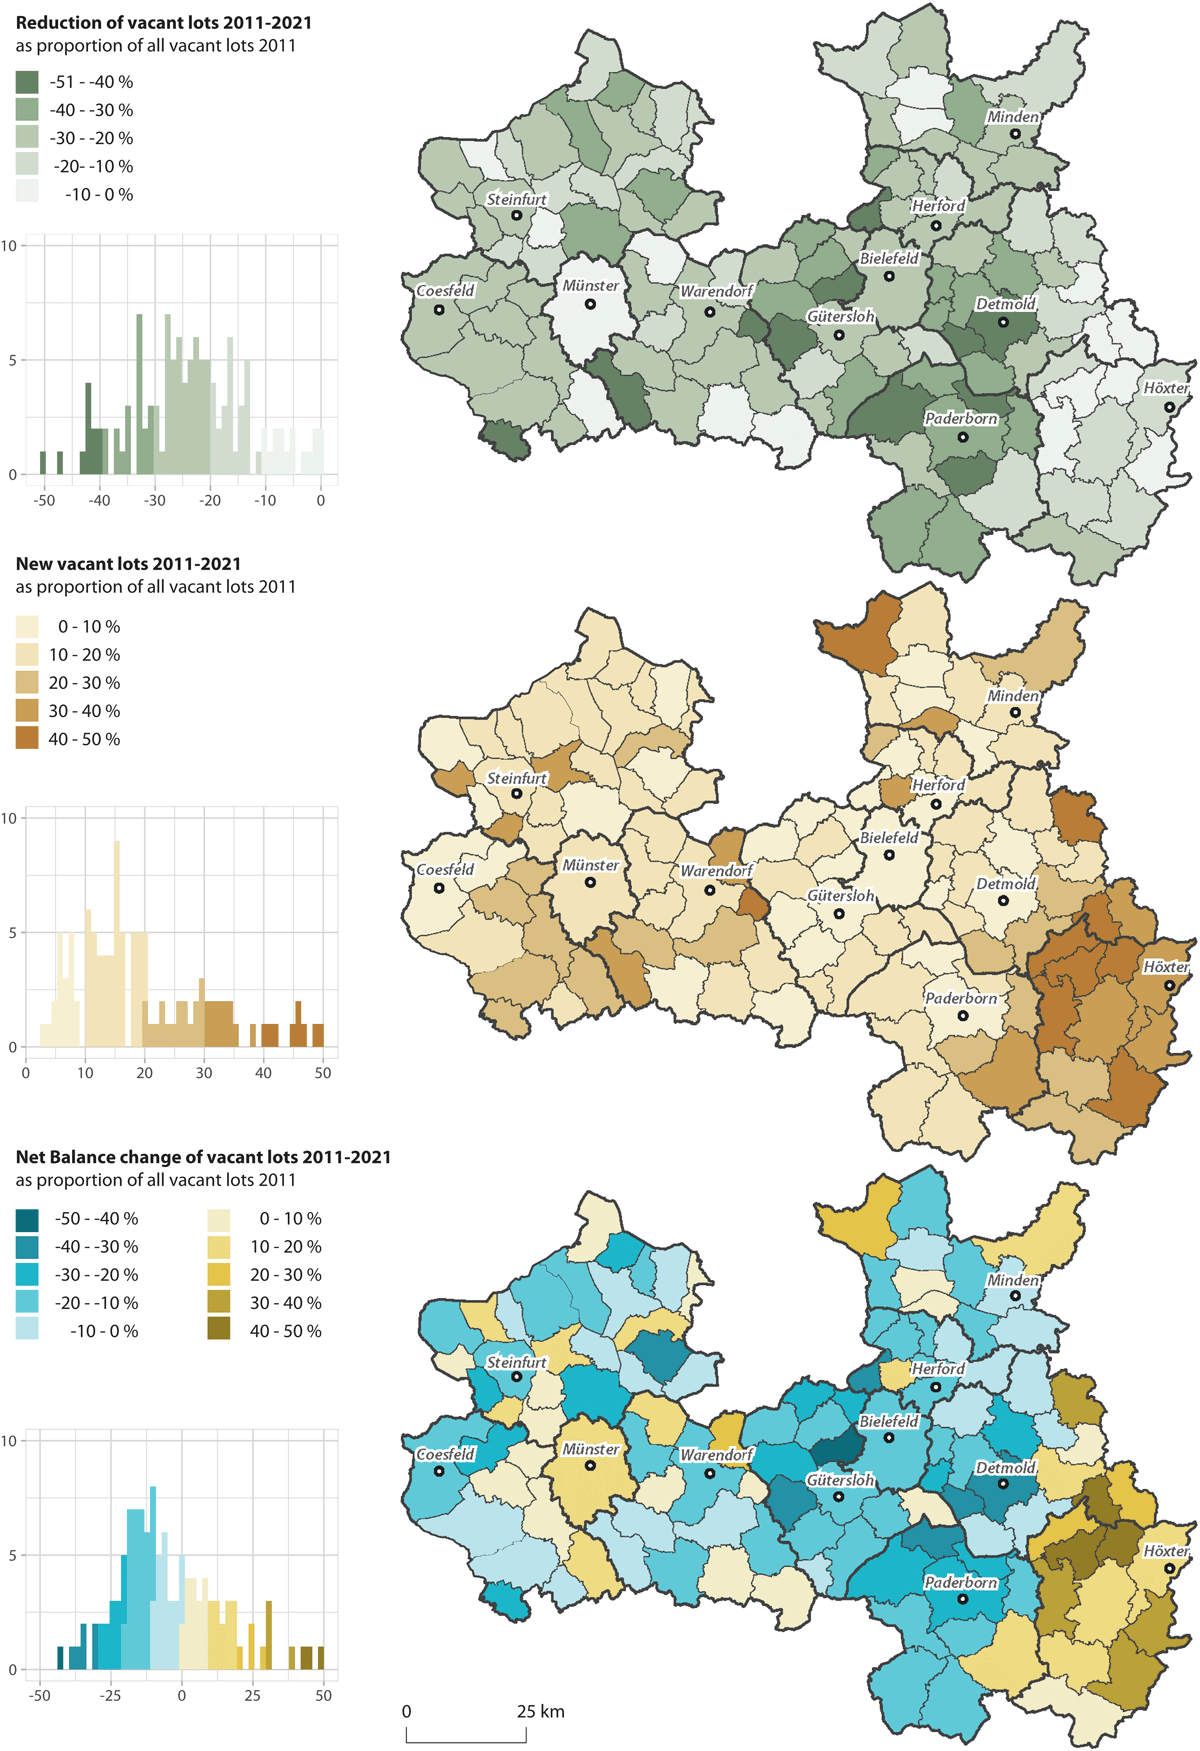
Figure 8
Spatial distribution of the change in vacant lot area (reduction, new vacant lots, net balance).
Source: Authors using geodata VG25 © Geobasis-DE/BKG 2019.
Table 5
Statistics on vacant lots in 2021; and change, 2011–21, by RegioStaR-7
| ID | REGIOSTAR-7 NOMENCLATURE | N | SHARE OF VL, 2021 | CHANGE IN VL AREA, 2011–21 (%) | ||
|---|---|---|---|---|---|---|
| REDUCTION IN VL | NEW VL | NET BALANCE | ||||
| MR1 | Regiopolis and large city | 3 | 2.99% | –20.17% | 9.49% | –10.69% |
| MR2 | Medium-sized cities and urban areas in metropolitan regions | 46 | 3.82% | –27.71% | 13.17% | –14.54% |
| MR3 | Small town areas and village areas in metropolitan regions | 12 | 4.46% | –20.70% | 27.22% | 6.52% |
| RR1 | Central city in rural regions | 5 | 3.99% | –26.26% | 12.32% | –13.93% |
| RR2 | Medium-sized cities and urban areas in rural regions | 27 | 4.18% | –21.55% | 17.84% | –3.71% |
| RR3 | Small town areas and village areas in rural regions | 26 | 4.40% | –18.57% | 26.17% | 7.60% |
[i] Note: VL = vacant lots.
For the spatial distribution of RegioStaR types, see Figure 5. Colours are according to the map.
Table 6
Reduction of parcels within the data-processing workflow
| DATA PROCESSING | N | AREA (HA) | SHARE ARM (%) | M² PER INHABITANTa | MEAN LOT SIZE (M²) |
|---|---|---|---|---|---|
| 1. Data preparation | |||||
| Parcels residential/mixed use in built-up areas | 914,461 | 61,852 | 100.00% | 186.48 | 676 |
| 2. Detection of non-built-up parcels | |||||
| Preliminary dataset of non-built-up parcels | 138,511 | 3,956 | 6.40% | 11.93 | 286 |
| 3. Parcel metrics and decision tree | |||||
| Reduction by size and shape | 67,991 | 3,368 | 5.44% | 10.15 | 495 |
| Reduction by neighbours and accessibility | 58,092 | 3,016 | 4.88% | 9.09 | 519 |
| Reduction by shared border and final data vacant lots | 53,629 | 2,924 | 4.73% | 8.82 | 545 |
| 4. Identification of temporary vacant lots | |||||
| Temporary vacant lots in development areas | 7,680 | 521 | 0.84% | 1.57 | 678 |
| Final data permanent vacant lots | 45,949 | 2,404 | 3.89% | 7.25 | 523 |
[i] Note: aNumber of inhabitants on 31 December 2020.
ARM = area residential and mixed use.
Table 7
Validation of classified data
| TP RATE (%) | FN RATE (%) | TN RATE (%) | FP RATE (%) | ACCURACY (%) | ERROR RATE (%) |
|---|---|---|---|---|---|
| 99.65% | 0.35% | 83.95% | 16.05% | 95.49% | 4.51% |
[i] Note: TP = true positive; FN = false negative; TN = true negative; FP = false positive.
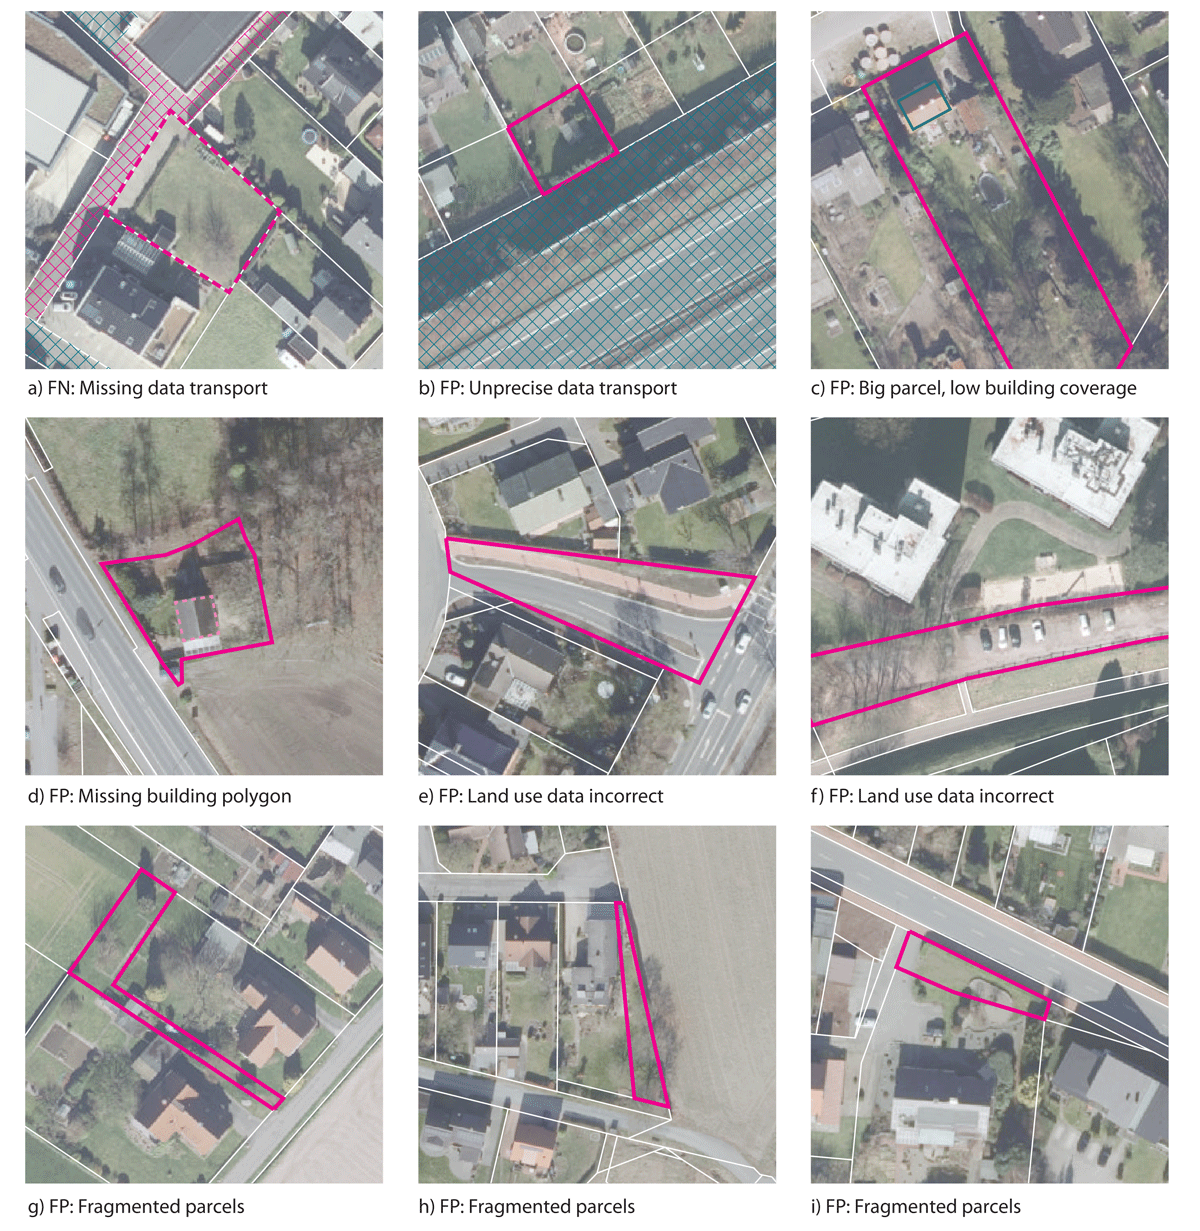
Figure 9
Examples of identified errors.
Note: FN = false negative; FP = false positive.
Source: Authors.