
1 Introduction
In 2011, the European Commission stated the target of reducing land consumption to no net land take by 2050 (European Commission 2011). National strategies for sustainable development adopted the target, following different timeframes for implementation (Teller 2021; Schatz et al. 2021). Germany, for example, set the aim to limit its land take to less than 30 ha/day by 2030 (Die Bundesregierung 2018). To achieve these targets, infill development is a widely applied strategy in land policies (Jehling et al. 2018). The use of brownfields, vacant or underused lots within already built-up areas (Schiller et al. 2021) should help to reduce the need for urban expansion due to new housing demands. In practice, infill strategies focused mainly on the redevelopment of brownfields and larger non-built-up areas, where large-scale urban development was possible. Today, as urbanisation processes continue and the demand for new housing stays high, many cities are facing a shortage of developable land, accompanied by high land prices (Ehrhardt et al. 2022; Siedentop 2018). Additionally, questions of negative social and ecological effects of densification emerge (Götze & Jehling 2022). The mobilisation of the remaining infill development potentials (IDPs) is complex, due to soil contamination, individual owner interests or speculation (Adrian et al. 2018).
To realise the full potential of remaining vacant land, small IDPs have to play a more vital role in planning decisions (Dunning et al. 2020; Schiller et al. 2018). To date, residential infill development on vacant lots mainly happens unattended by authorities or strategic planning (Dunning et al. 2020; Touati-Morel 2015). Still, they appear as a substantial factor for urban development within existing settlement structures. In England, development on small sites by individual owners accounted for 28.5% of all new dwellings in urban areas between 2001 and 2011 (Bibby et al. 2020). In Germany, a recent study reports the high proportion of small lots regarding IDPs: more than 60% can be found on vacant lots, while fewer than 40% are located on brownfields (Blum et al. 2022). In small towns and rural municipalities the share is 70%.
A principal obstacle to release the infill potential is a lack of information on amount, spatial distribution, market availability and mobilisation processes of IDPs. While some studies from the US can draw on existing inventories of tax assessor records linked to cadastral data (Kremer et al. 2013; Landis et al. 2006; Smith et al. 2017), in European countries such a database is often unavailable. In 2014, only nine European countries had comparable data on IDPs at the national level (Van Long et al. 2014). To overcome these data problems, surveys in Germany are applied to derive nationwide data on vacant land and IDPs (Blum et al. 2022). Although the results are important for policymaking, surveys are expensive and can only be used for monitoring long-term intervals. Additionally, they are not spatially explicit, making further analysis within urban contexts and locations infeasible. On the local level the number of IDP cadastres is increasing, but keeping the data up to date is time-consuming and costly. For this reason, smaller municipalities often still do not have knowledge about their IDP (Blum et al. 2022; Grams & Nebel 2013). To support the establishment of IDP cadastres, in Germany several tools were developed that facilitate the collection and visual representation of IDPs in information systems relevant for planning (e.g. Frey & Lehle 2014; Hensold 2016). Even though the increasing activities at the local level are important for the mobilisation of IDPs, most of the systems are not accessible and not comparable for a nationwide assessment due to differing definitions and levels of detail. The same applies for semi-automatic approaches, where local actors verify IDPs manually after a rough geographical information system (GIS)-based pre-processing (Elend et al. 2013; Elgendy et al. 2011; ETH Zürich 2022; Nebel et al. 2017). Besides, small IDPs with less than 2000 m² are often not included in these surveys because they are not considered regionally important (Elgendy et al. 2011; ILS 2015; Iwer 2021).
To overcome the limitations of these approaches, methods for the automatic detection of IDPs are needed to help monitor at the national level as well as deliver basic knowledge on the local level at little expense (Schiller et al. 2021; Xu & Ehlers 2022). Although some attempts for automatic detection of brownfields based on remote sensing were made (Atturo et al. 2006; Ferrara 2008; Manzke et al. 2016; Xu & Ehlers 2022) and the use of artificial intelligence is promising (Dürrbeck & Lippl-Seifert 2022), until now no approaches have included small-scale IDP. Hecht & Meinel (2014) proposed a GIS-based approach using topographical and building data, but concluded that the results greatly overestimate the infill potential due to missing lot boundaries and only coarse differentiation of land use. As an outlook, the authors tested the use of cadastral data with much better results. At the time, it was not conceivable that cadastral data would soon become publicly accessible; the approach remained at an immature level. The situation has changed. Today open data strategies (e.g. Directive (EU) 2019/1024; European Union 2019) increasingly promote the availability of cadastral data, so the full potential of a cadastral-based approach could be developed.
The aims of the study are:
to develop and test an automated approach for identifying and monitoring small IDPs
to use this approach as a basis for an evidence-based discussion of soft densification processes and the relevance of vacant lots for future residential infill development.
The interest here is on the small-scale incremental processes of infill development, so the study’s focus is on vacant lots only, although different types of IDP are relevant for land-saving-sustainable urban development. The focus on vacant lots helps to reduce complexity and allows for a rather simple workflow that can be applied at several scales, potentially up to nationwide monitoring. The research is organised along three main questions:
Which patterns of spatial distribution of vacant lots can be observed at the regional and local levels?
Which patterns become visible in terms of change of vacant lots within 10 years?
What are the implications of vacant lot characteristics and development regarding the relevance of vacant lots for future infill development?
A study area in Germany is used to examine these questions.
2 Method
Automatic classification processes can be separated into knowledge-based and data-driven approaches (Hecht et al. 2015). For automatically identifying vacant lots, a knowledge-based approach is used, which is typically based on expert knowledge, deploying a set of rules to classify the object of investigation (e.g. Hartmann et al. 2016). Based on the definition of vacant lots, parcel and neighbourhood characteristics are derived to delimit them from other IDPs and a hierarchical decision tree is developed to decide whether a parcel can be considered a vacant lot.
2.1 Terms and definitions
Infill development can be basically defined as the use or reuse of public and private land or buildings within established settlement areas, instead of new land taken from greenfield sites (Reiß-Schmidt 2018). Most studies on IDPs differentiate between brownfield sites, vacant lots, underused or wrongly used lots (Elgendy et al. 2011; Schiller et al. 2013, 2021). Brownfields and lots with buildings that do not exploit the maximum floor space regarding the existing planning right can be considered as built-up reserves. In contrast, non-built-up reserves contain vacant lots and larger vacant areas within the settlement boundaries (Nebel et al. 2017). The focus of the present article is on non-built-up reserves, and especially on vacant lots as small IDPs.
As many uses within urban areas do not necessarily contain buildings (e.g. cemeteries, playgrounds, agricultural use), not all non-built-up land can be considered an IDP. Even if urban development sometimes takes place on these areas, a planning decision from the local planning authority is needed (e.g. the conversion of a sports field to a residential area). Thus, the regulated land use is an additional important information to decide if a parcel can be considered a vacant lot. In this study, only parcels with residential or mixed use are taken into account.
Furthermore, a temporal aspect concerning vacant lots has to be considered. Vacancy as a condition always represents an intermediate phase between the implementation of building law and its realisation through building activity. In Germany, this temporal dimension must not be neglected since individual building activity can extend over long periods of time (Hartmann & Spit 2015). Time-limited building obligations, which would accelerate the process, are rarely applied. After designation of the building zones, a large number of vacant lots are created—at least temporary until new buildings are realised. Some lots stay vacant for several years or even decades due to specific owner interests or lack of demand (Hartmann & Spit 2015). In consequence, they become new persistent vacant lots within the urban fabric. To take this into account, this paper considers vacant lots on development sites of the last 10 years as temporary.
Finally, for a proper delineation of vacant lots, thresholds regarding built-up ratio, minimum parcel size and width are needed. Based on the literature and a systematic review of the data used in this study, a maximum built-up ratio of 3%, a minimum width of 5 m and a minimum area of 150 m² are derived as thresholds (see the supplemental data online for details). Figure 1 summarises all the criteria applied for identifying vacant lots.
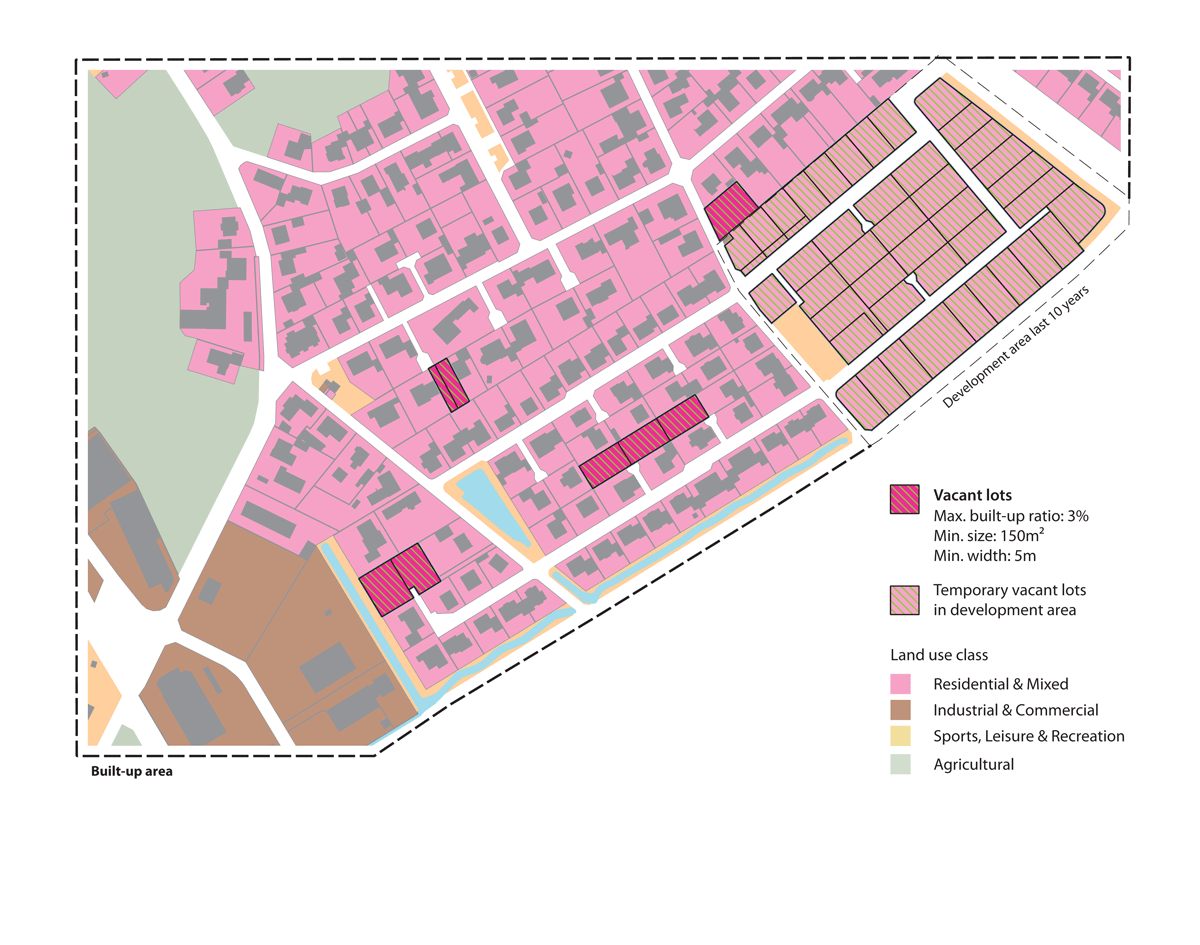
Figure 1
Schematic representation of vacant lot definition.
Source: Authors.
2.2 Approach for the automatic detection of vacant lots
The workflow to automatically identify vacant lots consists of five successive processing steps (Figure 2). The first step is to delimit built-up areas and reduce the dataset to land-use type residential and mixed use. Second, a preliminary dataset of non-built-up parcels is generated. As many of the identified parcels do not match the definition of vacant lots, in a third step the preliminary data are revised to eliminate too small, odd shaped or non-accessible parcels. To distinguish persistent from temporary vacant lots, the final dataset of vacant lots is then combined with information on new development areas. Finally, the accuracy of the results is evaluated by comparison with a reference dataset. Key inputs are cadastral data, land-use information and building polygons (footprints). All processing steps are implemented in QGIS 3.16.2 ‘Hannover’ using several consecutive models created with the built-in graphic modeller.
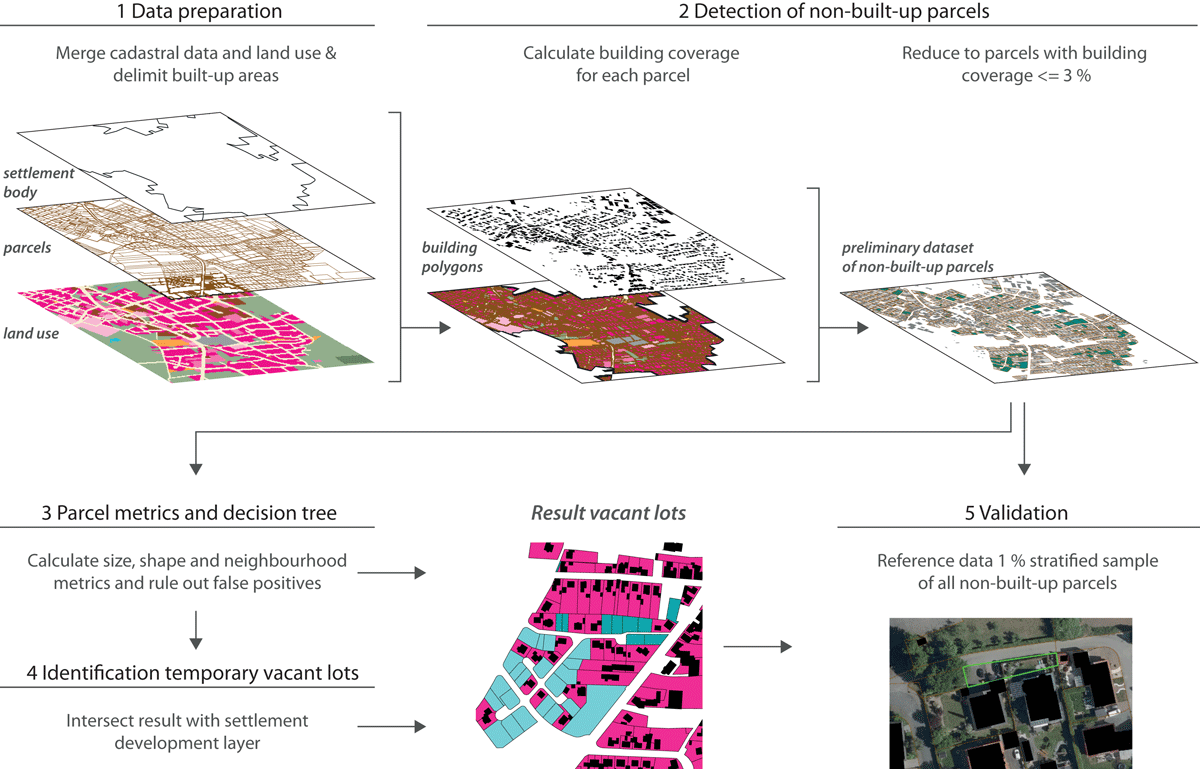
Figure 2
Workflow diagram with the processing steps of the automatic detection of vacant lots.
Source: Authors.
2.2.1 Data preparation
To obtain a basic dataset for the workflow in this paper, land-use information is first added to the cadastral data. As the land-use information is not directly linked to the parcel data and one parcel can contain several land use classes (e.g. residential in the front and agricultural use in the back of a parcel), the two layers are merged and this results in a new set of parcels with unambiguous land-use classes. Therefore, parcels containing two or more classes are split up. For further processing, only parcels with the land-use residential/mixed are considered. Second, the remaining parcels are delimited to built-up areas, using a layer for the settlement body (‘Ortslage’) from the German Digital Landscape Model (see the supplemental data online for details). Both layers are intersected and parcels with less than 50% of their floor area inside of the settlement body are excluded.
2.2.2 Detection of non-built-up parcels
Using building polygons, the built-up ratio is determined for each parcel. As building polygons smaller than 40 m² are not considered permanent structures that hinder infill (Schiller et al. 2021), they are not included. Parcels with less than 3% building coverage are considered vacant. The resulting dataset is only preliminary, as many parcels are identified that do not meet the criteria for vacant lots formulated in section 2.1. Especially in older, organically grown settlement areas, properties often consist of several parcels due to modifications by several owners over time (Figure 3). Other odd-shaped parcels can result from data issues.
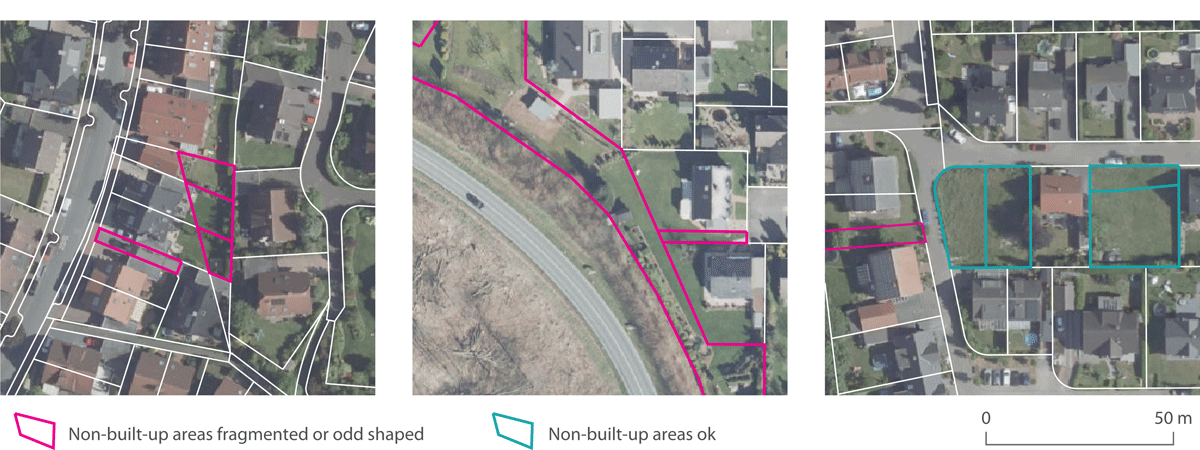
Figure 3
Examples of the preliminary dataset of non-built-up parcels.
Source: Authors.
2.2.3 Hierarchical decision tree based on parcel and neighbourhood metrics
The preliminary dataset is refined using size, shape and neighbourhood metrics of the parcels. A predefined hierarchical decision tree is applied to eliminate parcels that are not compliant to the vacant lot definition (Figure 4). Very small parcels with less than 10 m² are considered data errors and are therefore excluded before processing.
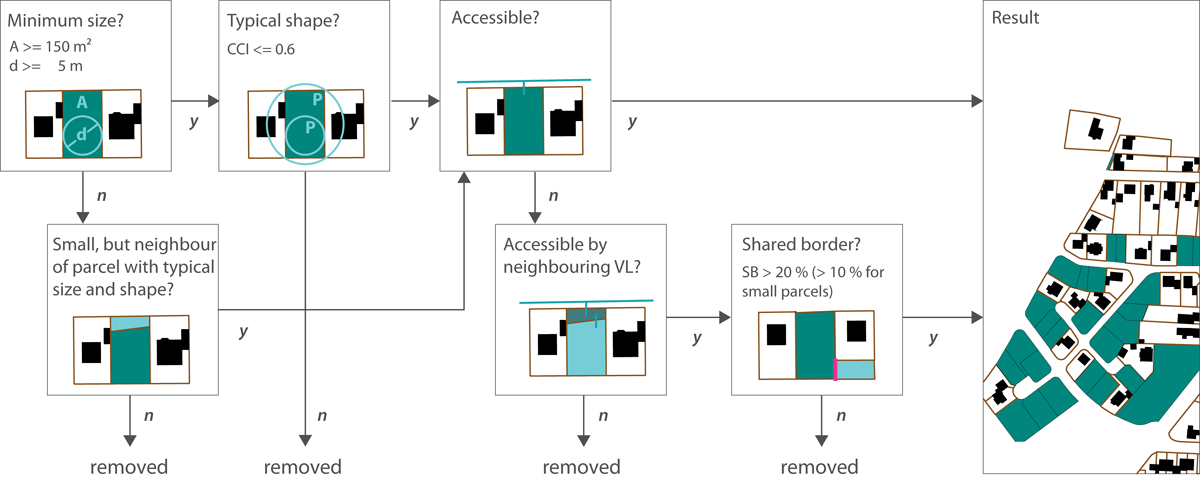
Figure 4
Hierarchical decision tree with size, shape and neighbourhood metrics.
Source: Authors.
First, the size and shape metrics for every parcel are calculated to decide if a building can theoretically be realised regarding size and width. The width for each parcel is approximated by calculating the biggest inscribable circle within the polygon, using the tool pole of inaccessibility in QGIS. If the diameter of the circle is 5 m or more and the floor area is at least 150 m², the parcel is kept. For parcels smaller 150 m² or 5 m width, a check is performed to ascertain whether the parcel is neighbouring a vacant lot that meets the criteria. By doing so, these parcels can be kept as they are most likely part of a larger property. If the parcel is not neighbouring any other vacant parcel or only small ones, it is excluded from the next steps. Figure 3 shows some issues remain with big, but narrow or odd-shaped, parcels that are big and wide enough for a building, but are still very unlikely to be used as infill. To eliminate these parcels, a land metrics approach is applied to describe the shape of the polygons. To measure the form of a polygon, compactness metrics are more suitable than complexity measures such as the frequently used Shape Index (Lang & Blaschke 2007). Hence, the Corrected Circularity Index 2 (CCI) by Borg & Fichtelmann (1998) is used. This relates the perimeter of the biggest inscribable circle (PI) with the perimeter of the smallest circumscribing circle (PO) and a circle with the same area as the polygon (PK) (Kappler 2015).
The result of the CCI is in between 0 and 1, whereas bigger values mean less compact forms. A threshold of 0.6 was derived by visual analysis of typical and atypical parcel shape. All parcels that reach the minimum size, but have a CCI > 0.6, are removed from the dataset.
Next, a vacant lot has to be accessible to be developed. Using cadastral data with land-use transport, the lots accessibility is checked. The three land-use classes (streets, paths and squares) are merged and a buffer of 5 m is placed around them. Parcels that are intersecting the transport layer are considered accessible. The same applies for parcels not intersecting the transport layer directly, but another vacant lot that was found accessible in the step before. Without the check of secondary accessibility, this would rule out some larger vacant parcels, especially in the older fabric where more fragmented lots are found. On the other hand, by doing so, some new false-positives may be generated that are touching accessible, larger lots which are not very likely to be part of the bigger property. This issue is addressed by calculating the length of all shared borders of a parcel in relation to the total length of its perimeter (SB). If the SB of a parcel that is only secondary accessible is less than or equal to 20%, then it is excluded. Also excluded are small parcels (A < 150 m² or PI < 2.5 m) with shared borders less than or equal to 10% of its perimeter.
2.2.4 Identification of temporary vacant lots
Data from the German Digital Landscape Model (building blocks with residential/mixed use) are used to generate a layer that approximates urban expansion, as well as bigger infill developments where land-use change towards residential use took place (Jehling et al. 2018). For t0, the layer contains all new residential/mixed-use areas since t–10. By intersecting the resulting layer with the centroids of the vacant lot dataset, temporary vacant lots can be identified.
2.2.5 Validation
To evaluate the accuracy of the resulting vacant lot dataset, a comparison is made with reference data. Therefore, a 1% random sample is drawn of all non-built-up parcels identified in the study area. Based on aerial imagery, the sample is evaluated by hand. An assessment of accuracy is performed by matching each parcel of the sample to the result of the automatic detection process. A true positive/false-negative rate, a true negative/false-positive rate as well as the overall accuracy/error rate are then derived (Hecht 2014). To calculate the rates, the floor area is used instead of the number. By doing so, the small false-positive parcels have less impact on the overall result than large ones.
2.3 Analysing structure and change of vacant lots
Once the automatic detection process is completed, the derived dataset is analysed for the amount, characteristics and spatial distribution of vacant lots. Taking into account not only the status quo but also temporal dynamics, statistics are derived for 2021 and 2011, and the change analysed. As open accessible time series of cadastral data in Germany are just being established, limited data exist for 2011. Hence, the cadastral data for 2021 are used and delimited to the built-up area of 2011. These are combined with building polygons of 2011 to identify the non-built-up areas for this year, and the consecutive steps of the workflow explained above are applied. As temporary vacant lots in 2011 (development areas 2001–11) may count as persistent vacant lots in 2021 if they are still vacant, measurement is needed not only of decline but also for newly emerging vacant lots.
To characterise the identified vacant lots, the size and width of the parcels are analysed using the measures from the processing steps. Furthermore, the neighbourhood characteristics set the frame for the future possibilities of development on a vacant lot. Whether a parcel is isolated or part of an agglomeration of vacant lots is measured by the number of direct neighbours as well as by the number of neighbours in a 100 m buffer. Vacant lots smaller than 150 m² are excluded from this evaluation step because they are considered to be part of a larger vacant lot.
To analyse the city-regional distribution of vacant lots, the data on municipal level are aggregated. To discuss the findings at a more general level, the German spatial-statistic RegioStaR-7 nomenclature (BMVI 2018) is used. This is a hierarchical typology of municipalities mainly following a monocentric city-region approach based on functional considerations (Jehling et al. 2021). Figure 5 shows the distribution of the RegioStaR-7 types for the study area.
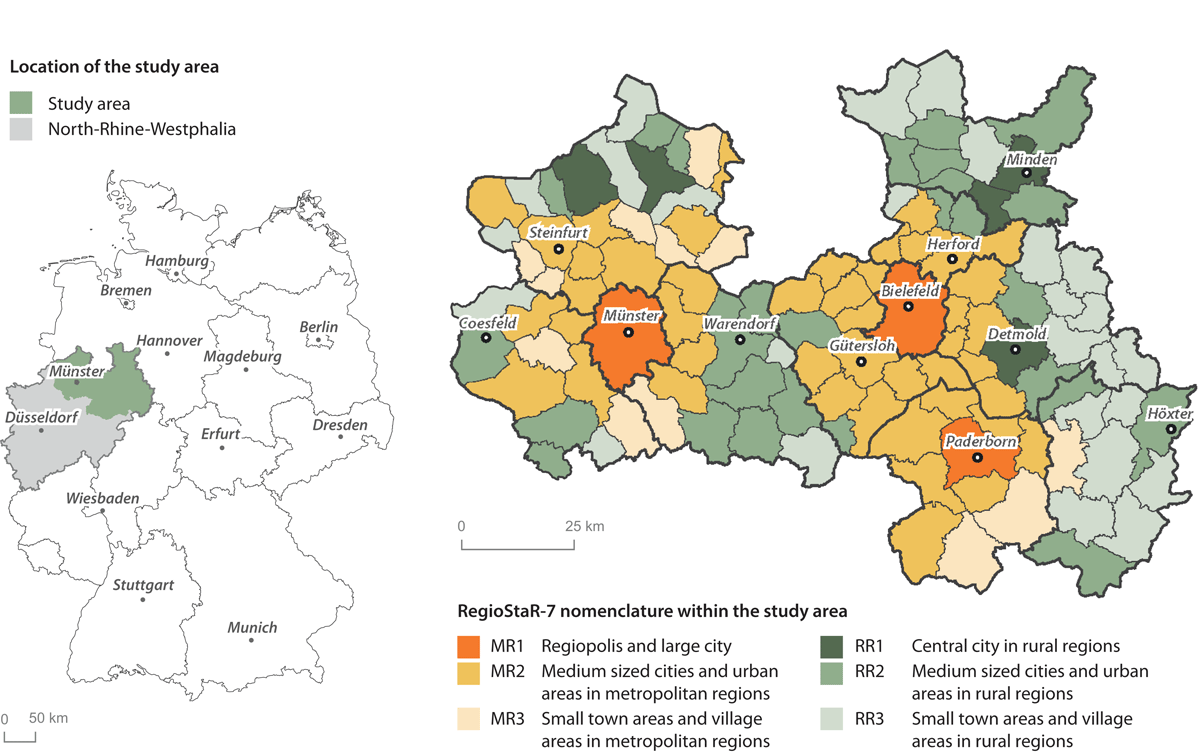
Figure 5
Location of the study area in Germany and North Rhine-Westphalia (NRW) and RegioStaR-7 nomenclature within the study area.
Source: Authors using geodata VG25 © Geobasis-DE/BKG 2019.
3 Study area and materials
3.1 Study area
The method is applied to a study area in Germany, North Rhine-Westphalia (NRW), incorporating 119 individual municipalities within 11 administrative districts. Münster, with 317,700 inhabitants (2021), is the biggest city in the western, monocentric organised part of the region. In the eastern part, the cities Bielefeld, Paderborn and Gütersloh form a polycentric city-region, also incorporating rural areas in the hinterland. In total, an area of 11,000 km² with around 934,000 buildings and 3.3 million inhabitants (about 4% of the total German population) is analysed. From 2011 to 2021, the population grew by 82,500 inhabitants (2.5%). From 2022 to 2032, a decline of –8000 (–0.2%) is predicted, growing to –81,000 (–2.4%) from 2022 to 2050. The decline takes place mainly in rural districts, while for Münster, Bielefeld and Gütersloh a positive development is predicted (see Table S1 in the supplemental data online). The development of real estate prices and housing rents was characterised by a steady increase of 62% and 31%, respectively, from 2011 to 2019, with the highest increase of 92% or €1800/m² in Münster (see Table S2 online).
3.2 Data
The presented study is based on cadastral data from the German Authoritative Real Estate Cadastre Information System (AdV 2023a). The real estate map contains individual land parcels, building polygons and land-use type. At present, ALKIS data are available as open data in eight federal states in Germany (Happ et al. 2022). The case study uses the open data for NRW. Information on ownership is not contained in the open accessible data.
Building coverage in terms of footprints can be retrieved from ALKIS as well as from the derived product Official Building Polygons (HU-DE) available for the whole of Germany since 2011 (AdV 2023b). To identify only the up-to-date situation of vacant lots, the building polygons from ALKIS can be used. As the aim is to illustrate the possibilities for monitoring and identifying the dynamics in the mobilisation of vacant lots, the HU-DE is used because it is available for a longer period of time. To delimit built-up areas, the German Digital Landscape Model of different years is used. Table 1 overviews the data used.
Table 1
Summary of the input data
| DATASET | YEAR | SOURCE |
|---|---|---|
| German Authoritative Real Estate Cadastre Information System (ALKIS®) | 2021 | www.opengeodata.nrw.de |
| Building polygons (HU-DE) | 2011, 2021 | © Geobasis-DE/BKG |
| Digital basic landscape model (ATKIS Basic DLM®) | 2001, 2011, 2021 | © Geobasis-DE/BKG |
| Administrative boundaries | 2019 | © Geobasis-DE/BKG |
4 Results
4.1 Quantity and spatial distribution of vacant lots
A total of 2403 ha of vacant lots within the study area was identified in 2021. This represents a share of 3.9% of the area for residential/mixed use or 7.3 m²/inhabitant. Aggregated at the municipality level, the share of vacant lot area ranges from 1.3% to 9.1% in 2021. A total of 90% of the municipalities lie in between 2.7% and 5.9%. Figure 6 shows the spatial distribution throughout the study area. The highest shares can be found in the administrative districts of Höxter, Steinfurt and Minden-Lübbecke—all three rather rural areas. Also, the evaluation following the RegioStaR-7 nomenclature shows an urban–rural gradient with the lowest shares of vacant lots in regiopolis and large cities, and the highest shares in small towns and villages (Table 5).
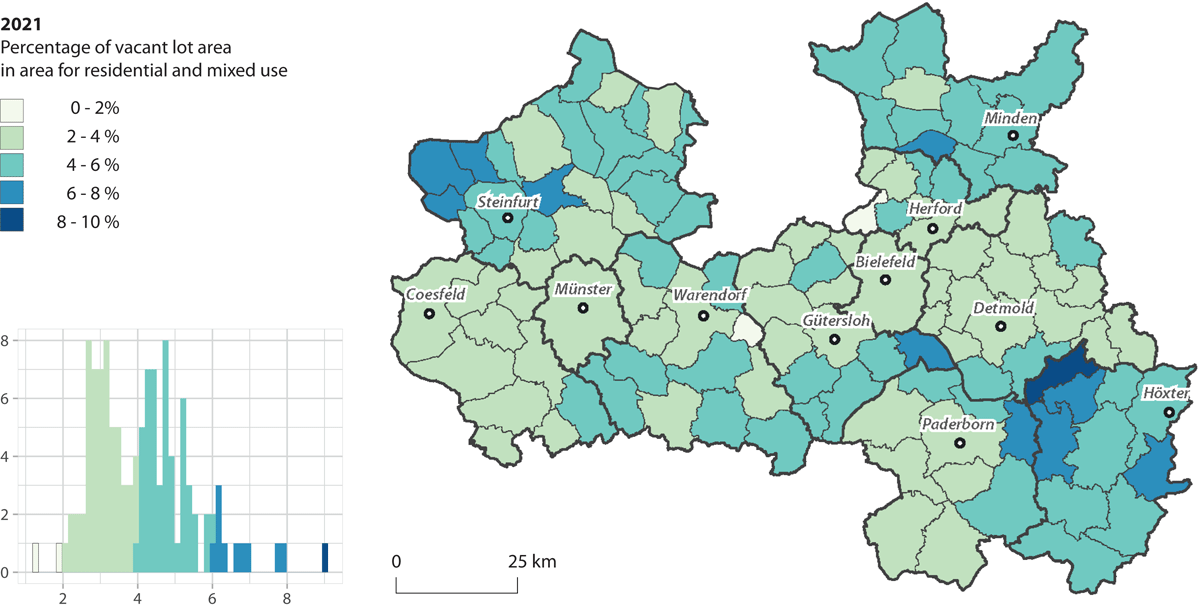
Figure 6
Spatial distribution of vacant lot area in 2021.
Source: Authors using geodata VG25 © Geobasis-DE/BKG 2019.
4.2 Parcel and neighbourhood characteristics
About 90% (2169 ha) of the identified vacant lots in 2021 are smaller than 2000 m², with an average size of 480 m² and an about 15 m diameter of the largest inscribable circle (Table 2). Only about 10% are larger than 2000 m².
Table 2
Statistics of vacant lot size and width, 2021
| MINIMUM | MAXIMUM | MEDIAN | MEAN | Q25 | Q75 | |
|---|---|---|---|---|---|---|
| Area (m²) | ||||||
| Vacant lots (< 2,000 m²) | 10 | 1,998 | 437 | 480 | 206 | 672 |
| Non-built-up reserves (≥ 2,000 m²) | 2,001 | 24,234 | 2,682 | 3,285 | 2,259 | 3,496 |
| Diameter of maximum inscribable circle (m) | ||||||
| Vacant lots (< 2,000 m²) | 0.1 | 42.3 | 15.8 | 15.1 | 9.1 | 20.7 |
| Non-built-up reserves (≥ 2,000 m²) | 9.8 | 136.8 | 40.0 | 42.2 | 34.0 | 47.5 |
The analysis of the small-scale distribution of vacant lots shows different aspects. More than 60% of the vacant lots within the study area are surrounded by already built-up parcels, while 27% are adjacent to another vacant lot (Table 3). Only 13% are part of a larger group with two or more adjacent vacant lots, giving the hypothetical opportunity for larger residential development. Looking at vacant lots within a 100 m buffer, agglomerations of vacant lots, not directly adjacent to each other, are found. Still, agglomerations with more than five vacant lots are scarce (about 15%). Figure 7 gives an example for the spatial distribution of vacant lots, showing isolated vacant lots as well as clustered ones. Furthermore, a high share is apparently situated in rather low-density neighbourhoods. Since only a qualitative assessment was possible in this study, methods for the description of building types by automated classification (Hecht 2014; Hecht et al. 2015) could be applied to quantify the neighbourhood context.
Table 3
Number of neighbouring vacant lots (only vacant lots ≥ 150 m²)
| NUMBER OF NEIGHBOURS | ||||||||
|---|---|---|---|---|---|---|---|---|
| 0 | 1 | 2 | 3 | 4 | 5 | 6–10 | > 10 | |
| Direct neighbours | 22,399 (60.60%) | 9,952 (26.92%) | 3,390 (9.17%) | 916 (2.48%) | 235 (0.64%) | 64 (0.17%) | 8 (0.02%) | 0 (0%) |
| Vacant lots within a 100 m buffer | 6,852 (18.54%) | 7,611 (20.59%) | 6,386 (17.28%) | 4,766 (12.89%) | 3,508 (9.49%) | 2,356 (6.37%) | 4,327 (11.71%) | 1,158 (3.13%) |
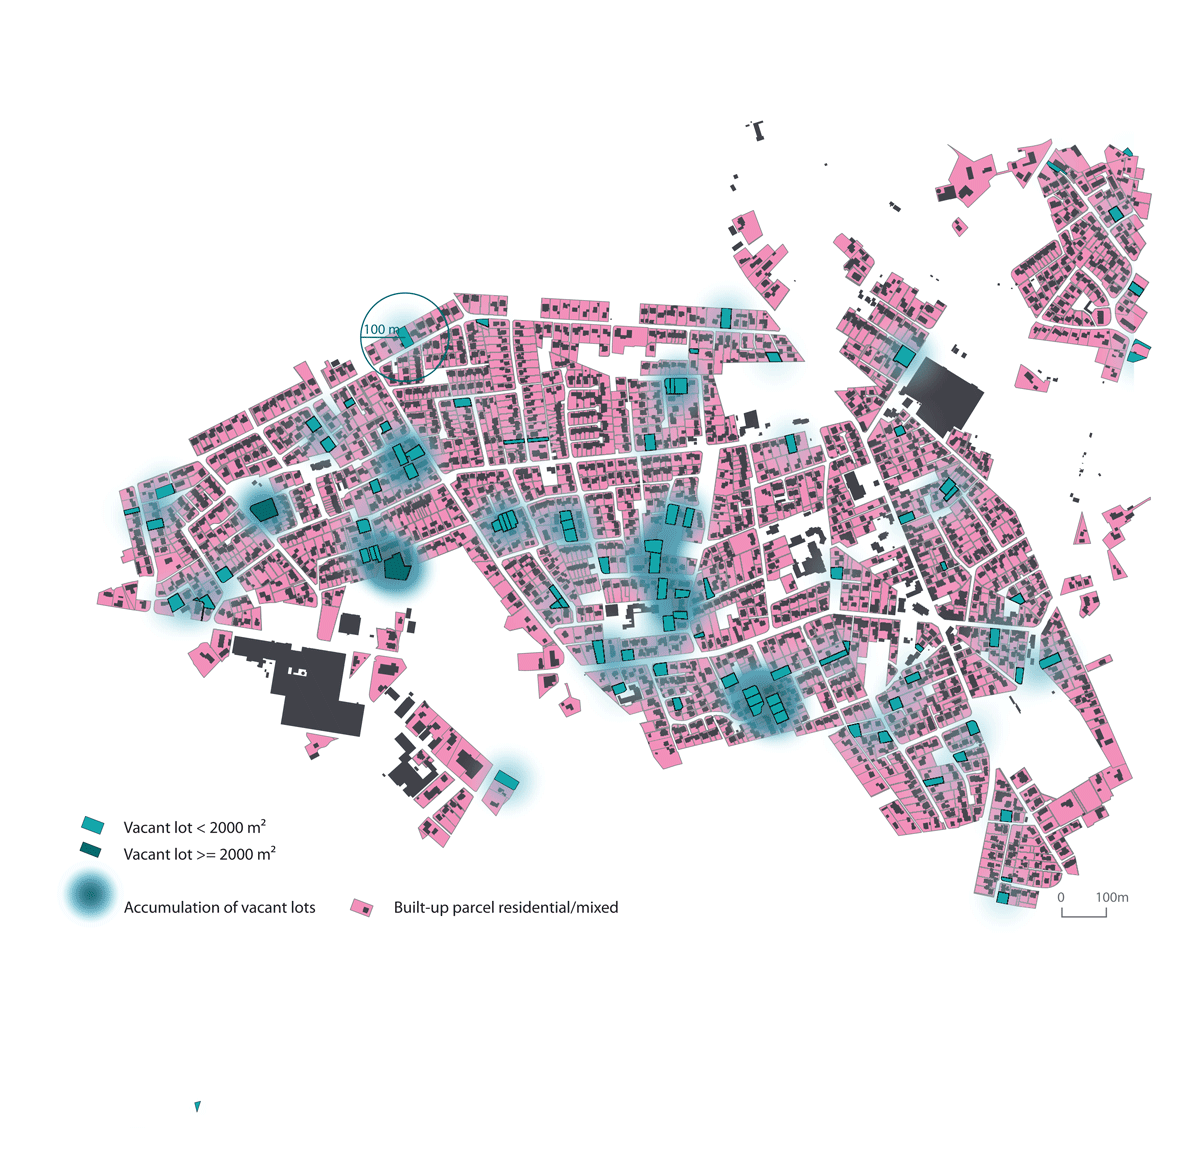
Figure 7
Small-scale spatial distribution of vacant lots with identification of agglomerations.
Source: Authors.
4.3 Change of vacant lots 2011–21
From 2011 to 2021, the total area of vacant lots decreased by about 8% (Table 4). The percentage describes the net balance, composed of the reduction of vacant lots that already existed in 2011 and of new, additional vacant lots on development areas that were considered temporary in 2011. These became persistent as they are still vacant after a minimum of 10 years. Considering these two components, there is a considerably higher reduction of vacant lots of 24%, but at the same time an addition of new vacant lots of 16%.
Table 4
Statistics on vacant lots in 2011 and 2021; and change, 2011–21
| VL | 2011 | 2021 | REDUCTION IN VL | NEW VL | Δ2011–21 |
|---|---|---|---|---|---|
| Area (ha) | 2,611 | 2,403 | –621 | 413 | –208 |
| % base 2011 | –23.78% | 15.82% | –7.96 percentage points |
[i] Note: VL = vacant lots.
Different patterns can be observed regarding the change of vacant lots throughout the area (Figure 8). The city of Münster has only little reduction (–0.7%), starting from an already low level (share vacant lots of 2.6%) in 2011. The administrative district of Höxter also shows small reduction rates (starting from higher rates than Münster), accompanied by high shares of new vacant lots, which indicates that development areas from before 2011 were not fully built-up. On the contrary, in the cities of Detmold and Paderborn, high reduction rates can be observed, while relatively few new vacant lots are added. The net balance shows that about a third of the municipalities have more vacant lots emerging than used for infill during the same period. This pattern can also be determined in Münster and its neighbouring municipalities in the west.
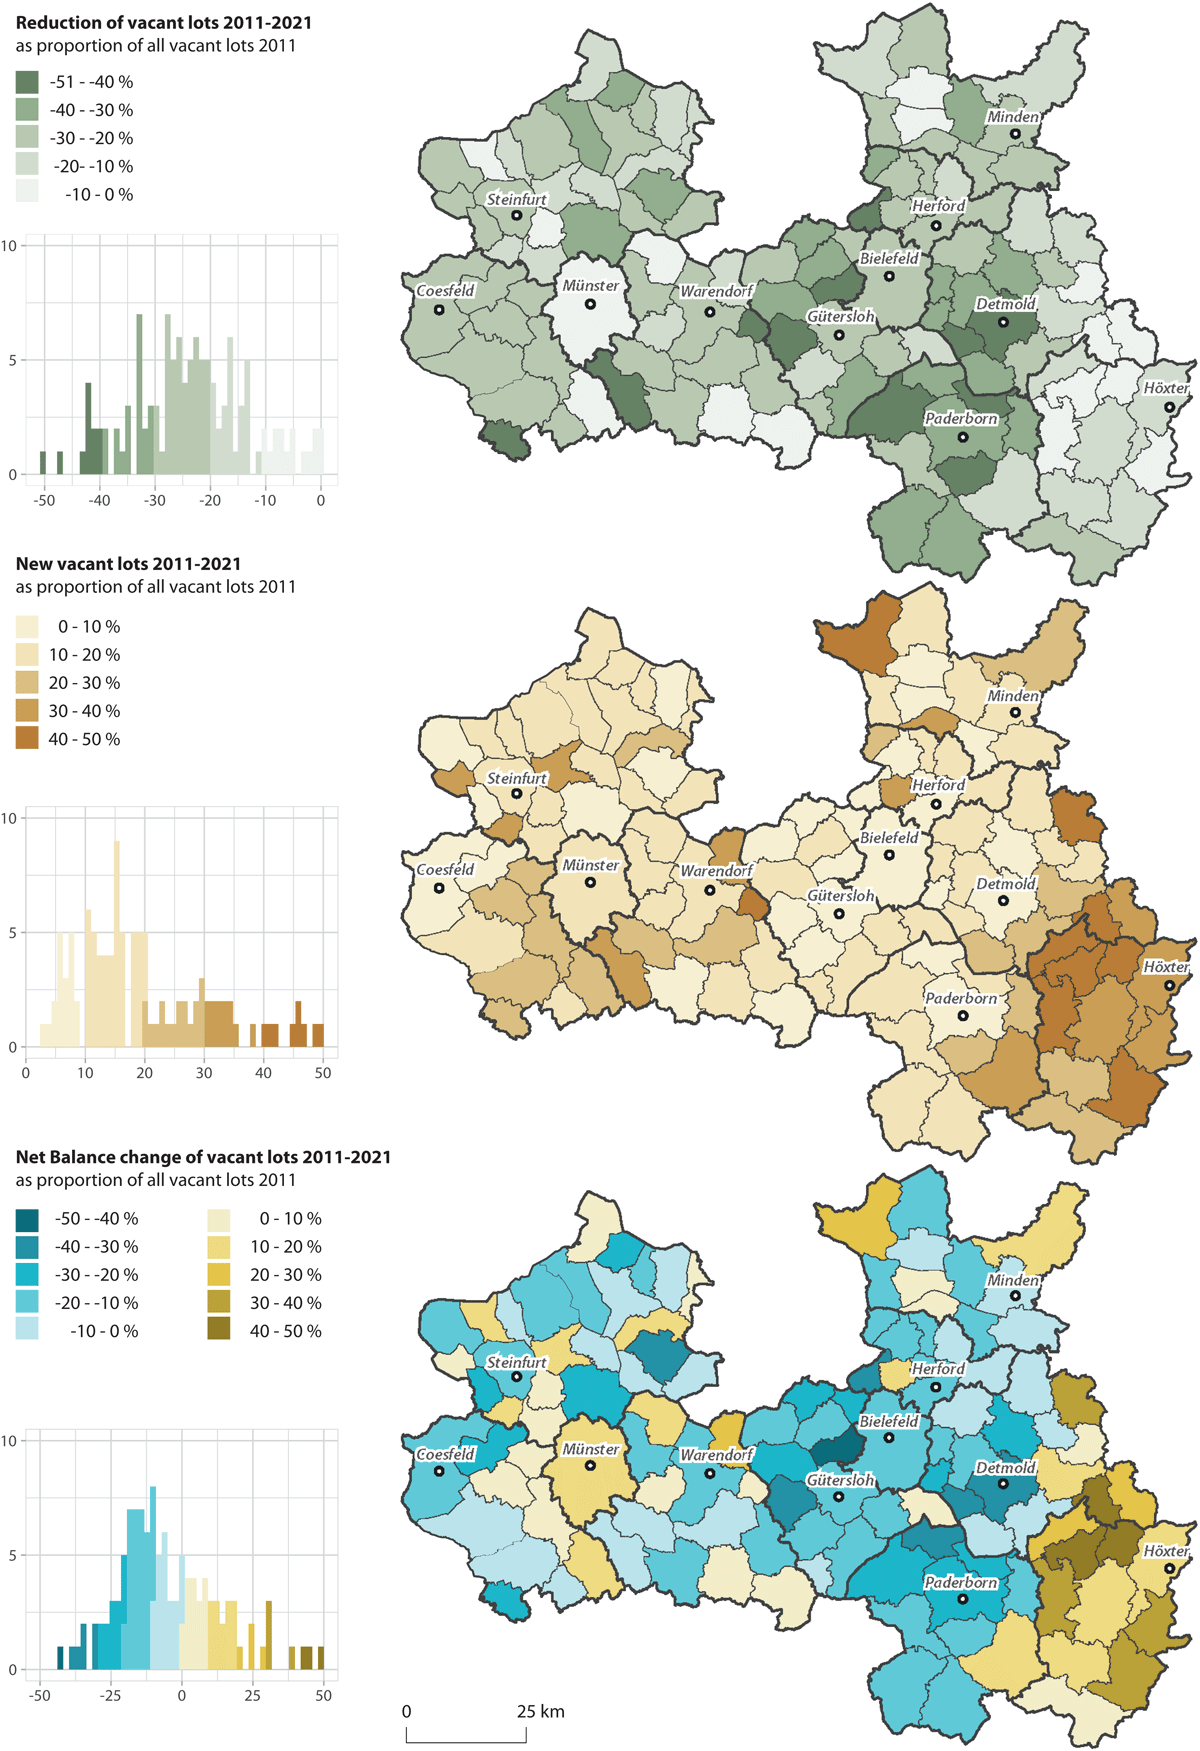
Figure 8
Spatial distribution of the change in vacant lot area (reduction, new vacant lots, net balance).
Source: Authors using geodata VG25 © Geobasis-DE/BKG 2019.
The aggregated figures show a reduction of vacant lots across all municipality types (Table 5). The highest reduction rates can be found in medium-sized cities and urban areas in metropolitan regions (MR2) and in central cities in rural areas (RR1). Although the small towns and village areas (MR3 and RR3) are also reducing vacant lots, they have considerably higher rates of new vacant lots, resulting in a net balance of +6.5% and +7.6%, respectively.
Table 5
Statistics on vacant lots in 2021; and change, 2011–21, by RegioStaR-7
| ID | REGIOSTAR-7 NOMENCLATURE | N | SHARE OF VL, 2021 | CHANGE IN VL AREA, 2011–21 (%) | ||
|---|---|---|---|---|---|---|
| REDUCTION IN VL | NEW VL | NET BALANCE | ||||
| MR1 | Regiopolis and large city | 3 | 2.99% | –20.17% | 9.49% | –10.69% |
| MR2 | Medium-sized cities and urban areas in metropolitan regions | 46 | 3.82% | –27.71% | 13.17% | –14.54% |
| MR3 | Small town areas and village areas in metropolitan regions | 12 | 4.46% | –20.70% | 27.22% | 6.52% |
| RR1 | Central city in rural regions | 5 | 3.99% | –26.26% | 12.32% | –13.93% |
| RR2 | Medium-sized cities and urban areas in rural regions | 27 | 4.18% | –21.55% | 17.84% | –3.71% |
| RR3 | Small town areas and village areas in rural regions | 26 | 4.40% | –18.57% | 26.17% | 7.60% |
[i] Note: VL = vacant lots.
For the spatial distribution of RegioStaR types, see Figure 5. Colours are according to the map.
4.4 Data Processing and validation
Table 6 describes the reduction of parcels in each data-processing step of the workflow. It becomes evident that the processing steps for reduction from non-built-up parcels to the final dataset of vacant lots is important in terms of quantity. Within these steps, the number of identified parcels decreases by 67%, while the area of the parcels is reduced by 39%. This indicates that many small parcels are eliminated, which can also be seen by the increasing average lot size.
Table 6
Reduction of parcels within the data-processing workflow
| DATA PROCESSING | N | AREA (HA) | SHARE ARM (%) | M² PER INHABITANTa | MEAN LOT SIZE (M²) |
|---|---|---|---|---|---|
| 1. Data preparation | |||||
| Parcels residential/mixed use in built-up areas | 914,461 | 61,852 | 100.00% | 186.48 | 676 |
| 2. Detection of non-built-up parcels | |||||
| Preliminary dataset of non-built-up parcels | 138,511 | 3,956 | 6.40% | 11.93 | 286 |
| 3. Parcel metrics and decision tree | |||||
| Reduction by size and shape | 67,991 | 3,368 | 5.44% | 10.15 | 495 |
| Reduction by neighbours and accessibility | 58,092 | 3,016 | 4.88% | 9.09 | 519 |
| Reduction by shared border and final data vacant lots | 53,629 | 2,924 | 4.73% | 8.82 | 545 |
| 4. Identification of temporary vacant lots | |||||
| Temporary vacant lots in development areas | 7,680 | 521 | 0.84% | 1.57 | 678 |
| Final data permanent vacant lots | 45,949 | 2,404 | 3.89% | 7.25 | 523 |
[i] Note: aNumber of inhabitants on 31 December 2020.
ARM = area residential and mixed use.
The accuracy of the results is evaluated by comparing the derived vacant lot layer with the reference data. In the reference dataset (n = 1385), 31.8 ha are classified as vacant lots, while 11.5 ha are classified as non-built-up parcels that cannot be considered vacant lots due to data issues. The validation results are displayed in Table 7.
Table 7
Validation of classified data
| TP RATE (%) | FN RATE (%) | TN RATE (%) | FP RATE (%) | ACCURACY (%) | ERROR RATE (%) |
|---|---|---|---|---|---|
| 99.65% | 0.35% | 83.95% | 16.05% | 95.49% | 4.51% |
[i] Note: TP = true positive; FN = false negative; TN = true negative; FP = false positive.
Four primary sources of error that lead to a false-positive or a false-negative classification were identified. A total of 68.9% of the errors occur due to a fragmented parcel structure. Parcels that are most likely part of a bigger property are classified as vacant parcels because the building is located on the other parcel (Figure 9, g–i). A total of 17.3% of the errors is caused by missing building polygons. In some cases, the missing building is not included in the data; others are excluded in the workflow by the threshold of 40 m², although they are part of a residential building or a terraced house (Figure 9, c, d). A total of 6.0% are false because of imprecise land-use information (e.g. parking lots next to multifamily housing are classified as residential use) (Figure 9, e, f). Last, there are 7.7% false-classified parcels caused by invalid mapping of the transport layer that helps checking accessibility (missing or unprecise mapping of streets) (Figure 9, a, b).
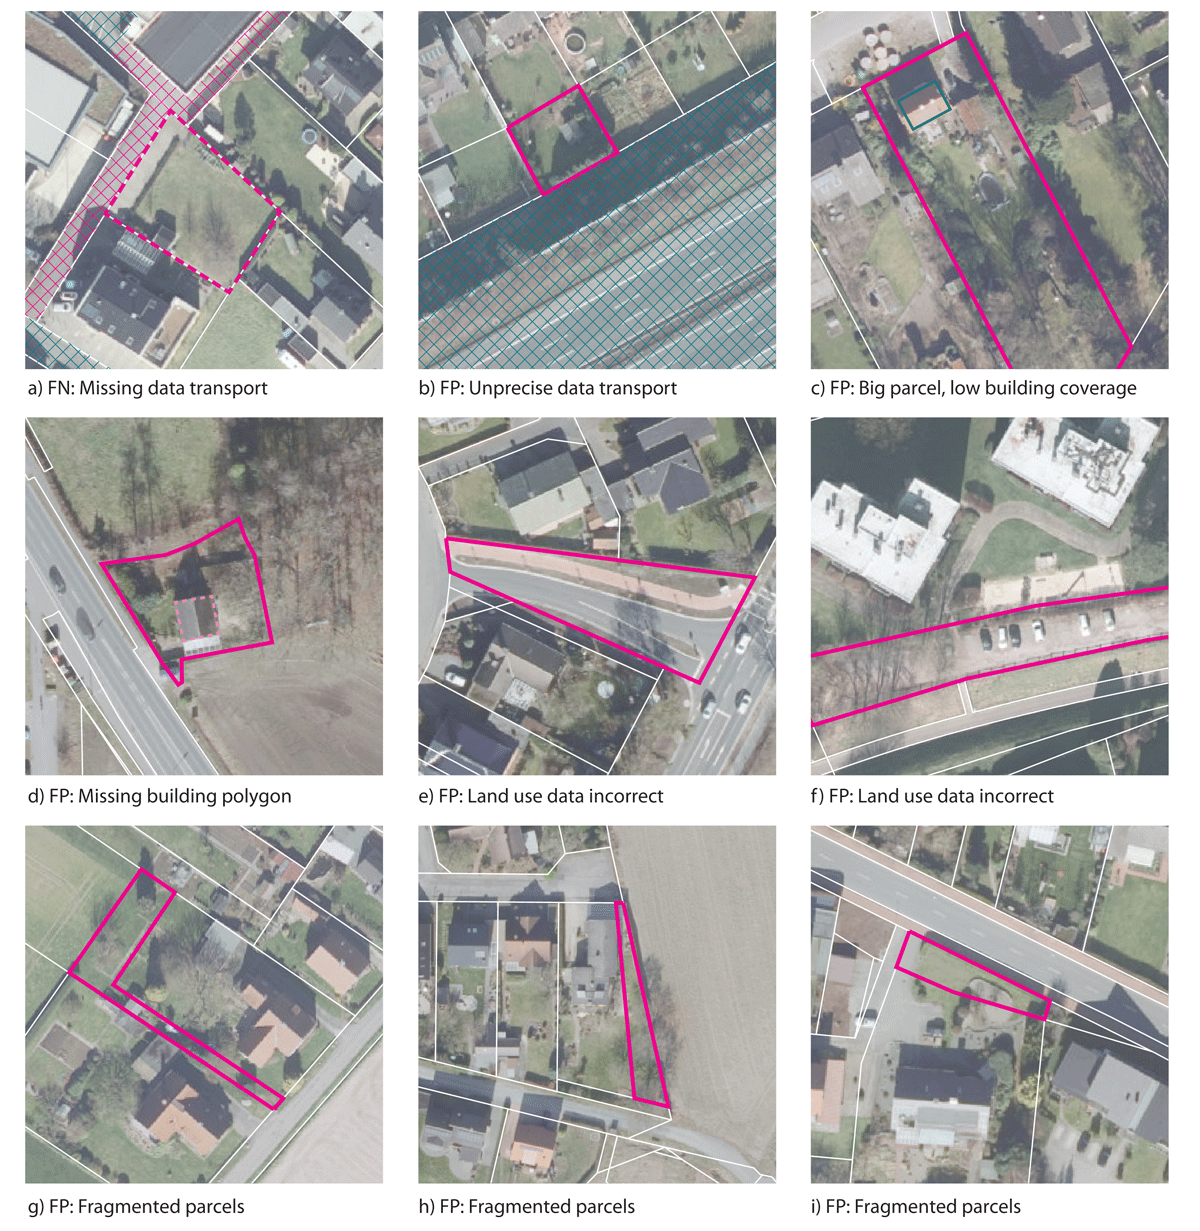
Figure 9
Examples of identified errors.
Note: FN = false negative; FP = false positive.
Source: Authors.
5 Discussion
The results of the spatial analysis are now discussed in relation to the research questions presented in section 1. Further issues are then addressed: methodological challenges, consistency and accuracy of the proposed workflow for identifying and analysing vacant lots, as well as limitations of the approach.
5.1 Potentials of vacant lots for sustainable urban development
Although the absolute figure of 2403 ha or 7.3 m²/inhabitant of vacant lots suggests a high potential for infill development, the expectations regarding the contribution to housing provision have to be discussed critically. Based on the identified characteristics of vacant lots, it must be assumed that, with few exceptions, development on these small IDPs will be low-density housing, as the amalgamation of small parcels rarely takes place (Gallagher et al. 2019). As a majority of the identified vacant lots were found to be isolated, only in a few cases was amalgamation followed by residential development with higher densities. Even if multi-family housing were possible on some of the bigger lots, German planning law may hamper the realisation. If a development plan exists with specifications for low densities, then exemptions have to be made on a case-by-case basis (Eichholz & Schoppengerd 2020). If a typical single-family housing (SFH) density of 10 buildings/ha is taken as a basis, then theoretically about 24,000 houses could be realised on the identified vacant lots. Compared with the 107,000 flats (49,000 in SFH) realised from 2011 to 2019 within the study area, this figure seems rather low. The predicted negative demographic development of the study area (described in the supplemental data online) may lead to lower housing demand and the redevelopment of already built-up land also contributes to new housing provision. However, strategic planning has to be involved more actively in the development of the remaining infill potentials. This would facilitate sustainable development, e.g. housing with higher densities or keeping lots undeveloped for ecological or social reasons.
Most of the identified vacant lots are likely to be privately owned. The study’s focus is on theoretical infill potentials, not market availability or the ambitions of landowners to develop the land (Adams et al. 2002; Schiller et al. 2021). Adding to the point of market availability, the results show that during the analysed time span, one out of four vacant lots is actually used for infill activity, while about 75% remains vacant. The assumption that most of the infill potentials that can be easily mobilised are already depleted, especially in cities with dense housing markets (Eichhorn & Siedentop 2022), seems to be true for Münster. While the city is among those in Germany with the most extreme housing markets, showing an extreme increase in housing prices during the last decade (Ehrhardt et al. 2022), it only has a very low mobilisation rate of –0.7%. However, it is an exception within the study area. The other two large cities (Bielefeld and Paderborn) were able to reduce their vacant lot area by 20% and 36%, respectively, and also smaller, more rural municipalities show similar reduction rates. Thus, unlike in some countries such as Switzerland, where infill development is realised mainly by the redevelopment of the existing housing stock due to a lack of vacant land (Debrunner & Hartmann 2020), such a strong trend for infill development for the present German research area cannot be confirmed.
The clear urban–rural gradient regarding the emergence of new vacant lots is striking. The results confirm a well-known problem of the German passive land-management approach: large proportions of development land stay vacant. This is not the case in countries with a more active approach, where vacant lots are expensive for municipalities, as they are involved in the development directly (Hartmann & Spit 2015). The results show that this German paradox of building land (Davy 1996) is still a relevant problem, which leads to further land-take, while existing IDPs are unused.
Although the aim of this study was to identify and analyse vacant lots with potential for residential infill, it must be emphasised that they are also of interest for ecological, biodiversity and climatic reasons, as well as for community benefit (Kim et al. 2018; Kremer et al. 2013; Smith et al. 2017; Bibby et al. 2020). Thus, undeveloped plots may be in some cases the better decision. These aspects are of major interest, particularly for suburban areas, where most of the identified vacant lots are located. The presented method for the automatic identification of vacant lots can help future research to dig deeper into suburban densification processes. There is a role for future research to integrate the indicators for ecological value of a parcel to inform development decisions.
5.2 Automatic detection approach
Using cadastral data, the authors were able to improve most of the errors (e.g. missing lot boundaries or unprecise land-use information) found by Schiller et al. (2021). Adding to practice-oriented and regionally adapted approaches by Elend et al. (2013) or Nebel et al. (2017), the proposed approach reduces manual steps such as checking the land use of non-built-up areas (e.g. whether the identified vacant lot is a playground) and the elimination of small, fragmented parcels, which allows a scaling up of the method to bigger areas. The importance of the latter to develop reliable data for urban and regional planning is highlighted by the reduction of the pre-processed dataset of non-built-up areas to the final vacant lot dataset by 39% (1552 ha). Some challenges in making use of geodata science are considered below on how to reduce complexity in urban development and make information available for policy development and planning practice.
The results show a higher share of vacant lots, in comparison with the latest survey-based figures for IDPs in Germany (Blum et al. 2022). This indicates an underestimation of these small IDPs by local authorities. For the spatial scope of NRW and Hessen, the survey finds 6.7–9.7 m² of IDP/inhabitant in 2020, containing not only vacant lots but also brownfields (Blum et al. 2022). As about 60% of the IDPs are vacant lots (4.0–5.8 m²), the result of 7.3 m² is considerably higher than the upper estimate of the survey, even though the focus is on vacant lots with residential/mixed land use only. Also, the methodological decision only to account for accessible vacant lots, leaving aside parcels in larger urban blocks where access can easily be established, suggests an even higher actual value. This discrepancy underlines the importance of automatic approaches when it comes to the identification of a multitude of heterogeneous and small IDPs to come to a comprehensive understanding of existing potentials.
The high true-positive rate of the validation shows nearly all vacant lots with residential/mixed use are detected. False positives are a bigger issue, leading to a slight overestimation of vacant lot area. This issue can be overcome at the local level because municipalities have information about property. However, national-level data are not currently available in Germany. Moreover, data issues on incorrect or unprecise land-use data add to the false-positive rate, which is a known phenomenon concerning ALKIS data (Blechschmidt & Meinel 2022), cannot be corrected on the user’s side. A reduction in false positives could be achieved by refining the partly unprecise transport layer by making use of another data source containing information on the street type. The same applies for missing building polygons due to the 40 m² filter. By using address data, building footprints of less than 40 m² that still have an individual address (e.g. very small terraced houses) can be identified and retained.
Although the overall accuracy is solid, the validation process requires critical consideration. A generally accepted definition of vacant lots is needed and there are challenges regarding the reference data. Even if the suggested approach is well recognised (Schiller et al. 2021), in some cases it is hard to determine a vacant lot. This is especially true for fragmented parcels or parcels which are parts of SFH gardens. Using existing IDP cadastres would not solve the problem, because each city has different definitions of vacant lots. The presented research may be a first step to develop a definition of vacant lots, adding specific aspects of a cadastral-based view.
Some limitations need to be considered regarding the analysis of change from 2011 to 2021. Due to limited data availability, this study focused on an ex-post analysis, using cadastral data from 2021 only, but building footprints from 2011. As cadastral structure is found to be very stable over time (Gallagher et al. 2019), the results can be considered reliable. Nevertheless, in future it will be possible to construct more precise time series: the correct cadastral structure can be used for each year and therefore cadastral change can be included.
In practice, the presented approach can provide basic information on vacant lots for small municipalities with little financial capacities at low cost and thereby support local planning decisions. Many municipal IDP cadastres in Germany are rarely kept up to date. The possibility for automated (e.g. yearly) updates using the suggested workflow appears to be highly promising. To scale up the method for monitoring at the regional or national level, data issues have to be taken into account. Even if ALKIS is a standardised product, differences in data quality between federal states or cadastral agencies are to be expected (Blechschmidt & Meinel 2022) and have to be examined thoroughly before any regional comparison can be made.
For use in a wider international context, the approach has to be adapted to the available data. While building data could be used from open street map, cadastral and land-use data will show differences from country to country. In some areas of the world, cadastral data are not available at all. Also, thresholds within the vacant lot definition and the workflow may vary, due to local specifics of the urban form (Jehling & Hecht 2021). However, a comparison of vacant lot rates and development in countries with different land management approaches (e.g. Germany and the Netherlands) can be rewarding (Hartmann & Spit 2015).
6 Conclusions
Using cadastral data, this study presented a workflow for identifying vacant lots automatically for large areas in two points in time. This provides a basis for an evidence-based discussion of soft densification processes and the relevance of vacant lots for future residential infill development.
The method was tested in a case study in Germany, covering an area of 11,000 km² with 3.3 million inhabitants, showing a high reliability of the results with an accuracy of 95.5%. The study showed a general decline of vacant lots between 2011 and 2021, but new vacant lots are emerging in development areas that are not fully built-up (e.g. rural areas). This reveals an unsustainable development by additional land take, while buildable land is still available within existing settlement structures. Second, the characteristics of vacant lots indicate that most likely future development on these infill potentials will be low-density housing.
Planning strategies are needed for soft densification, which are typically driven by individuals and private owners. For suburban densification and transformation processes, local planning authorities need to consider the few larger vacant lots and agglomerations of small vacant lots in order to develop more compact residential structures.
The presented approach can be used to model and test policy assumptions and evaluate planning strategies. Future research can investigate the impact factors on whether a lot is developed (e.g. land or real estate prices, neighbourhood characteristics) and on how the lot is developed (e.g. amalgamation or subdivision of parcels and resulting building density).
Funding
This study was partly supported by the Umweltbundesamt (German Environment Agency) (grant number 3720 15 106 0).
Supplemental data
Supplemental data for this article can be accessed at: DOI: https://doi.org/10.5334/bc.295.s1.
Acknowledgements
The authors thank the German Environment Agency for support, which enabled the RWI Real Estate Data to be accessed. The authors also thank the editor and anonymous reviewers for their valuable comments and suggestions.
Competing interests
The authors have no competing interests to declare.