
| BLS | Building life span |
| CLT | Cross-laminated timber |
| DCFs | Dynamic characterisation factors |
| DWC | Dynamic weighting coefficients |
| EPD | Environmental product declaration |
| GGBFS | Ground granulated blast furnace slag |
| GHG | Greenhouse gas |
| GWP | Global warming potential |
| HWP | Harvested wood product |
| LCI | Life cycle inventory |
| LCA | Life cycle assessment |
| RE2020 | Règlementation Environnementale 2020 (French 2020 Environmental Regulation) |
| SNBC | Stratégie Nationale Bas Carbone (French National Low Carbon Strategy) |
| TH | Time horizon of GWP analysis |
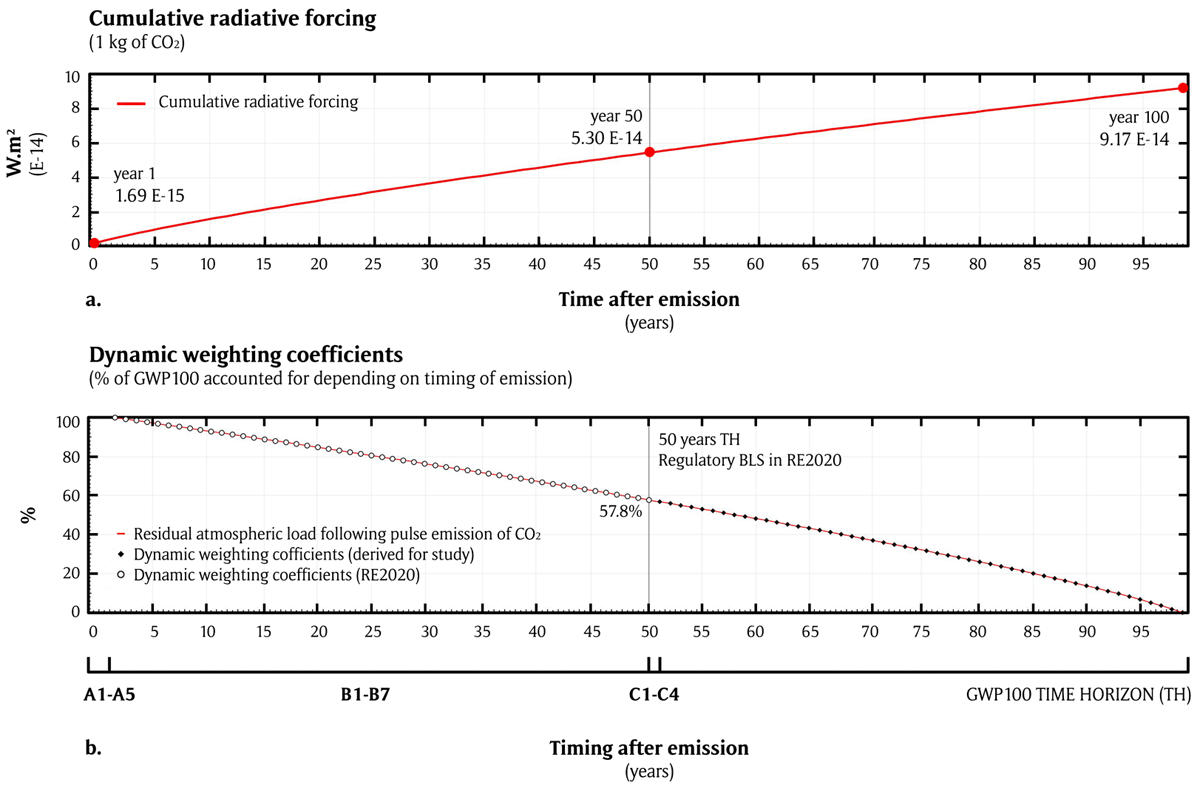
Figure 1
Atmospheric load following pulse emission of CO2 (a) and derived dynamic weighting coefficients (DWC) (b), shown for a time horizon of analysis of 100 years.
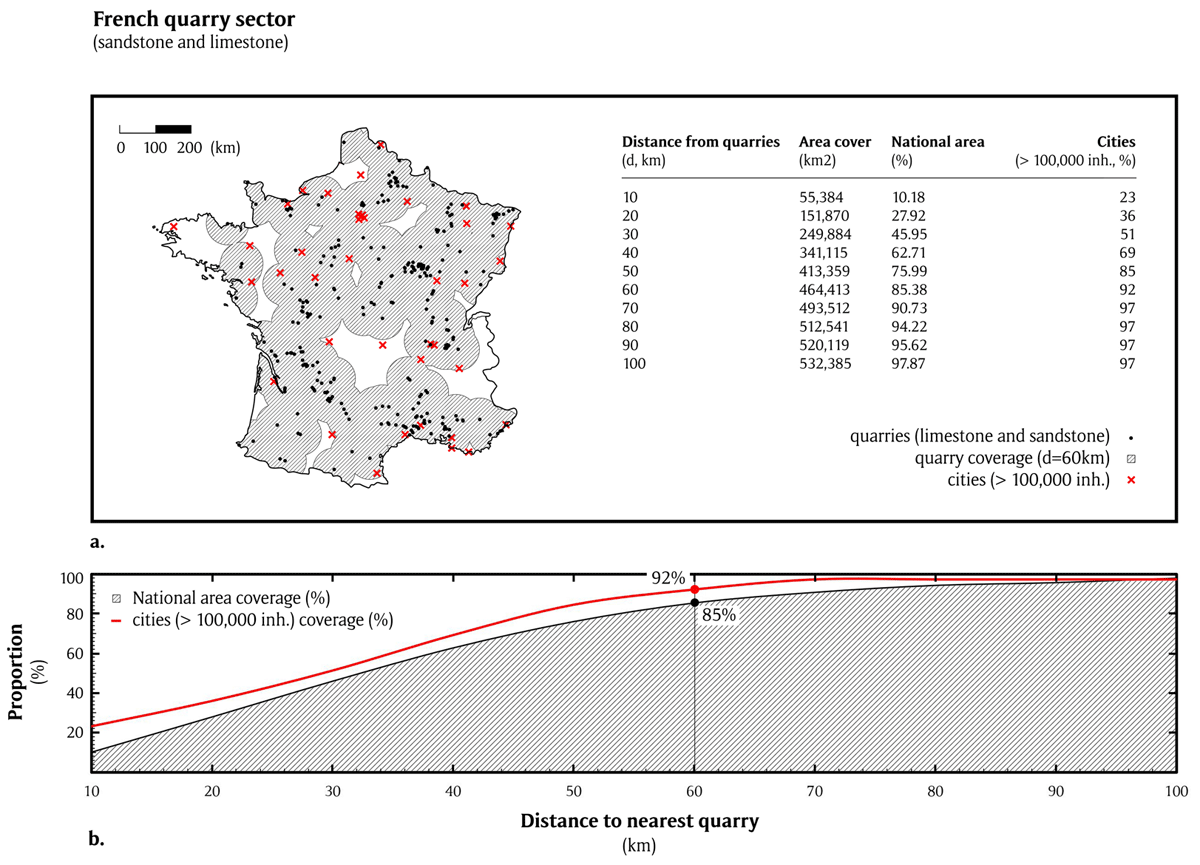
Figure 2
National area coverage versus transport distances from quarries (i.e. A4 construction process stage) for France (a 60 km radius shown in (a)).
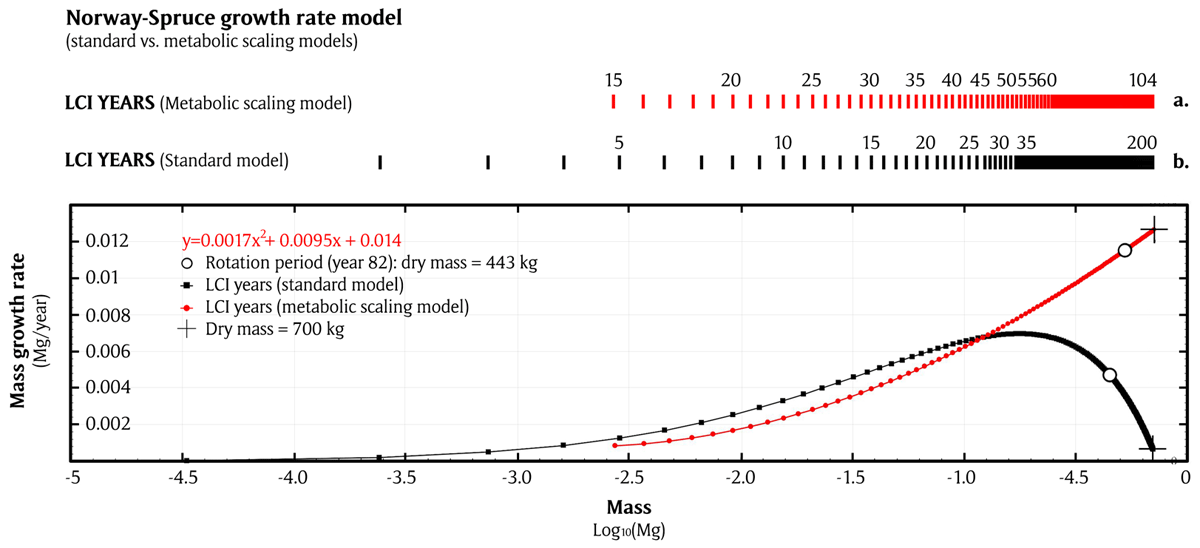
Figure 3
Differing growth rate models for Norway spruce (i.e. Picea abies): standard scaling model showing decreasing growth rate with tree size versus metabolic scaling model showing increasing growth rate with tree size.
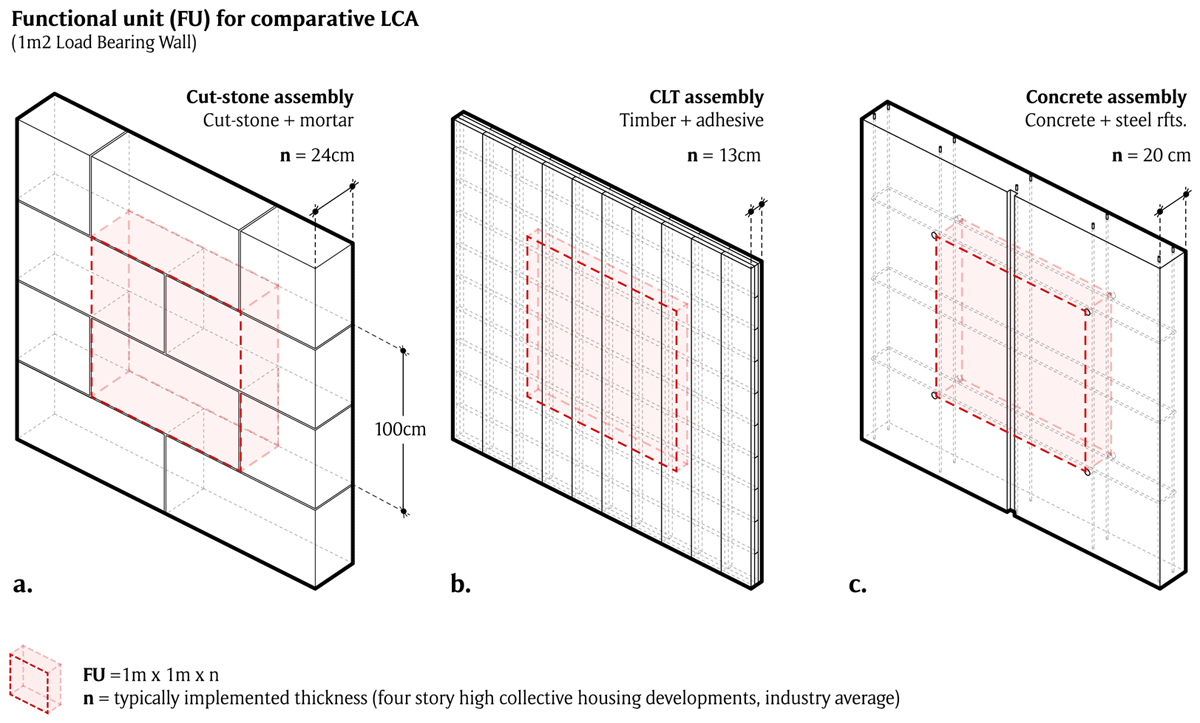
Figure 4
Comparative life cycle assessment (LCA) functional unit of 1 m2, with varying thicknesses (industry averages for considered building heights), shown for natural cut-stones (a), harvested wood products (HWPs) (i.e. cross-laminated timber (CLT) in (b)) and concretes (c).
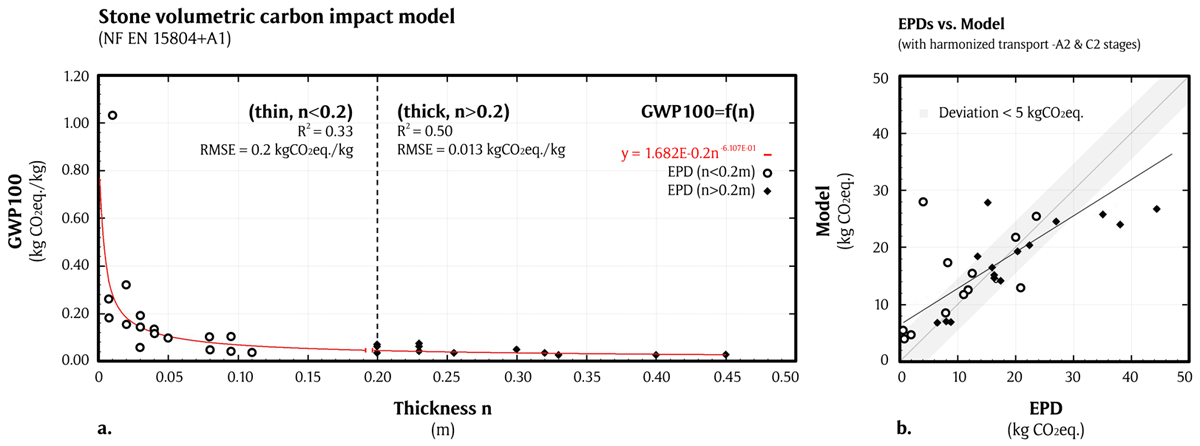
Figure 5
Volumetric carbon impact model for stone shown (a) for a 100-year time horizon of analysis, and a 50-year building life spans (BLSs) (i.e. GWP100/kg of natural stone as a function of product thickness n), and model plots against currently available environmental product declarations (EPDs) (b).
Table 1
Stone volumetric carbon impact model scaling (δ) and exponent (ɛ) factors for different time horizons (TH) and building life spans (BLS).
| BLS (YEARS) | TH = 100 | TH = 200 | ||
|---|---|---|---|---|
| δ | ɛ | δ | ɛ | |
| 50 | 1.68E–02 | –6.107E–01 | 1.775E–02 | –6.113E–01 |
| 100 | 1.456E–02 | –5.789E–01 | 1.726E–02 | –6.061E–01 |
[i] Note: For a static life cycle assessment (LCA), δ = 1.923E–02 and ɛ = –6.052E–01.
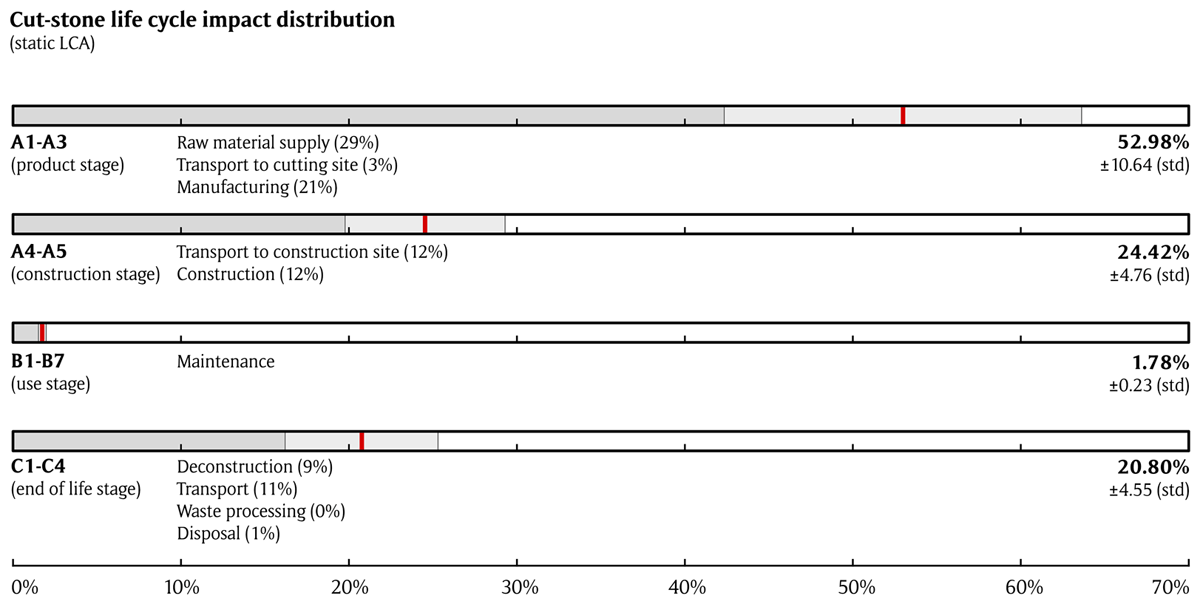
Figure 6
Distribution of life cycle impacts for thick-dimension stone material assemblies (i.e. n > 0.2 m), displayed for static life cycle assessment (LCA) (i.e. full account of all life cycle inventory (LCI) emissions, without timing-based weighting).
Table 2
Comparative dynamic life cycle assessment (LCA); stone model against various harvested wood products (HWPs) and concrete global warming potential (GWP) models shown for 1 m2 of load-bearing wall surface: (a) GWP100 (kg CO2e) for a 50-year of building life spans; and (b) sensitivity analysis for a 100-year building life span (GWP200).
| THICKNESS (CM) | STONE | CEM I | CEM III 1 | CEM III 2 | CLT 1 | CLT 2 | CLT 3 | CLT 4 |
|---|---|---|---|---|---|---|---|---|
| (a) GWP100 | ||||||||
| 0.10 | 25.70 | 15.17 | 21.92 | –17.69 | 11.69 | 20.21 | 50.70 | |
| 0.20 | 16.65 | 55.40 | 37.06 | 49.52 | –35.38 | 22.09 | 39.14 | 100.11 |
| 0.30 | 19.49 | 85.06 | 58.96 | 77.19 | –53.07 | 32.49 | 58.06 | 149.52 |
| 0.40 | 21.80 | 114.73 | 80.56 | 104.87 | –70.76 | 42.89 | 76.99 | 198.94 |
| (b) GWP200 | ||||||||
| 0.10 | 23.50 | 12.86 | 19.03 | –17.48 | –4.38 | 4.37 | 36.75 | |
| 0.20 | 16.96 | 53.09 | 34.18 | 46.63 | –34.96 | –8.78 | 8.76 | 73.52 |
| 0.30 | 19.89 | 82.75 | 56.08 | 74.31 | –52.44 | –13.16 | 13.14 | 110.28 |
| 0.40 | 22.28 | 112.41 | 77.68 | 101.99 | –69.92 | –17.55 | 17.52 | 147.04 |
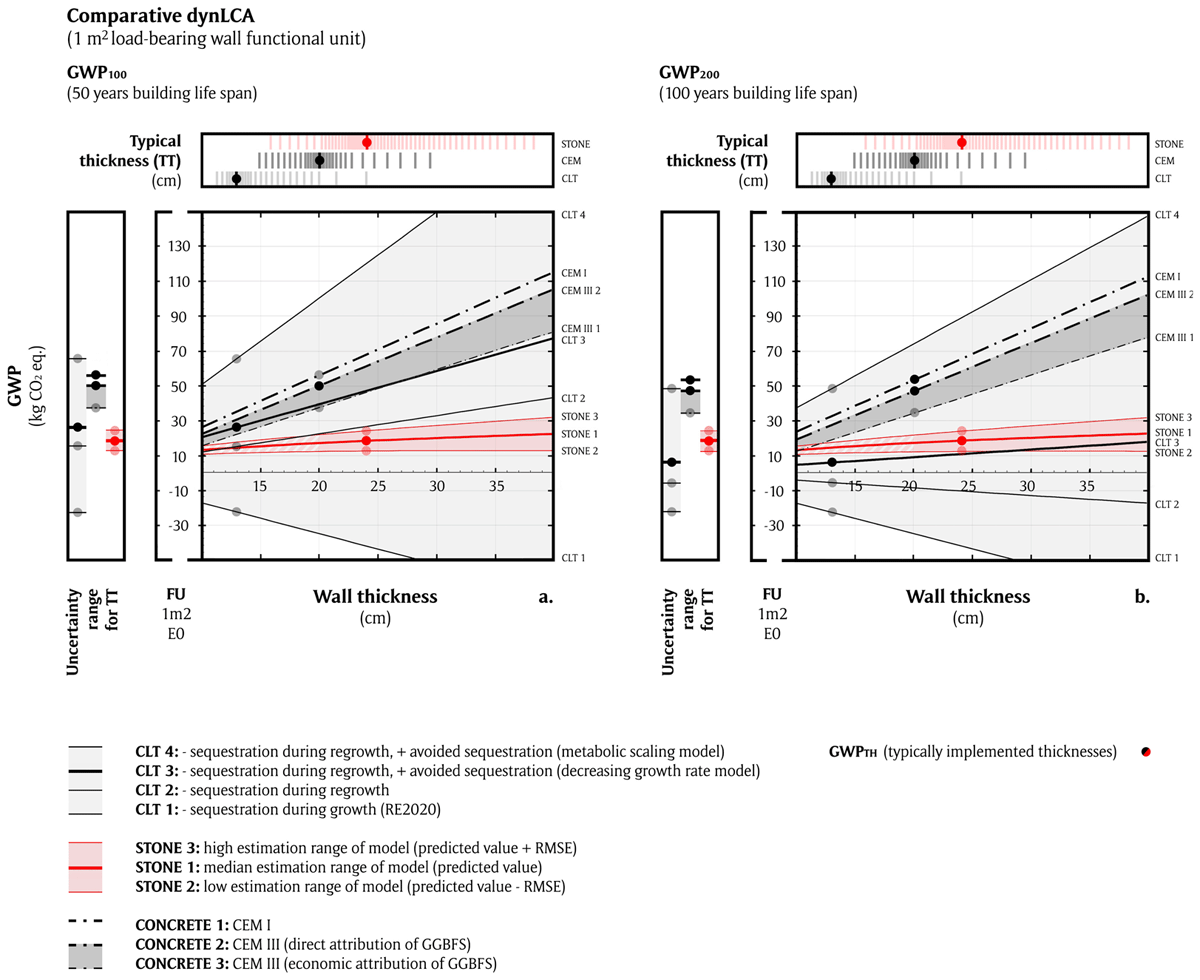
Figure 7
Comparative dynamic life cycle assessment (LCA); stone model against various harvested wood products (HWPs) and concrete global warming potential (GWP) models: (a) GWP100 for 50-year life spans; and (b) sensitivity analysis for 100-year building life spans (BLSs) (GWP200).
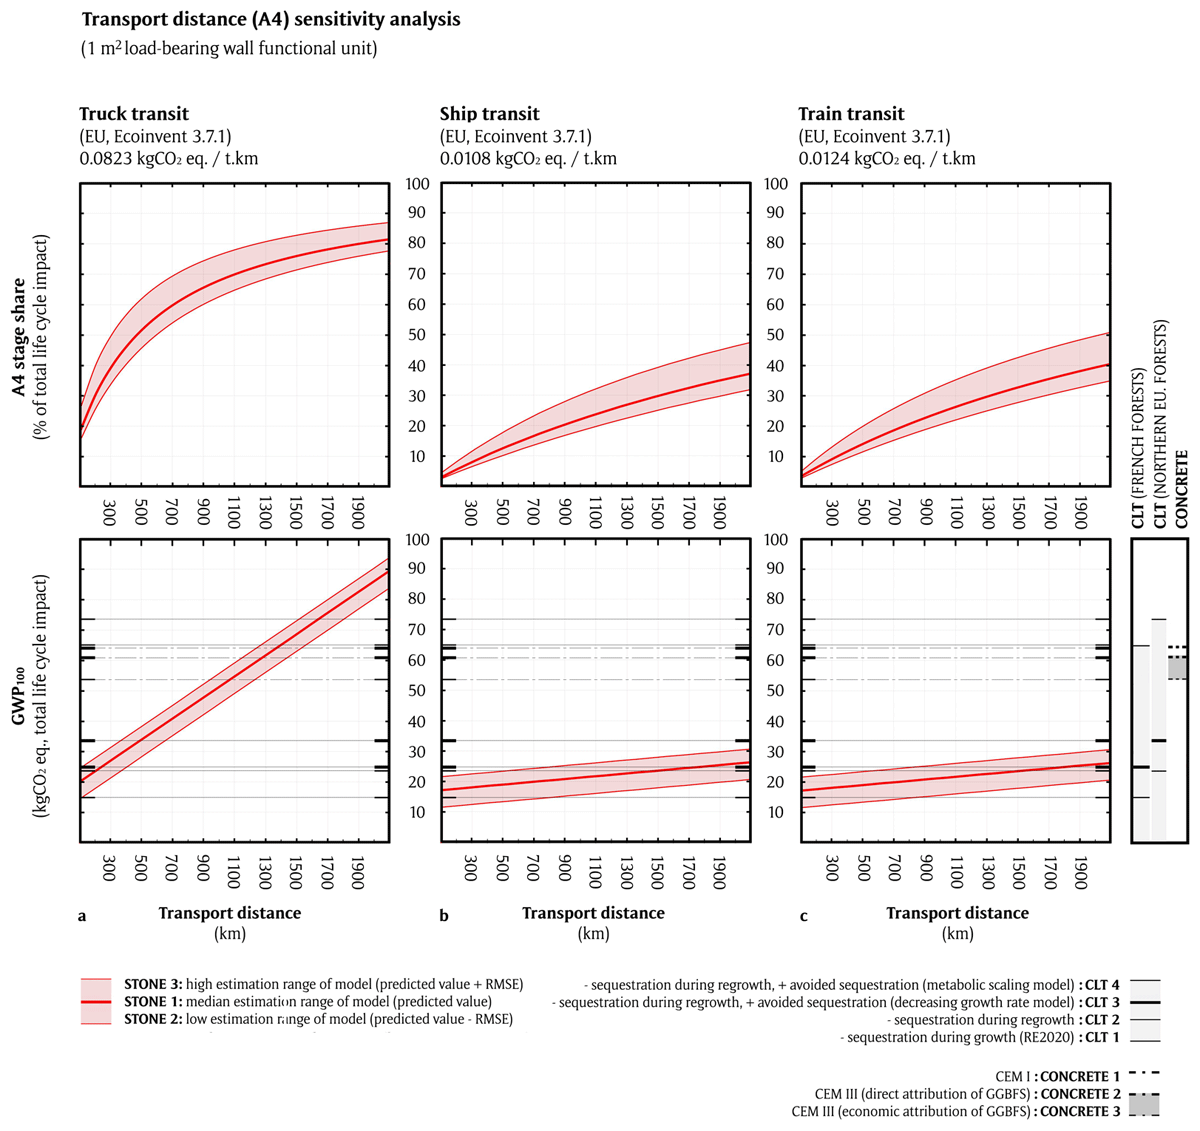
Figure 8
Impact of increased transport distances (A4: transport to building site) on total life cycle carbon impact of a 1 m2 load-bearing cut-stone wall, assuming an average density of 1851 kg/m3, a thickness of n = 24 cm and a building lifespan of 50 years, compared with fixed national average A4 transport distances for concrete and cross-laminated timber (CLT) assemblies (30 and 287 km, respectively).
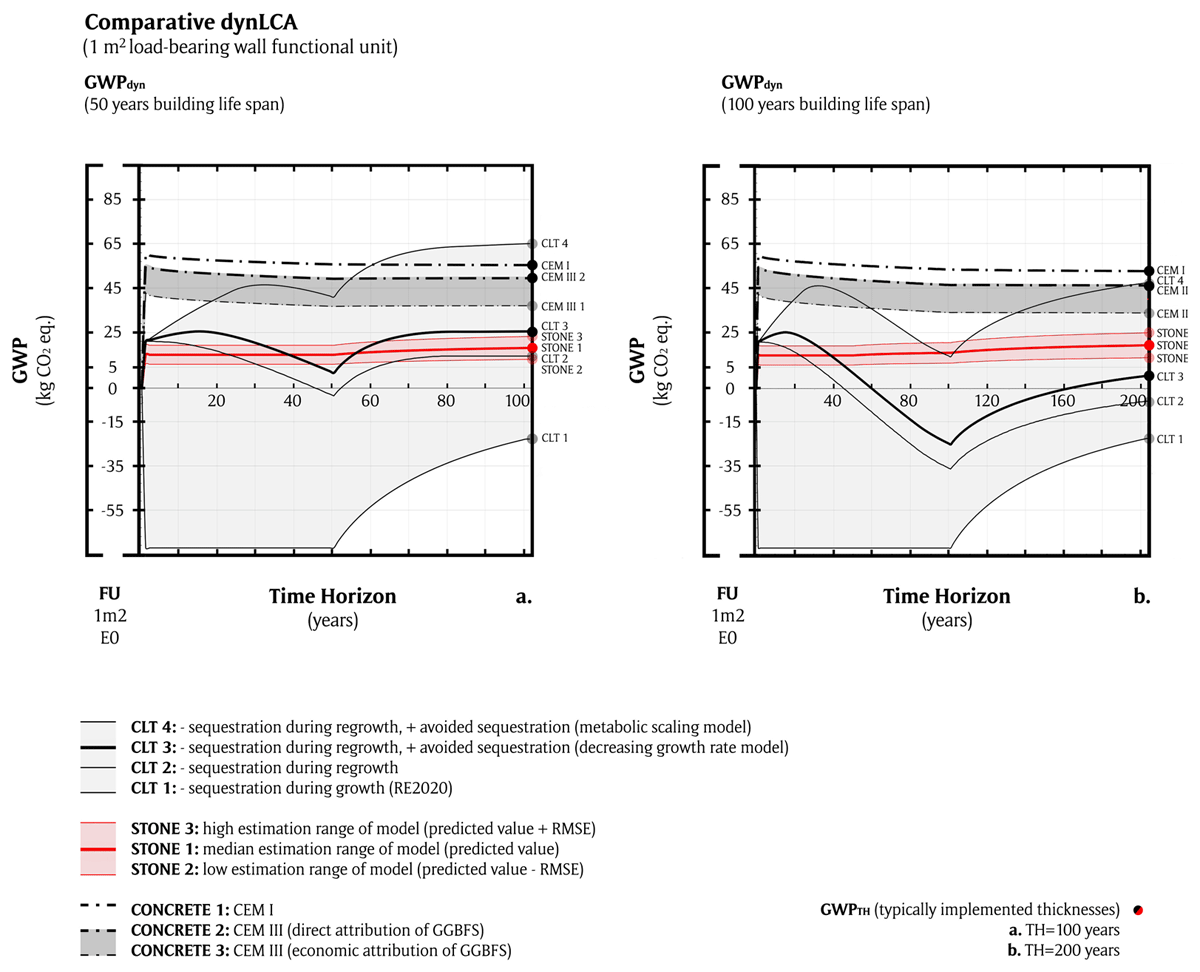
Figure 9
Comparative dynamic life cycle assessment (LCA); the stone model against various harvested wood products (HWPs) and concrete global warming potential (GWP) models shown for load-bearing wall surfaces with typically implemented thicknesses (13, 20 and 24 cm for cross-laminated timber (CLT), concrete and stone walls, respectively): (a) GWPdyn for 50-year life spans; and (b) sensitivity analysis for 100-year life spans.
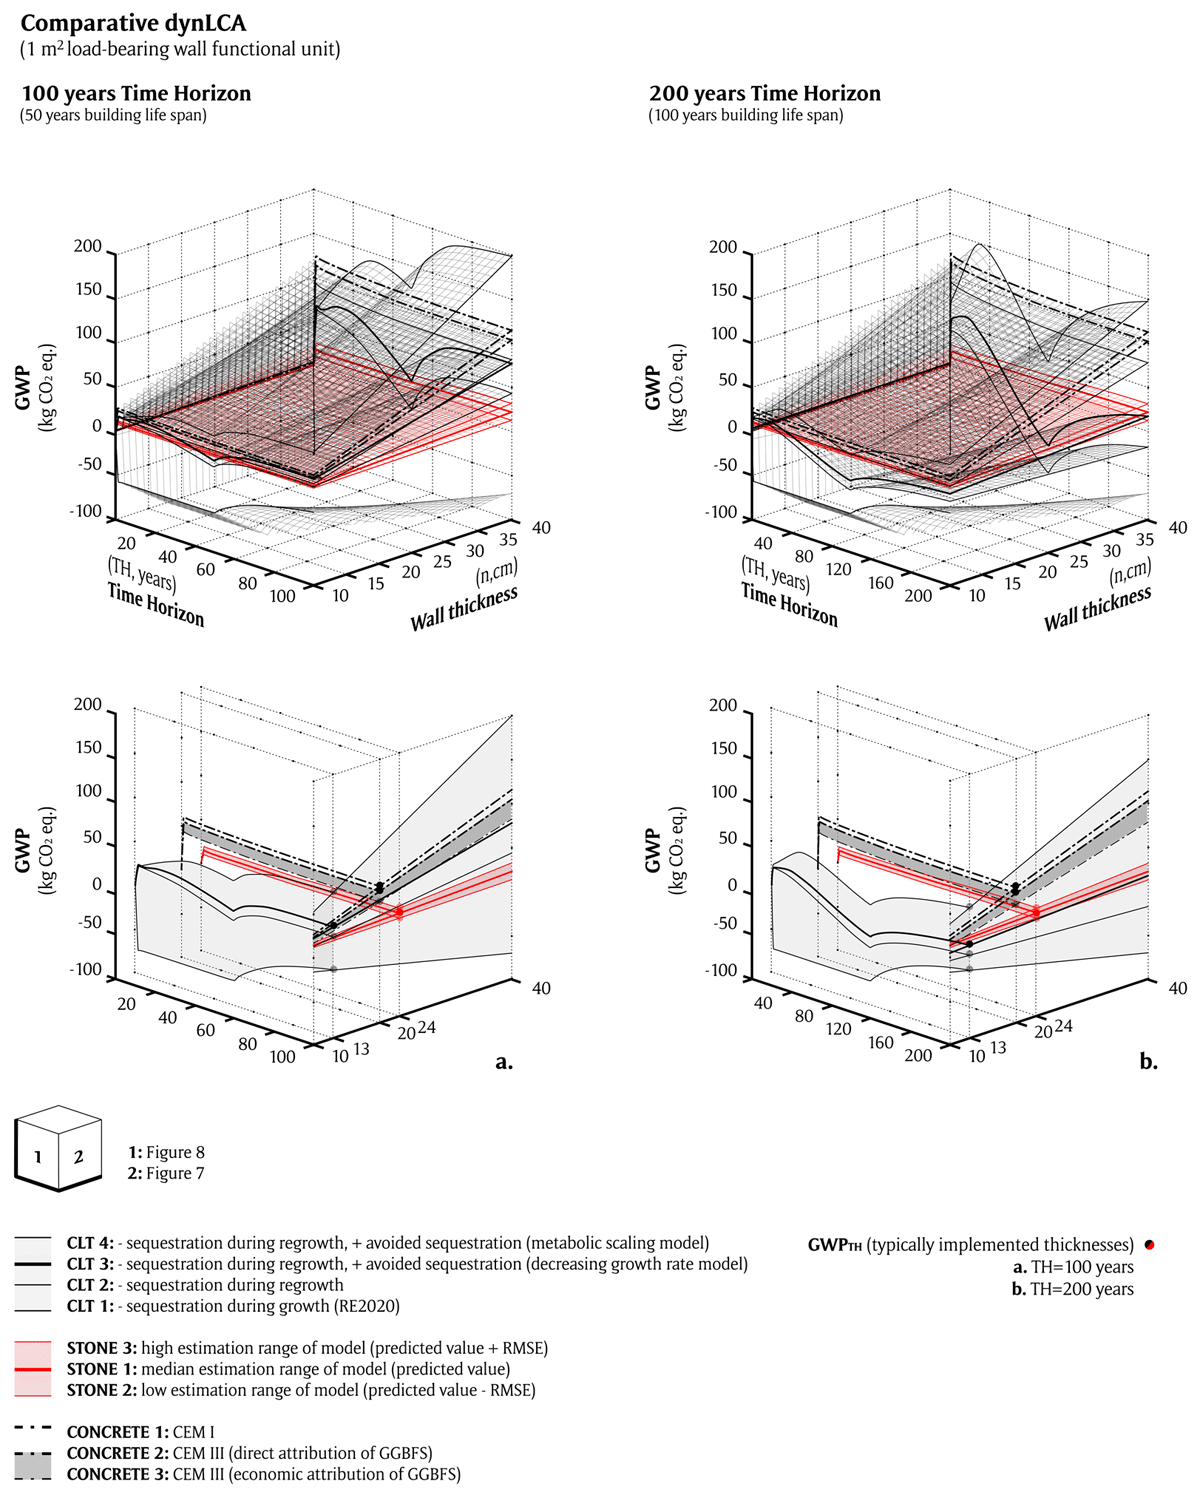
Figure 10
Comparative dynamic life cycle assessment (LCA); the stone model against various harvested wood products (HWPs) and concrete global warming potential (GWP) models shown for 1 m2 of load-bearing wall surface. (a) GWP for 50-year life spans; and (b) sensitivity analysis for 100-year life spans. Typically implemented thicknesses are highlighted in the lower figures.
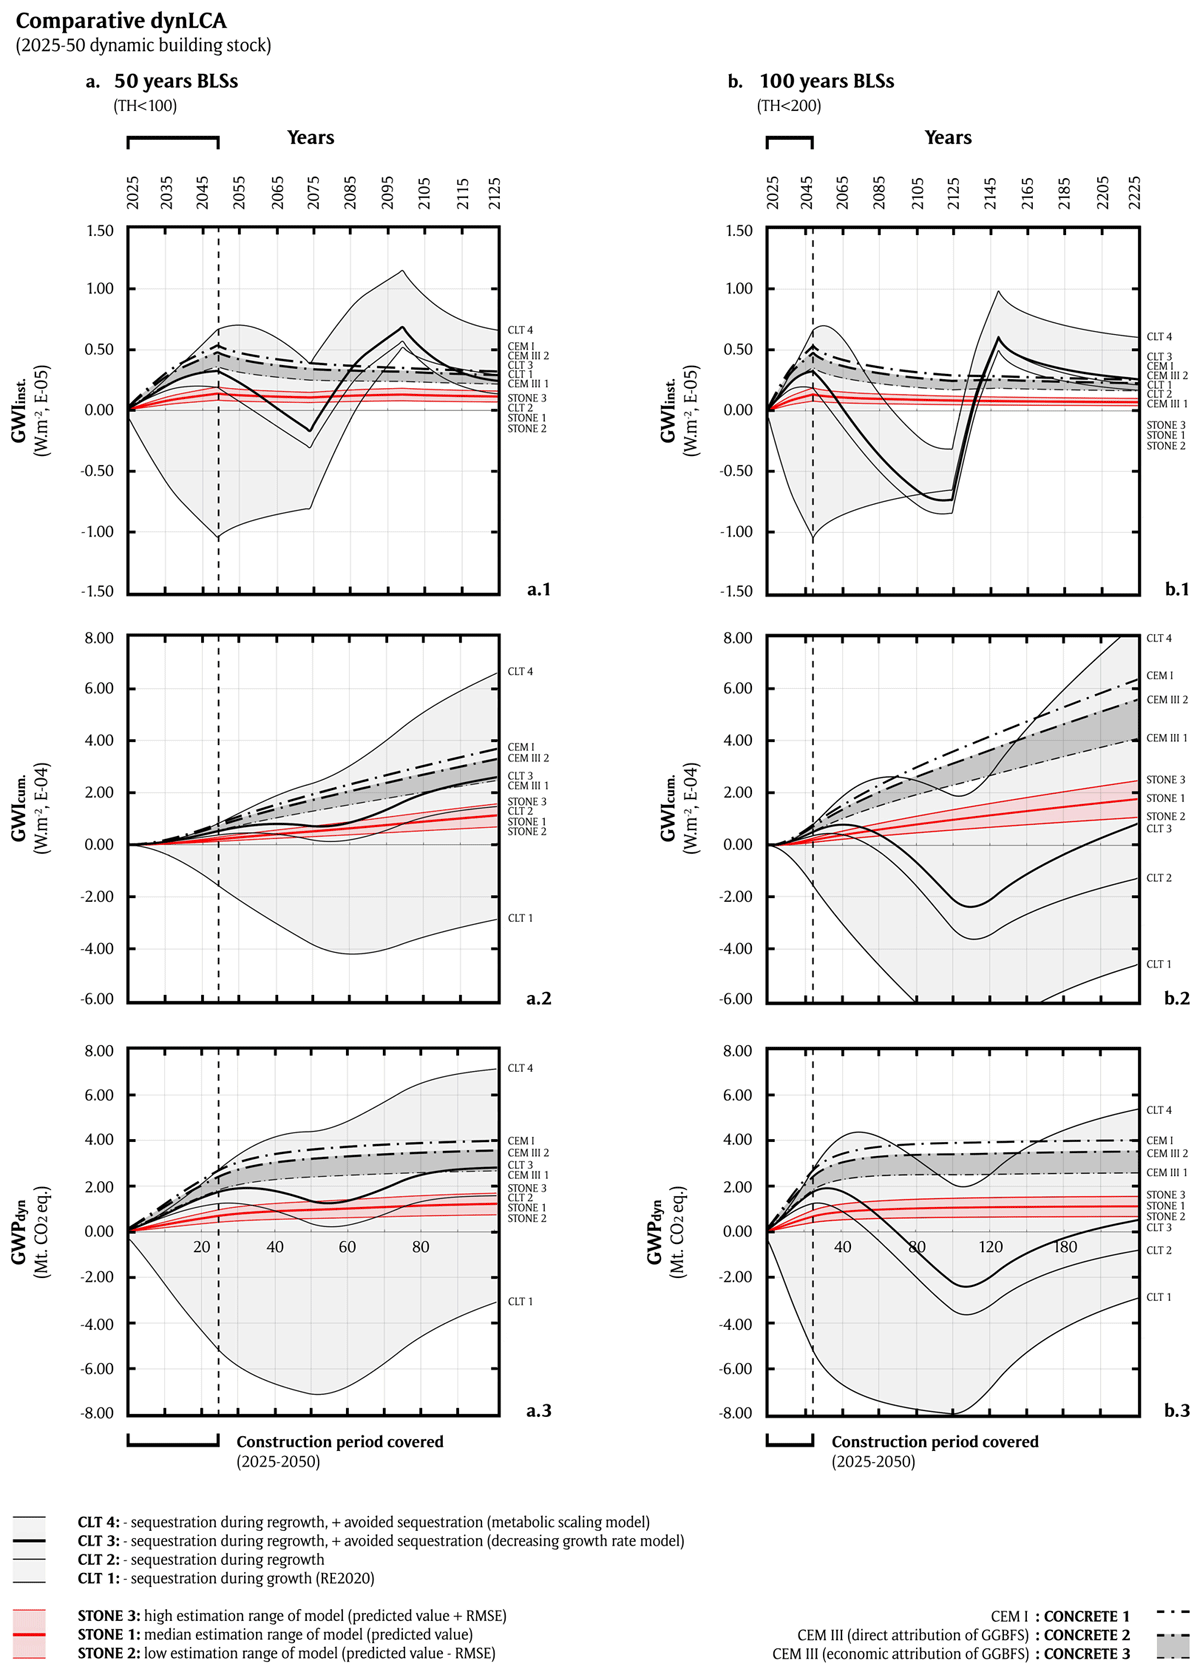
Figure 11
Building stock level analysis, assuming the implementation of considered alternatives on 30% of new collective housing projects over the 2025–50 period: (a) 50-year building life spans (BLSs); and (b) 100-year BLS. Instantaneous and cumulative global warming impact is shown in the first and second series, dynamic global warming potential (GWP) is shown in the third series.