
Glossary
| BLS | Building life span |
| CLT | Cross-laminated timber |
| DCFs | Dynamic characterisation factors |
| DWC | Dynamic weighting coefficients |
| EPD | Environmental product declaration |
| GGBFS | Ground granulated blast furnace slag |
| GHG | Greenhouse gas |
| GWP | Global warming potential |
| HWP | Harvested wood product |
| LCI | Life cycle inventory |
| LCA | Life cycle assessment |
| RE2020 | Règlementation Environnementale 2020 (French 2020 Environmental Regulation) |
| SNBC | Stratégie Nationale Bas Carbone (French National Low Carbon Strategy) |
| TH | Time horizon of GWP analysis |
1. Introduction
The French building and construction sector is currently responsible for a third of the country’s greenhouse gas (GHG) emissions, i.e. 91 Mt CO2e (MTES 2020). The French National Low-Carbon Strategy (Stratégie Nationale Bas-Carbone—SNBC; MTES 2020), the purpose of which is to transcribe France’s commitments to international and European climate initiatives (e.g. the Paris Agreements; European Union (EU) Climate and Energy Package; EU 2050 Climate Roadmap) into national-level sectoral carbon budgets, aims to minimise the contribution of France (and France’s buildings) to global climate change.
With a virtually decarbonised electricity mix (RTE 2020), and recently introduced building environmental standards imposing disincentives on fossil fuel-based heating—Environmental Regulation 2020 decree (RE2020), which is the building-sector legislative application of the aforementioned SNBC)—operational and embodied emissions of the French building stock are spread unevenly: existing buildings (fossil fuel heated) account for virtually all the current and future operational emissions, while the material demand for new constructions cumulates virtually all current and future embodied emissions.
In the absence of robust policies for the revitalisation of decentralised territories with high vacancy rates (INSEE 2020), and amid multiple proactive housing policies (Légifrance 2013a, 2013b; MCTRCT 2014), new housing developments will likely remain common practice in upcoming years, with average projections of 4 million new housing units built by 2050 (ADEME 2021b). Additionally, it remains difficult for real-estate developers to transition entirely from new construction towards retrofitting ventures due to their inherently divergent financial constraints (i.e. high-risk upfront investment versus low-risk unilateral selling options for retrofitting versus new construction activities, respectively). Thus, reducing the Scope 3 impact (i.e. embodied GHG emissions by construction materials) of new construction activities remains the primary accessible low-carbon strategy for the building and construction sector.
By introducing gradually decreasing caps on the embodied emissions of new constructions, the RE2020 promotes the rapid growth of the low-carbon material industry. However, the global warming potential (GWP) used to assess carbon efficiency relies on models (i.e. parametrisation of underlying process dynamics, such as carbon sequestration of biomass) that require selection among various allocation alternatives (Levasseur et al. 2013) and pertain to conventions. Unlike metrics (pertaining to facts), such models inherently lack neutrality (Meinshausen & Nicholls 2022).
Initial press releases by the French Ministry of Ecological Transition (MTE) (2021) indicated that the government wanted to encourage the use of natural stone with the RE2020, which imposed environmental and thermal requirements supposedly fully met by cut-stone assemblies (Pestre 2021). However, unlike the bioconstruction and low-carbon concrete industries, which benefit from advantageous GWP allocation conventions (DHUP 2022; RE2020 2021) and public subsidies (ADEME 2021a; MTECT 2020, 2021b), the intent has in fine not materialised into the political will required to scale-up an industry currently operating in idle.
Consequentially, a systemic framework for quantifying the carbon benefits of cut-stone has largely remained absent from academic research and public proceedings. In the context of climate urgency, rapidly evolving regulations and renewed interest in increasingly relevant massive building typologies (as opposed to light inertias), this study aims to fill this gap.
2. Background and literature review
By compelling a tripartite consideration of the carbon impact (both embodied and operational), interior comfort (cooling degree-hours, with light inertias unable to provide safe interior environments during increasingly severe and frequent heat waves; Mitchell & Natarajan 2019; Wang et al. 2021), and the energy efficiency of buildings, the recently introduced RE2020 has triggered a renewal of interest for the use of high-inertia natural materials such as cut-stone.
When comprehensively integrated into building assemblies, cut-stone acts as a multifunctional material, having structural, hygric, thermal, acoustic and visual functions, allowing a simple cut-stone load-bearing wall to fulfil functions typically assumed by many products and subsystems in lighter building assemblies, such as structural elements, air-conditioning systems, anti-vapor and airtightness membranes, and interior and exterior finish materials. In light of RE2020 requirements, the benefits linked to its use include:
Reduced embodied carbon impact of the material assembly, because stones are materials as opposed to products, so are neither manufactured, synthesised nor consumed, merely quarried, displaced and used.
Increased comfort and reduced operational carbon impact during the summer, owing to the ability of high thermal masses to passively cool interior spaces and trigger stack-driven ventilation flows that both decrease reliance on energy-intensive air-conditioning systems (de Toldi et al. 2022), as compared with light-inertia buildings, which are subject to overheating and require mechanical cooling.
A strong substitution effect both in the construction (dry and low-emission construction worksite, radical integration of material assembly) and reconstruction phases (low maintenance requirements (Ioannidou 2016) and increased durability (Mequignon et al. 2013) precluding deconstruction and reconstruction activities, and high recovery potential limiting the impact of deconstruction activities, if any (INSITU 2022)).
Considerable volumes of dimension stone are annually quarried on a global basis (35 million tons), and production by the French sector falls far behind those by corresponding sectors in China, Italy, Turkey, India, Brazil, Spain and Greece (Gussoni 2017). However, globally targeted markets are predominantly those of ornamental rocks; easily transported, often exported, and requiring surface-treated high-density thin products implemented as carbon-intensive aesthetic cladding assemblies (Bianco & Blengini 2019). As such, the French stone sector differentiates itself from others in two distinct ways, both of which are significant to low-carbon building design.
First, the wide availability and even distribution of accessible soft limestone deposits and the numerous ensuing dimension stone quarries (216 quarries; BRGM 2022) would allow negligible investment in terms of energy, money and time for the exploitation, transformation, transport, implementation and maintenance of cut-stone (or massive stone, which is thick stone blocks of large dimensions used as structural materials) within the French building stock (Loyer 1987), with the capacity to establish an independent domestic market. The French construction industry thus distinguishes itself from global counterparts by its ability to effectively capitalise on the environmental advantages of using locally sourced cut-stones (i.e. reduced transport distances), of light-densities (i.e. reduced mechanical cutting time) and large dimensions (i.e. increased durability, absence of surface treatments, reduced cutting surfaces and decreased rejection rates owing to the minor importance of visual impurities for stones whose primary use is not aesthetic; Ioannidou et al. 2014), the benefits of which are later detailed in subsection 4.1.
Second, the French building industry could capitalise on the experience acquired during the 1948–63 reconstruction period, during which numerous buildings were built using load-bearing cut-stone (Zerbi 2011) as part of the 1948 Equipment and Mechanisation of Quarries for the Mass Production, Transport and Distribution of Standardised Pre-Cut-stone directive (a historical account of the French cut-stone sector is provided in Appendix 1.1 in the supplemental data online). Exploiting this historical experience, members of the construction industry could stake transitioning roadmaps on the demonstrated ability of the cut-stone sector to take up challenges potentially imposed on it, both quantitatively (more than 50,000 cut-stone housing units were built during the period) and qualitatively (the remarkable condition of the buildings, currently still in use; Zerbi 2011).
The widespread use of cut-stones is currently restrained by their unavailability on the French market. For illustration, the extraction rate of a single quarry (Fontveille) during the reconstruction period was 10,000 m3/month, which is close to the current national rate of 14,000 m3/month (Delemontey 2007b), due to a gradual loss of political support over the reconstruction period in favour of the then-praised and newly introduced heavy reinforced concrete prefabricated assemblies (Delemontey 2007a).
Nonetheless, imperatives have now changed, and then-excluded considerations, such as (1) climate adaptation and mitigation design challenges of the construction sector (i.e. how to integrate as many functions as possible into primary materials selected for maximum durability and minimal environmental impact); (2) sociocultural sustainability targets at the national and community levels (i.e. short supply chains, decentralised structures, (re)emergence of regional identities, etc.); and (3) industrial ecology roadmaps (i.e. closed-loop material cycling, potential for widespread application, a low necessity for infrastructure investment, etc.), could now place cut-stone building systems at the forefront of low-carbon roadmaps for the transition of the construction sector.
However, stone production chains are not homogeneous industrial processes (processes vary according to stone characteristics) as is the case with material alternatives such as concretes. Accordingly, life cycle assessment (LCA) datasets for dimension stone industries worldwide remain undeveloped, so a thorough investigation of the environmental relevance of the widespread use of cut-stone elements as substitute materials, which largely depend on such datasets, is currently impossible. Nevertheless, isolated studies have provided some fragmented insight into the carbon impact of cut-stone building design. Such studies are mainly divisible into those based on evaluation at the quarry level and those based on evaluation at the material level.
At the quarry level, representative life cycle inventory (LCI) datasets have been gathered for several settings, including the US (UT 2009), the UK (Crishna et al. 2011), Brazil (Gadioli et al. 2012) and Italy (Bianco & Blengini 2019), revealing that fossil-fuel use during the quarrying, cutting and finishing phases are the major contributors to their primary impact. While several sectoral sustainability aspects were addressed in these studies, systemic studies were prevented because LCI datasets are typically context specific and therefore inapplicable to other supply chains.
At the material level, studies have mostly focused on the analysis of thin product assemblies, such as the quarry gate impact of tiles and cladding (Mendoza et al. 2012, 2014; Nicoletti et al. 2002; Traverso et al. 2010), showing sawing phases to be the main GWP contributors, resulting in thinner products having higher impacts on a unit mass basis.
Two notable exceptions focusing on the building level must nevertheless be cited. The earlier study by Ioannidou et al. (2014) provided comparative analyses of three stone wall systems of varying thicknesses (6–50 cm), showing the environmental impact of thicker assemblies to be a third as impactful on a m2 basis, affirming previous findings. The second, more recent, by Pestre (2021) aggregated cradle-to-grave LCAs of representative samples of French limestone masonry elements, highlighting the hierarchy of impacts of major flows and life cycle stages.
As such, there is no comprehensive national-scale systemic evaluation framework for (1) assessing the environmental impact of configurable stone assemblies and (2) enabling fair comparative analyses.
Accordingly, this study consisted of a three-step process. First, a model for systemically evaluating the embodied carbon impact of cut-stones within the French context was developed and validated. The model was then used to benchmark the environmental impact of cut-stone load-bearing walls against the most considered low-carbon alternatives within the French market, i.e. harvested wood products (HWPs) and ground granulated blast furnace slag (GGBFS) concretes. Finally, the analysis is expanded to the level of projected building stock dynamics to explore the comparative benefits of industrial applications.
3. Methods
The following subsections consist of detailed accounts of (1) the dynamic life cycle analysis methodology adopted; (2) the cut-stone carbon impact model developed in the present study; the exhaustive embodied carbon impact accounting methodologies considered for comparative analysis of (3) HWPs and (4) concretes; (5) the functional unit adopted for the comparative analysis; and (6) the building stock dynamics used to expand the analysis at the level of the parc.
As the comparability of environmental product declarations (EPDs) depends on the completeness and reliability of the declarations (Moré et al. 2022b), comparative analyses have typically relied on quantitative assessments of underlying data specificity to estimate the uncertainty ranges associated with individually taken EPDs (Waldman et al. 2020). However, the exclusively French EPDs (standardised compiling and validating methodology) used to derive subsequently used models fall under the ETLL1515423A legislative standard for independent third-party verification of EPDs (Gouvernment Français 2015), purportedly ensuring both underlying completeness and adequate specificity (tolerance range of up to 35% GWP variations for products affiliation to collective EPDs; NF EN 15804/CN; CEN 2016). While adherence to specific standards has been demonstrated to be fallible in ensuring comparability (Moré et al. 2022a), individual assessment of data uncertainty underlying each EPD employed is beyond the scope of this study. Instead, taking into account that GWP estimates provided by French EPDs rely on models selected by public authorities among multiple allocation alternatives for parametrising the underlying process dynamics (such as biomass carbon sequestration), this study provides evaluations of data uncertainty by comprehensively considering such allocation alternatives.
All LCA dataset inputs subsequently used are allocated in compliance with the NF EN 15804+A1 (CEN 2014a) standard according to which life cycle stages are described. Aligning with French, European and international standards, all carbon emission factors are provided in kg CO2e (IPCC 2021).
Cradle-to-grave life cycle stages are included for all materials (i.e. A1–C4). Life cycle stage D (i.e. potential benefits and loads beyond system boundaries) is discarded to prevent avoided emissions (substitution effect) from biasing the results expressed in absolute terms.
Detailed accounts of the subsequently presented methodology are provided in Appendices 1 and 2 in the supplemental data online.
3.1 Dynamic life cycle analysis (LCA)
To comply with recommendations by experts in the field (Levasseur et al. 2010, 2013), French regulations RE2020 LCA methodology, and likely upcoming European legislation (Ventura 2022), a dynamic LCA (dynLCA) approach was adopted.
The objective of this approach, which is increasingly sought after, is to lessen the critical lack of time dependence in traditional static LCAs by allowing consideration of the timing of emissions during the life cycle of a building. With a fixed time horizon (TH) of analysis (100 years for the most used GWP100 unit), static LCAs (i.e. the sum of GWP100 values of all emissions listed in the life cycle inventory of a product) effectively present inconsistencies between the chosen TH and the period covered by the results. The GWP100 of emissions occurring 50 years after construction (e.g. end-of-life emissions) will, for instance, account for years 50–150 after construction. To remain consistent with chosen time boundaries, yearly GHG emissions (kgGHG) reported in the life cycle inventory of a product are weighted within the dynLCA method via instantaneous dynamic characterisation factors (DCFs) derived for any GHG and emission timing relative to the TH of the analysis (Levasseur et al. 2010, 2013). However, typical EPDs lack differentiated life cycle emission inventory data, providing GWP100 values (kg CO2e) for each life cycle stage instead of yearly absolute emissions (kgGHG), which precludes the use of standard dynLCA methodologies. To address this problem without making current EPD databases obsoletes, the RE2020 LCA methodology derives dynamic weighting coefficients (DWCs) from the residual atmospheric load following a pulse emission of 1 kg CO2 given by the Bern carbon cycle model and directly applies them to GWP100 values listed in life cycle inventories of EPDs (reasonably assuming CO2 to be the main GHG constituent of embodied emissions for construction materials). As such, the total GWP of a product is weighted relative to the timing of each emission listed in the inventory.
As the RE2020 operates within statutory 50-year building life spans (BLSs) and a TH of 100 years, the decree only provides DWCs for GWP100 factors and emissions taking place within the boundaries of LCI years 1–50. To allow sensitivity analyses both in terms of temporal boundaries and BLS, DWCs are derived for all analysis THs and LCI years (i), repeating equations (1) to (5) for a 1 kg CO2 pulse emission incrementally applied to all inventory annual entries:
where DCF(t) is the dynamic characterisation factor used to assess CO2 absorption that occurred t years before (W/year/m2); is the instantaneous radiative forcing per unit mass of CO2 increase in the atmosphere (W/m2/kg); is the atmospheric load of CO2 t years after the emission (kg); is the inventory entry for year i; GWIinst(t) is the instantaneous global warming impact occurring at a given time t; GWIcum(t) is the cumulative global warming impact; and GWPTH is the global warming potential at a given TH (i.e. traditional LCA unit; kg CO2e) obtained by dividing the cumulative impact on global warming for this TH by the cumulative radiative forcing of a 1 kg CO2 pulse emission occurring at time zero. Equations (1) to (3) were computed using the DynCO2 Excel-sheet tool (CIRAIG 2013).
For clarity, Figure 1 illustrates the outcomes of the methodology for a 100-year analysis TH, with Figure 1(a) showing the cumulative radiative forcing of a pulse emission of 1 kg CO2 in LCI year 1 according to the Bern carbon-cycle model, and Figure 1(b) showing the correlation between the timing of the emission and associated DWCs. The GWP100 of an emission happening in LCI year 50 should, for instance, be weighted by a factor of 0.578 (i.e. 57.80%) in the LCA of a product given in a GWP100 format, while emissions happening in LCI year 1 or 100 would respectively be fully considered (i.e. 100%) and fully discarded (i.e. 0%).
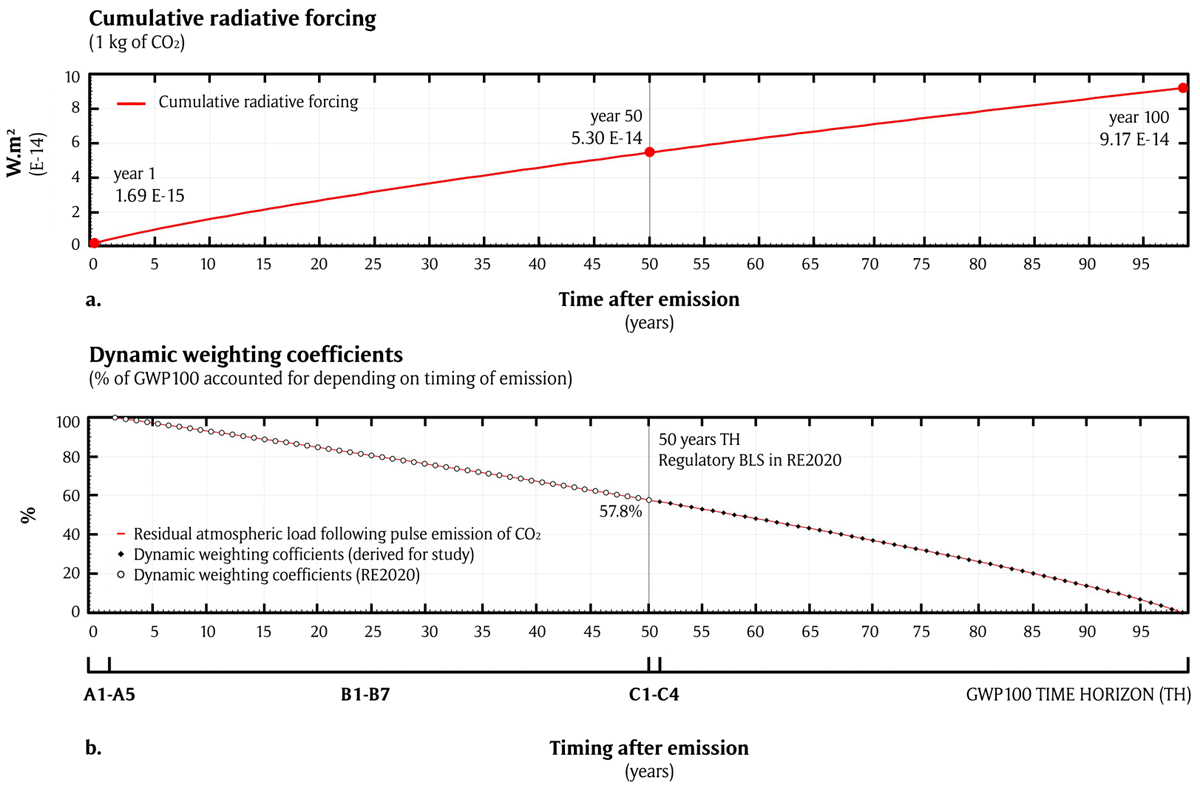
Figure 1
Atmospheric load following pulse emission of CO2 (a) and derived dynamic weighting coefficients (DWC) (b), shown for a time horizon of analysis of 100 years.
The LCI data for all subsequently considered materials were thus weighted with DWCs relative to the TH considered.
3.2 Cut-stones
LCI data for cut-stones are derived from all EPDs available to date on the French market and cradle-to-grave data compiled by contributors of the study (Pestre 2021) over the 2017–18 period as part of PhD field research, verified according to ISO 14025 (ISO 2020) and ISO 21930 (ISO 2023) (following NF EN 15804 recommendations) and examined by reviewers (Pestre 2021). All EPDs and datasets were further characterised by their density (kg/m3), thickness (m) and surface density (kg/m2). All datasets used in this section were configured in compliance with the NF EN 15804+A1 standard (note that industry feedback currently shows cut-stone GWP variations of less than 2% between NF EN 15804+A1 and +A2 standards; CEN 2019). Selected stages were revised to provide representative averages of the French stone quarrying and construction sector—which is analogous to certified EPD configurators for alternative materials later detailed (BETie 2022b; DE-Bois 2022a)—according to the following harmonising assumptions:
A2 (product stages—transport to manufacturing site): median weighted value adopted for all datasets (function of surface density).
A4 (construction process stages—transport to the building site): geological Geographic Information System (GIS) data were extracted from the Geological and Mining Research Bureau (BRGM) (2022) data platform to estimate national area coverage as a function of distance from potential quarries (cf. Figure 2). Limestone and sandstone quarries were considered (i.e. those most commonly employed in the construction sector), both active and closed (216 and 68 quarries, respectively), as both are assumed representative of the extraction potential of a given region. A conservative national average distance of 60 km was adopted, corresponding to an 85.3% national area coverage, comprising 92.3% of cities that have over 100,000 inhabitants. Truck loading rates were assumed to be 90%, with 30% empty return rates, corresponding to the latest observations showing heavy masonry transport to quickly reach maximum authorised loads (MEDDE & ADEME 2022), and aligning with the latest validated heavy masonry EPDs (CTMNC 2022) adapted from Ecoinvent allocations (MTECT 2021a; Wernet et al. 2021).
A5 (construction process stages—installation into the building): inclusion of mortar, binding agents and secondary components (if any). Median weighted value adopted for all datasets (function of surface density), differentiating thin (< 20 cm) from thicker (> 20 cm) assemblies, as thin products are more likely to be installed with metal fasteners or more adhesive mortars than heavy masonry.
B2 (use stages—maintenance): median weighted value (a function of surface density) adopted for all datasets (air-gumming every 50 years with an electric compressor may be required for aesthetic purposes only).
C2 (end-of-life stages—transport to waste processing): average national transport distances of 60 km assumed (Figure 2a, b), with a partial raw material return to quarries for rehabilitation (see article R.515-3, Environmental Code 2023) and a partial return to the manufacturing site for size adjustments before reuse.
C4 (end-of-life stages—disposal): 7.4% of landfill (i.e. industry average; MEEM 2017), and the rest considered without impact except for transport allocated to C2.
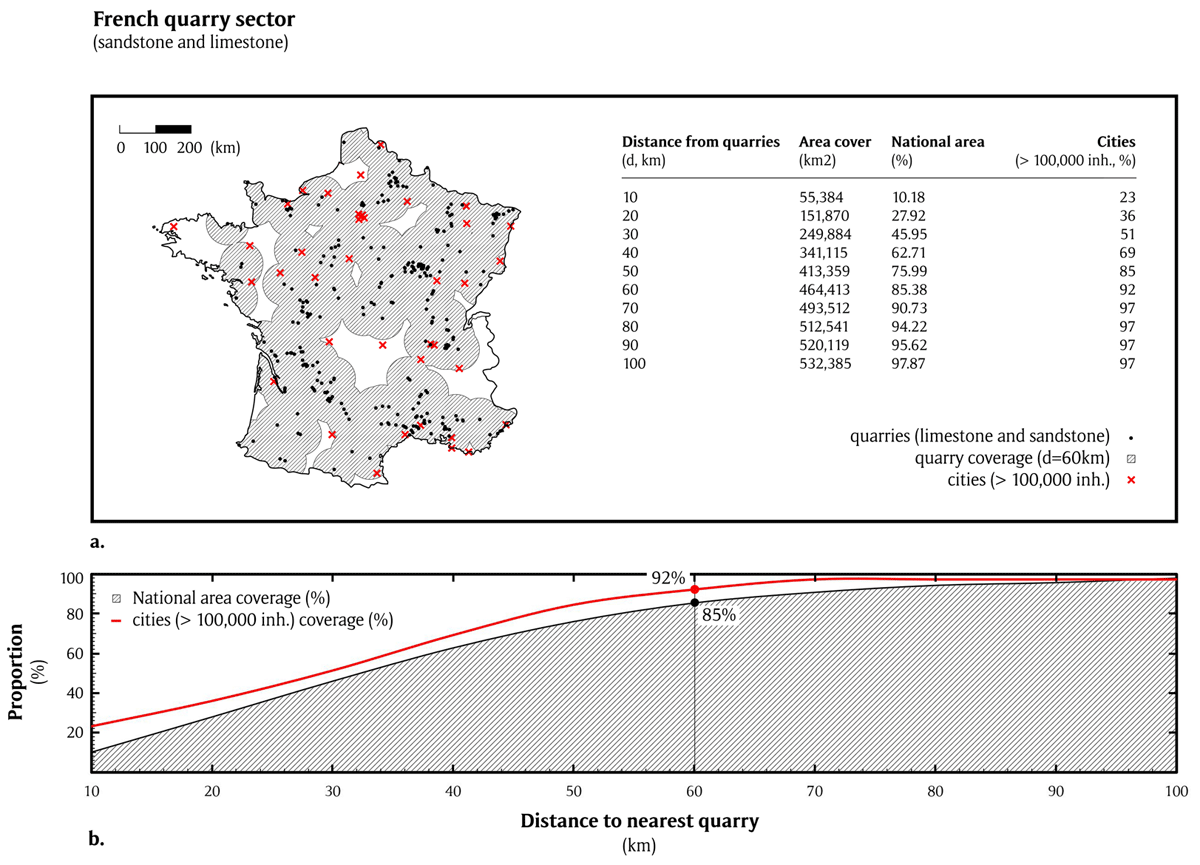
Figure 2
National area coverage versus transport distances from quarries (i.e. A4 construction process stage) for France (a 60 km radius shown in (a)).
LCIs compiled for cut-stones (outlined in Appendix 2.1 in the supplemental data online) were then used to derive a dynamic model (see equation 1) for the volumetric carbon impact of cut-stone, providing GWP magnitudes for any TH (GWPTH, in kg CO2e/kg) as a function of cut-stone-product thickness (n, in m):
Subsequent works replicating the methodology should update the dataset with EPDs released after the completion of this study.
3.3 HWPs
LCIs for HWPs were derived from EPD configurable data certified by the MTE as representative of CLT panels manufactured in France in conformity with the NF EN 16351 standard (CEN 2021; DE-Bois 2022b; INIES 2022b), with industry-average contents of 84% and 16% of the mass, respectively, sourced from French and Scandinavian softwood forests. Four distinct methodologies were subsequently used to dynamically allocate the inventory data.
Following the RE2020 LCA methodology (RE2020 2021), the first scenario (hereafter referred to as CLT1) considers the sequestration of carbon to take place during the growth of the biomass (i.e. before the tree cut) and is allocated as a negative instantaneous pulse emission in LCI year 0.
By fully accounting for the year 0 sequestration and only partially accounting for year 50 end-of-life emissions (i.e. incineration, returning sequestered carbon to the atmosphere), DWCs specified by the RE2020 LCA methodology (also adapted from Levasseur et al. 2010, 2013) effectively turn biogenic products into carbon-negative commodities. Initially prescribed by the government to swiftly transition away from carbon-intensive cementitious materials by increasing demand for bio-based products (MTE 2020; MTES 2020; RE2020 2021), this sequestration allocation method nevertheless overlooks unsettled concerns by:
clouding the nuanced short-term benefits of transferring carbon from one pool (forest) to another (building stock) (Arehart et al. 2021; Göswein et al. 2022; Hawkins et al. 2021)
assigning a lower priority to complex risk assessments with reported trade-offs (notably in terms of biodiversity loss) from increasing demand for HWPs in the European market (Ceccherini et al. 2020; EFSOS 2011; Luyssaert et al. 2018)
decoupling drivers for demand (i.e. RE2020 incentives) from projected national harvesting capacity (halving of the sequestration capacity of French forests between 2010 and 2022 due to the expansion of bio-aggressors and increased fire, hydric and climate stress (CITEPA 2022)), and decoupling drivers for imports from strong governance and careful planning required to ensure sustainable harvesting rates, i.e. longer rotation periods, and afforestation (EFSOS 2011; Mishra et al. 2022) within the framework of an increasing vulnerability of European forestry ecosystems to climate change (Au et al. 2022; Lindner et al. 2010)
preventing differentiation of slow- versus fast-rotation biomass-based products and their respective climate disadvantages and benefits (Cherubini et al. 2011; Göswein et al. 2021; Guest et al. 2013; Levasseur et al. 2013; Pittau et al. 2018)
neglecting reported uncertainties about sequestration dynamics at the individual tree scale (Calders et al. 2022; Mikoláš et al. 2021), showing rates of above-ground carbon accumulation increasing continuously with tree size (Stephenson et al. 2014), demonstrating the disproportionately important role of older trees in forest mass growth, and pointing to the overlooked effect of the avoided sequestration potential of managed forests prevented from attaining older ages (Franklin et al. 2002; Grantham et al. 2020; Moomaw et al. 2019).
To address some of these shortcomings and foster precaution, an alternate methodology was developed by Levasseur et al. (2013) for the case of sustainable forest management practices (as is assumed with CLT products considered here; DE-Bois 2022a; NF EN 2014), advocating for the dynamic (i.e. diffuse) allocation of sequestration intakes after the harvest during the regrowth of the tree (i.e. stemming from the assumption that a harvested tree entails an imminently replanted one). This allocation methodology, which was applied in subsequent studies (Göswein et al. 2021; Hawkins et al. 2021; Levasseur et al. 2013; Peñaloza et al. 2016; Pittau et al. 2018), is thus considered for a second scenario (referred to as CLT2). Detailed accounts of the considered rotation period, carbon fraction of dry biomass, and growth rate and allometric equations for French Norway spruce (Picea abies; 96% of total CLT mass in used CLT EPD configurator) are shown in Appendix 1.2 in the supplemental data online.
Avoided sequestration of the cut tree is systematically discarded from the GWP of HWPs, either stemming from the assumption that sequestration rates of the replanted tree quickly surpass that of the harvested one, or that trees have been planted with the incentive of using them as building wood products. In the context of climate urgency and growing pressures on forest resources, avoided sequestration should ultimately be considered to provide a comprehensive perspective on the short TH climate impact of harvesting activities and allow fair inter-material comparative assessments. The second allocation scenario (CLT2) is thus further supplemented with avoided sequestration dynamics, resulting in two additional scenarios (hereafter referred to as CLT3 and CLT4) where avoided sequestration is accounted for until the yearly sequestration rates of the replanted tree surpass that of the cut tree had the latter not been cut (i.e. until the replanted tree provides net climate benefits). As uncertainties about Norway Spruce growth rate dynamics remain, two distinct models were used.
The first high-probability scenario (CLT3) considers a standard growth rate model (Figure 3b) (Albers et al. 2019; Vallet et al. 2006) with sequestration rates decreasing with tree size. A second lower-probability scenario, CLT4 (i.e. a model representative of growth in the absence of competition) (Figure 3a) considers a metabolic scaling model (Stephenson et al. 2014) where growth rates increase continuously with tree size. Both models are fitted to account for 443 kg of dry mass (corresponding to the biogenic material mass in 1 m3 of CLT as detailed in underlying EPD data) at LCI year 82 (i.e. the assumed forest rotation period; Eriksson et al. 2007; Seely et al. 2002). As the metabolic scaling model does not account for a maximum tree dry mass, the latter is capped to a final dry mass equivalent to that of the standard model (700 kg, reached in LCI year 104 and 200 of the metabolic and standard and models, respectively).
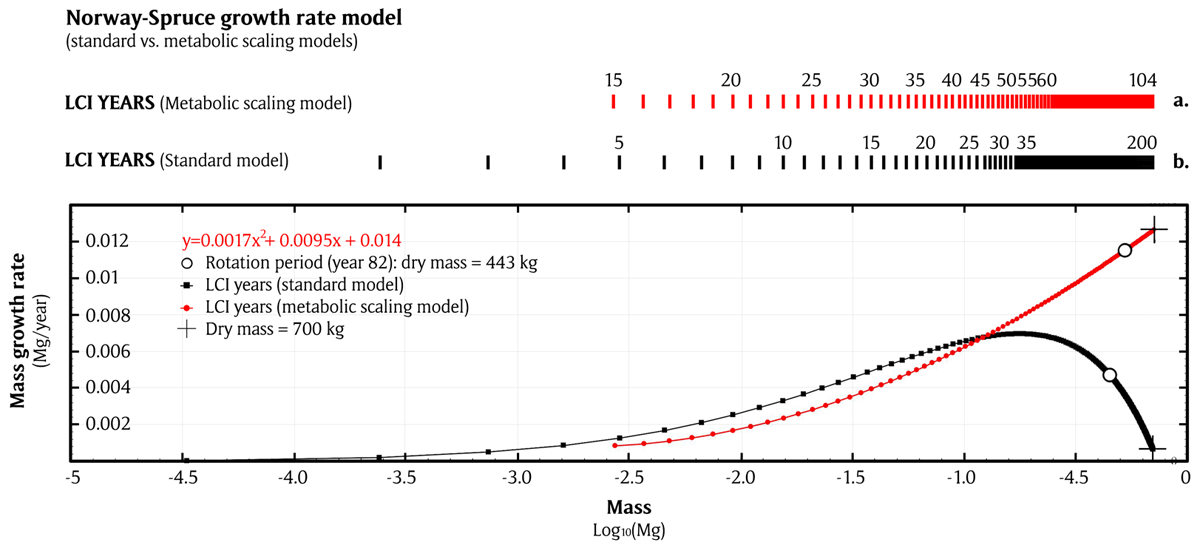
Figure 3
Differing growth rate models for Norway spruce (i.e. Picea abies): standard scaling model showing decreasing growth rate with tree size versus metabolic scaling model showing increasing growth rate with tree size.
The dynamic life cycle inventories compiled for HWPs are outlined in Appendix 2.2 in the supplemental data online.
3.4 Concretes
LCIs for concretes were derived from EPD configurable data certified by the Ministry of Ecological Transition as compliant with NF EN-206/CN standard (CEN 2014b; BETie 2022a, 2022b; INIES 2022b). Concrete classifications and exposure classes are described according to the NF EN 197-1 (CEN 2012) and NF EN 206/CN standards. Two specific concrete types were considered as representative of conventional (100% clinker content—the reference scenario) and low-carbon (35–64% clinker substitution by GGBFS) load-bearing (20–25 MPa) reinforced concrete elements (i.e. C20 XC1 CEM I and C20 XC1 CEMIII/A, respectively). A total of 50 kg/m3 of reinforcing bars are assumed in each case, which follows industry averages (BETie 2022a, 2022b). A conservative value of 30 km, the national average (Guiraud 2018), was considered for the transport distance from the plant to the building construction site (life cycle stage A4).
As a co-product of the iron and steel industry, the allocation method of GGBFS emissions falls under the specifications of the NF EN 15804/+A1 standard for derivatives, subject to interpretation and enabling either mass, economic, physical or energetic attribution. Two alternative allocation methodologies were considered, resulting in two distinct low-carbon concrete scenarios.
Complying with the RE2020 LCA methodology and a recent arbitrage by the Directorate of Housing, Urban Planning and Landscapes (DHUP) (2022), a first low-carbon concrete scenario (hereafter referred to as CEM III 1) assumes the currently statutory economic allocation of 1.40%, resulting in a GGBFS emission factor of 0.083 kg CO2e/kgGGBFS (DHUP 2022) (detailed accounts of average European market prices, mass correlation factors and emission factors are shown in Appendix 1.3 in the supplemental data online).
As economic allocations index the environmental impact of processes to their financial worth at the macroeconomic level with little correspondence to their ecological reality, international LCA standards (ISO 14044; ISO 2022) warn about the shortcomings of such procedures and advise, when feasible, to systematically adopt natural-science-based approaches (privileging direct or mass allocation solutions, in that order). Using empirical data from 30 blast furnaces of the ArcelorMittal group, a direct allocation for GGBFS was derived by Buttiens et al. (2016) using a differential approach, and evaluated at 0.55 kg CO2e/kgGGBFS (standard deviation (SD) = 0.018 kg CO2e/kgGGBFS, i.e. ±3%). This benchmark value, close to a mass allocation (i.e. 0.35 kg CO2e/kgGGBFS), is thus used for a second low-carbon concrete scenario (CEM III 2).
Adopted carbonation kinetics are detailed in Appendix 1.3 in the supplemental data online, and dynamic LCIs compiled for all considered scenarios are listed in Appendix 2.2 online.
3.5 Functional unit
The functional unit used for the comparative analysis (Figure 4) consists of a 1 m2 load-bearing wall (whether interior or peripheral). As typically implemented characteristics depend on product specificities offered by the industry (i.e. required properties rounded up to the closest performing available product) more than absolute required functionalities (i.e. exact required properties targeted), this study adopted a practice-based (as opposed to performance-based) functional unit.
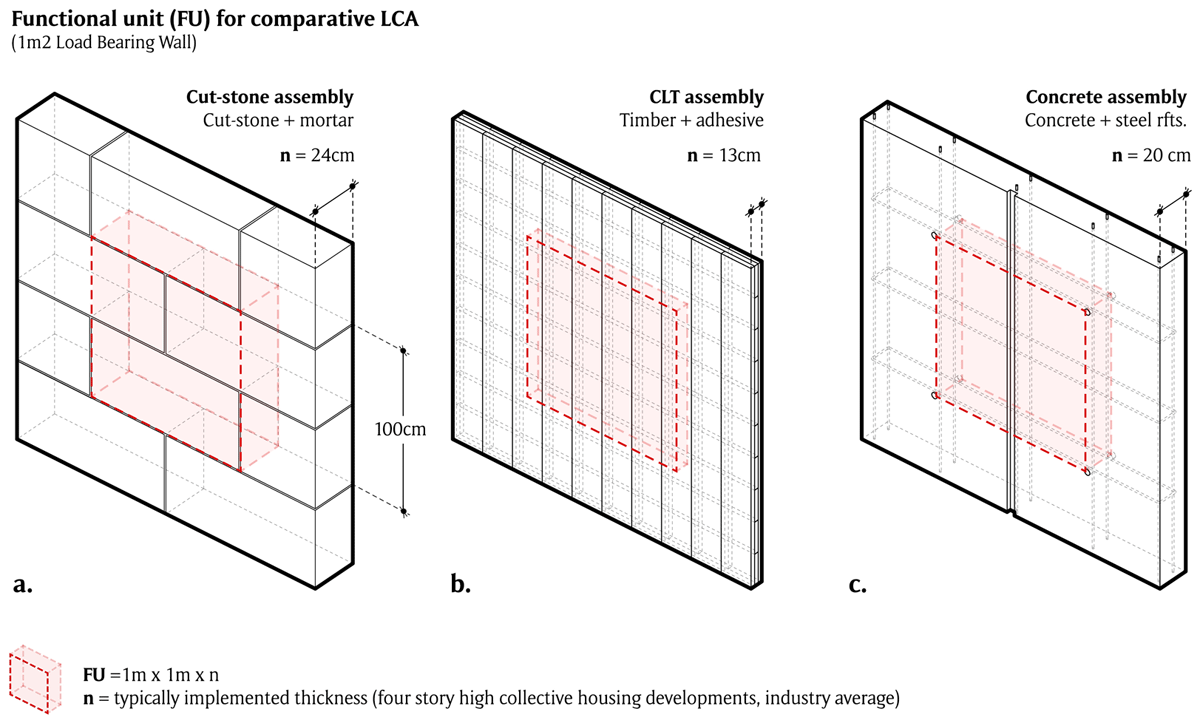
Figure 4
Comparative life cycle assessment (LCA) functional unit of 1 m2, with varying thicknesses (industry averages for considered building heights), shown for natural cut-stones (a), harvested wood products (HWPs) (i.e. cross-laminated timber (CLT) in (b)) and concretes (c).
Practice-based characteristics (here typically implemented thicknesses) were derived in a two-step process. First, archetype-based data were derived from the statistical analysis of 1.2 million housing units constructed in France over the period 2013–22, with data retrieved from the Sitadel2 database (Sitadel2 2022). Average collective housing building heights above ground level are shown to be 3.5 ± 1.76 stories (SD). Collective housing projects currently represent 74% of new developments owing to strong government commitment to halt urban sprawling (Légifrance 2021) and were thus assumed representative of dominant practices. Average building heights were then cross-referenced with correlated industry-average load-bearing wall thicknesses, amounting to 13 cm for CLT (BBG 2020; Egoin 2018; KLH 2013), 20 cm for concrete (2–3 m-high wall average thickness; CIMbéton 2013) and 24 cm for cut-stone (Pestre 2021)—all exhibiting compressive strengths greater than the design loads anticipated for the considered building type.1
Foundation design and the correlated embodied carbon are (1) relatively independent from variation in load-bearing wall surface density (e.g. estimated 7.5% variation range of foundation concrete volume for all considered assemblies, assuming French archetypal collective housing building characteristics, and Eurocode 7 section 6 requirements for strip footing design); (2) highly dependent on soil properties (Eurocode 7); and (3) effectively discarded from LCA system boundaries within the new French building code RE2020 LCA methodology (i.e. capping of below-ground carbon impact). As such, the functional unit discards the relative impacts of the various wall systems on the foundations.
Unlike interior partitions, peripheral walls are submitted to insulation requirements. In the latter case, the difference in thermal resistance between the different materials and considered wall thicknesses would be relatively insignificant with respect to that required to comply with the RE2020. Average R-values for 13 cm CLT and 24 cm stone (1.08 and 0.27 m2.K/W, respectively, against the 6.5 indicated to satisfy RE2020 requirements) would, for instance, result in a change in insulation thickness of 2.7 cm (18.3 and 21.0 cm required for CLT and stone, respectively2), for an average insulation product thicknesses of 9.1 cm on the French market (INIES 2022a). As such, the impact of differing thermal resistance on the functional unit is also discarded.
As all considered assemblies comply with average acoustic insulation requirements of 30dB (Légifrance 1999)—i.e. mass law approximations of 36, 58 and 56 dB insulation for CLT, concrete and cut-stone considered thicknesses, respectively (Li & Ren 2011)—the impact of sound performance is discarded from the functional unit.
As implemented wall thicknesses may vary according to project-specific construction methods and technical requirements, the results presented hereafter (i.e. Figure 8) show the embodied impact as a function of wall thickness, with a marker to distinguish the specific thickness considered in the functional unit, making it possible to compare different scenarios.
The 1 m2 unit was then scaled up to the level of French building parc dynamics using the approach outlined in the subsequent section.
3.6 Building stock model
The state-of-the-art French dynamic building stock model developed by Blanchet et al. (2021) is used to derive projected yearly construction rates (i.e. trend scenario) for the 2025–50 period. Statistical archetype-based data (European TABULA project; Loga et al. 2016) are used to obtain average wall geometry factors for collective housing projects, assumed to be representing an average of 67.5% of all future constructions over the period (ADEME 2021c). At the parc level, the analysis subsequently centres on examining the comparative benefits of implementing the various material alternatives on 30% of new collective housing projects during the period (which would generate a peak demand for cut-stone of 870,988 m3/year, expected to occur in 2035). Dynamic building stock variables and material LCIs over the considered period are provided in Appendix 2.3 in the supplemental data online.
4. Results
The results section consists of two main parts. First, the cut-stone environmental-impact model is presented and validated. Second, the environmental performance of a 1 m2 cut-stone load-bearing wall is benchmarked against typically considered alternatives. This analysis is then extended to the level of the housing construction industry.
4.1 Embodied carbon of cut-stone
GWP values for the volumetric carbon impact of cut-stone were derived on a per kg of stone basis, as a function of material thickness. A power function model (equation 7) (plotted in Figure 5 for TH = 100 years and BLS = 50 years) is found to best fit the distribution of the data. The following observations can be made:
The model distinctly displays decreasing trends (i.e. lower impact per kg of stone for higher thicknesses). Similar to previous findings on isolated products (Ioannidou et al. 2014), this observation coincides with the fact that sawing and surface treatment emissions are correlated with the specific surface of the product, regardless of its volume. Thin assemblies are also more likely to be composed of higher density stones, necessitating longer sawing times, and to require secondary products for installation (e.g. metal fasteners, accounted for in LCA stage A5), as well as more adhesive mortars, which are emission intensive.
Higher amplitudes of variability, and thus lower predictability, are found for thinner products (n < 0.2 m) due to the unpredictable nature of the required add-ons and the increasing variability in surface treatment procedures (e.g. flaming or polishing more likely to be undertaken for cladding than for heavy masonry walls, often left with cut marks).
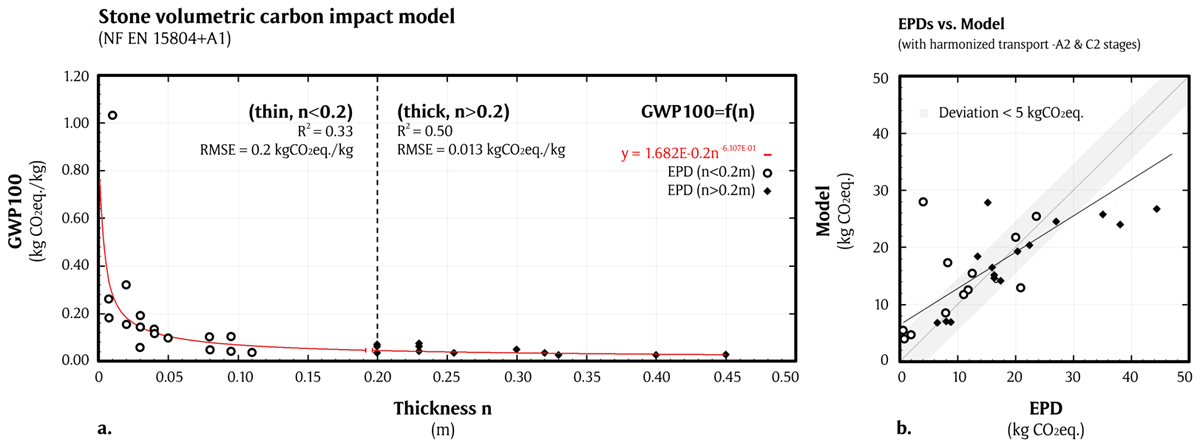
Figure 5
Volumetric carbon impact model for stone shown (a) for a 100-year time horizon of analysis, and a 50-year building life spans (BLSs) (i.e. GWP100/kg of natural stone as a function of product thickness n), and model plots against currently available environmental product declarations (EPDs) (b).
Consequently, the model is distinctively evaluated for thicknesses above and below 0.2 m. The separate assessments show varying root mean square errors (RMSEs) for the two ranges: while model performances are lower for thinner assemblies (RMSE = 0.20 kg CO2e/kg), the reliability noticeably increases (15-fold) for assemblies > 0.2 m (RMSE = 0.013 kg CO2e/kg, equivalent to 5.77 kg CO2e/m2 of 0.24 m-thick wall for average densities of the French quarrying sector; see section 4.2), above which the model is reasonably deemed robust enough to accurately position heavy masonry walls among other material alternatives in the subsequently undertaken comparative LCA.
Accordingly, for any TH, the model assumed in the subsequent analyses takes the following form:
where n is the thickness of the product (m); and the scaling factor (δ) and exponent (ɛ) are derived for each TH and BLS (Table 1).
Table 1
Stone volumetric carbon impact model scaling (δ) and exponent (ɛ) factors for different time horizons (TH) and building life spans (BLS).
| BLS (YEARS) | TH = 100 | TH = 200 | ||
|---|---|---|---|---|
| δ | ɛ | δ | ɛ | |
| 50 | 1.68E–02 | –6.107E–01 | 1.775E–02 | –6.113E–01 |
| 100 | 1.456E–02 | –5.789E–01 | 1.726E–02 | –6.061E–01 |
[i] Note: For a static life cycle assessment (LCA), δ = 1.923E–02 and ɛ = –6.052E–01.
The distribution of emissions among the various life cycle stages for thicker stone material assemblies is shown in Figure 6 for the collected data, with product and construction stages (A1–A5) accounting for more than three-quarters of the total cumulative impact.
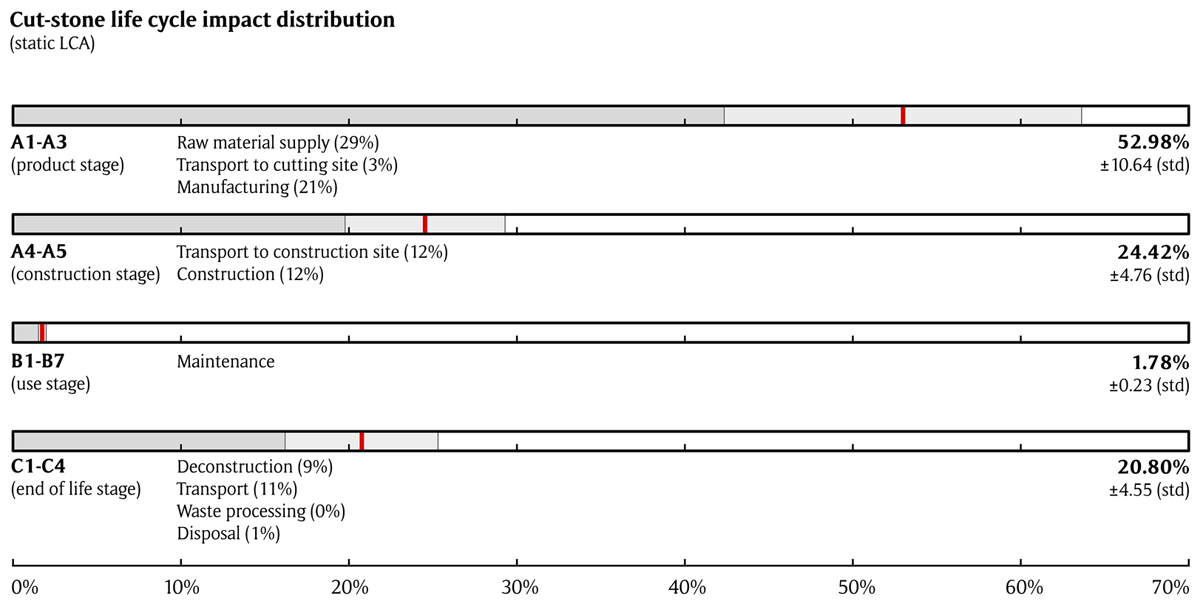
Figure 6
Distribution of life cycle impacts for thick-dimension stone material assemblies (i.e. n > 0.2 m), displayed for static life cycle assessment (LCA) (i.e. full account of all life cycle inventory (LCI) emissions, without timing-based weighting).
A transport distance (life cycle stage A4) sensitivity analysis is performed. Assuming average French limestone densities (Pestre 2021) and typically implemented thicknesses of 24 cm, the total embodied impact of a masonry wall (1 m2) is shown to double for truck-transit distances increasing from 60 to 579 km, in which case the A4 stage would go from representing 12% to 56% of the total impact. A similar increase in transport distances when considering electric rail transport would only increase the total impact by 5.3%, suggesting that national coverage from selected quarries with high extraction rates would be an appropriate strategy for national low-carbon transition industrial roadmaps. Although overseas importations (via ship transit) are mostly limited to thin products (SNROC et al. 2014), cross-border competition has been shown to arise within the EU for thicker assemblies, with truck transit sometimes exceeding 1500 km (INIES 2020). While economic flow analyses have shown such importations to be unsuitable strategies in social terms (Ioannidou et al. 2018), the results also indicate their unsuitability from an environmental perspective.
4.2 Comparative LCA
Using a French average limestone density of 1851 kg/m3 (Pestre 2021), the volumetric carbon-impact model for cut-stone was used to comparatively assess the performances of load-bearing stone masonry walls with regard to low-carbon alternative materials in the context of the French construction sector.
Following RE2020 requirements (RE2020 2021), results are first shown (Figure 7a and Table 2) for a 50-year BLS and a 100-year analysis TH (i.e. GWP100). The GWP scale is shown for functional units of a 1 m2 wall. Uncertainty ranges are indicated in red, light grey and grey for stone, HWPs and low-carbon concrete, respectively. Higher probability scenarios are indicated with increased line weight, corresponding to the following:
median estimation range of the model in the case of stone (referred to as STONE 1)
CEM III with direct attribution of GGBFS emissions in the case of low-carbon concrete (referred to as CEM III 2)
sequestration accounted for during regrowth and avoided sequestration accounted for using a decreasing growth rate model (Figure 3b) in the case of HWPs, referred to as CLT3—the metabolic rate model CLT 4 having been developed for tree growth in the absence of competition (Stephenson et al. 2014), representative of timber sourced from natural forests newly turned into a managed forests, as opposed to a managed forest established through afforestation.
Table 2
Comparative dynamic life cycle assessment (LCA); stone model against various harvested wood products (HWPs) and concrete global warming potential (GWP) models shown for 1 m2 of load-bearing wall surface: (a) GWP100 (kg CO2e) for a 50-year of building life spans; and (b) sensitivity analysis for a 100-year building life span (GWP200).
| THICKNESS (CM) | STONE | CEM I | CEM III 1 | CEM III 2 | CLT 1 | CLT 2 | CLT 3 | CLT 4 |
|---|---|---|---|---|---|---|---|---|
| (a) GWP100 | ||||||||
| 0.10 | 25.70 | 15.17 | 21.92 | –17.69 | 11.69 | 20.21 | 50.70 | |
| 0.20 | 16.65 | 55.40 | 37.06 | 49.52 | –35.38 | 22.09 | 39.14 | 100.11 |
| 0.30 | 19.49 | 85.06 | 58.96 | 77.19 | –53.07 | 32.49 | 58.06 | 149.52 |
| 0.40 | 21.80 | 114.73 | 80.56 | 104.87 | –70.76 | 42.89 | 76.99 | 198.94 |
| (b) GWP200 | ||||||||
| 0.10 | 23.50 | 12.86 | 19.03 | –17.48 | –4.38 | 4.37 | 36.75 | |
| 0.20 | 16.96 | 53.09 | 34.18 | 46.63 | –34.96 | –8.78 | 8.76 | 73.52 |
| 0.30 | 19.89 | 82.75 | 56.08 | 74.31 | –52.44 | –13.16 | 13.14 | 110.28 |
| 0.40 | 22.28 | 112.41 | 77.68 | 101.99 | –69.92 | –17.55 | 17.52 | 147.04 |
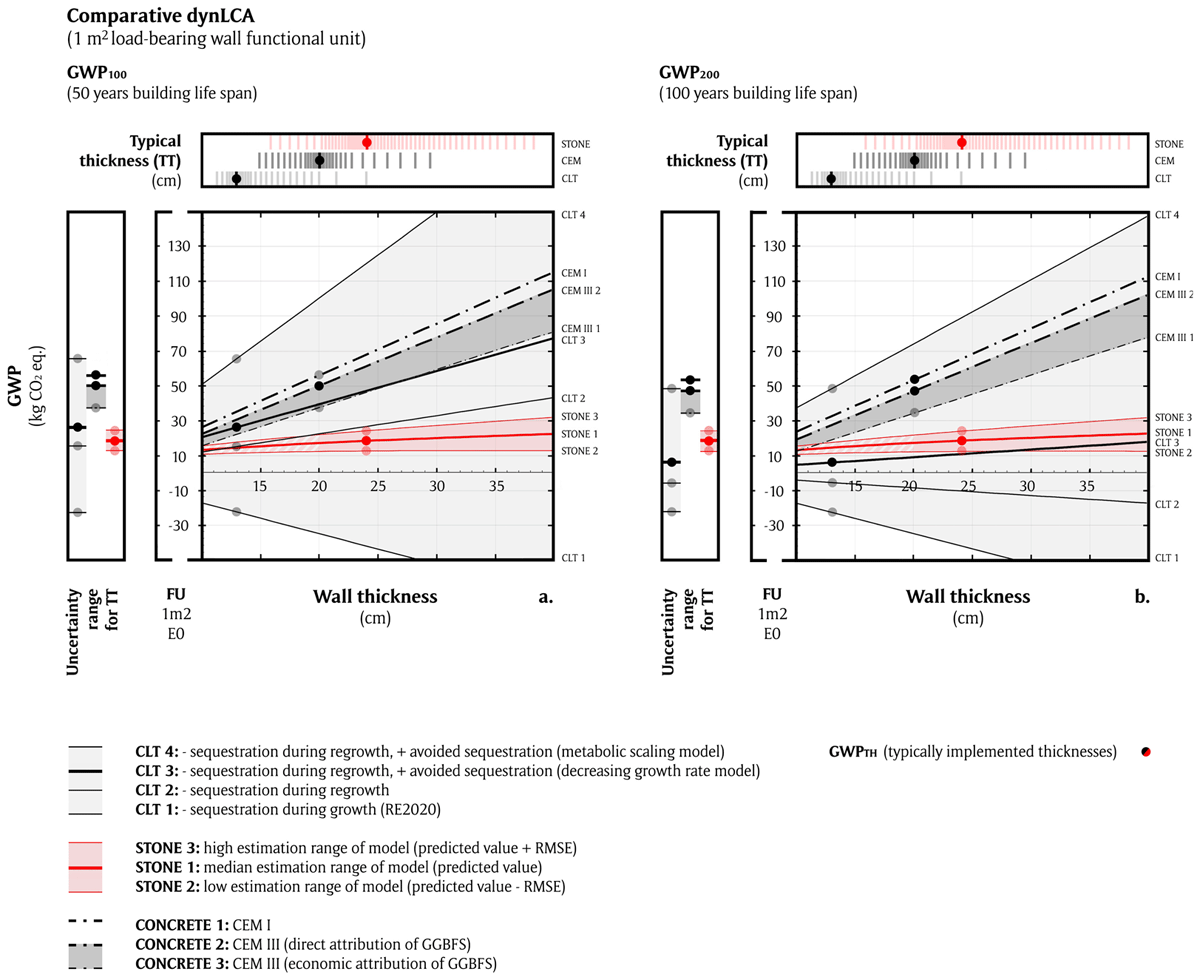
Figure 7
Comparative dynamic life cycle assessment (LCA); stone model against various harvested wood products (HWPs) and concrete global warming potential (GWP) models: (a) GWP100 for 50-year life spans; and (b) sensitivity analysis for 100-year building life spans (BLSs) (GWP200).
Due to their volumetric impact decreasing with increasing thickness, stones are shown to present the lowest absolute increase rate in GWP100 with increasing wall thickness (30.9% GWP100 increase for a doubling of material volume compared with 212.0% and 200.0% for concretes and HWPs, respectively).
For high-probability material emission profiles, and considering typically implemented material thicknesses, stone assemblies will emit respectively 3.06, 2.73 and 1.43 times less than CEM I, CEM III and CLT walls. Considering the higher range of uncertainty for all materials, and typically implemented thicknesses, stone assemblies could emit up to 3.62 times less than HWPs. A transport distance sensitivity analysis is shown in Figure 8, considering average truck, ship and train transit (Ecoinvent 3.7.1). Assuming industry average transport distances between manufacturing and construction sites (LCA stage A4) for concrete and CLT (i.e. 30 and 287 km, respectively) (DE-Bois 2022a; Guiraud 2018), and GWP100 values, truck-transit transport distances for cut-stone would have to be increased from the considered average of 60 km to 259, 1334 and 906 for its embodied impact to surpass that of the CLT3 (high-probability), CLT4 (low-probability) and CEM III 2 (high-probability) scenarios, respectively, suggesting that lorry-carried cut-stone imports, e.g. typically > 1500 km for neighbouring countries cut-stone products (INIES 2020), would quickly reach impact levels higher than locally sourced CLT and concrete. On the other hand, assuming electrically powered train transit, transport distances of 1721, 8914 and 6012 km would be required to reach embodied impacts higher than locally sourced CLT3, CLT4 and CEM III 2, respectively, suggesting that under clean nationwide transportation scenarios, cut-stone assemblies could consistently exhibit better performance.
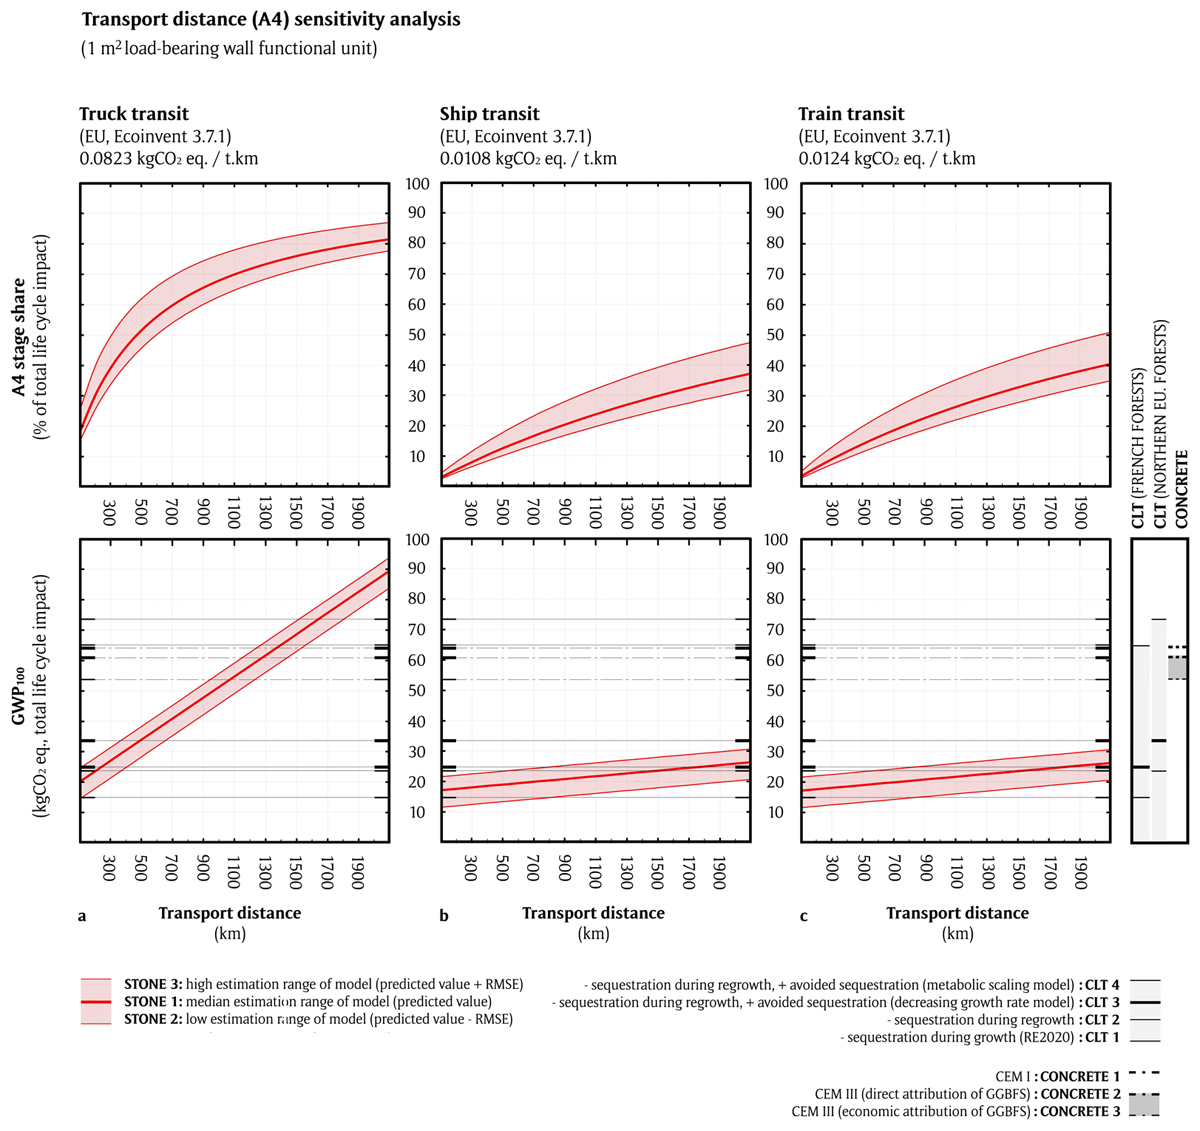
Figure 8
Impact of increased transport distances (A4: transport to building site) on total life cycle carbon impact of a 1 m2 load-bearing cut-stone wall, assuming an average density of 1851 kg/m3, a thickness of n = 24 cm and a building lifespan of 50 years, compared with fixed national average A4 transport distances for concrete and cross-laminated timber (CLT) assemblies (30 and 287 km, respectively).
It should be noted that transport distances to the manufacturing site (LCA stage A2) may also disproportionately vary between the considered materials, with CLT manufacturers increasingly relying on long-distance imports from Northern Europe’s boreal forests, against the common juxtaposition of extraction and manufacturing sites for cut-stone (ADEME 2016). With average increases of 7.54 kgCO2e (GWP100)/m2 of 13 cm-thick CLT panel for 100% Scandinavian softwood contents (DE-Bois 2022a), truck-transit transport distances for 24 cm-thick cut-stone assemblies would have to be increased to 465 km to surpass that of 13 cm-thick CLT exclusively sourced from Northern boreal forests, in the CLT3 scenario, and to 1551 km in the CLT 4 scenario, suggesting that national truck coverage from a single quarry might provide a viable alternative to imported softwood-based products, from a carbon standpoint.
A sensitivity analysis was performed for a longer BLS (100 years) to further extend the comparative analysis. An increased TH was required for the analysis (200 years) to dynamically account for end-of-life emissions in LCI year 100. GWP200 values are given in Figure 7(b) and Table 2. The results show that variation in the BLS has a minimal impact on geo-sourced and cementitious materials. Increased maintenance requirements result in a 1.01% average increase in the embodied impact of stone assemblies, while increased carbonatation (an exponentially decaying process) results in a 1.05% average decrease in the embodied impact of concrete assemblies. Conversely, the BLS is shown to greatly influence the comparative performance of HWPs. By delaying the end-of-life emissions of the CLT assembly and thus storing carbon in the building for longer periods, the relative significance of the diffuse effect of sequestration during the regrowth of the tree increases proportionately. While stone will emit on average 1.43 times less than CLT (high-probability scenario, CLT3) for typically implemented thicknesses and a BLS of 50 years (Figure 7a), the trend reverses for a life span of 100 years (Figure 7b), with stone emitting on average 3.20 times more than CLT. A dynamic BLS sensitivity analysis provided in Appendix 1.4 in the supplemental data online shows that the CLT3 scenario becomes less impactful than stone for any BLS above 85 years, suggesting that the BLS must be greater than the forest rotation period for the CLT to have a lower impact than stone.
However, this assertion is only valid if distant THs (100 years for Figure 7a and 200 years for Figure 7b) are selected for analysis. Climate urgency requires the temporal dynamics of material emission profiles to be considered for an astute understanding of their immediate impact.
To that end, the temporal dynamics of the two analyses (50- and 100-year BLSs) are shown in Figure 9 for typically implemented thicknesses, where the GWPs of the various assemblies are dynamically characterised for incremental THs. For further clarity, the correlation between Figures 7 and 9 is presented in Figure 10. Consistent with the scientific consensus (Hawkins et al. 2021), the results show that HWPs are not climate neutral in the short term, affecting their immediate comparative performance. The 100-year BLS analysis (Figure 9b) shows that the peak impact of CLT (high-probability scenario CLT3) occurs 15 years after construction, where the GWP15 is 1.69 times that of stone. CLT (high-probability scenario CLT3) is shown to reach an impact lower than that of stone in year 38. The higher range of uncertainty for CLT (CLT4), on the other hand, is shown to never reach GWP levels lower than that of stone, with a short-term peak difference in year 37 showing a 3.04 times poorer performance compared with stone. Unlike HWPs, and due to the majority (77.4%) of the life cycle emissions being concentrated on the product and construction stage (LCA stage A) (Figure 6), the emission profile of cut-stone wall assemblies is shown to remain constant through time, with average long-term impact (TH = 100) shown to surpass short-term impact (TH = 10) by only 8.3%.
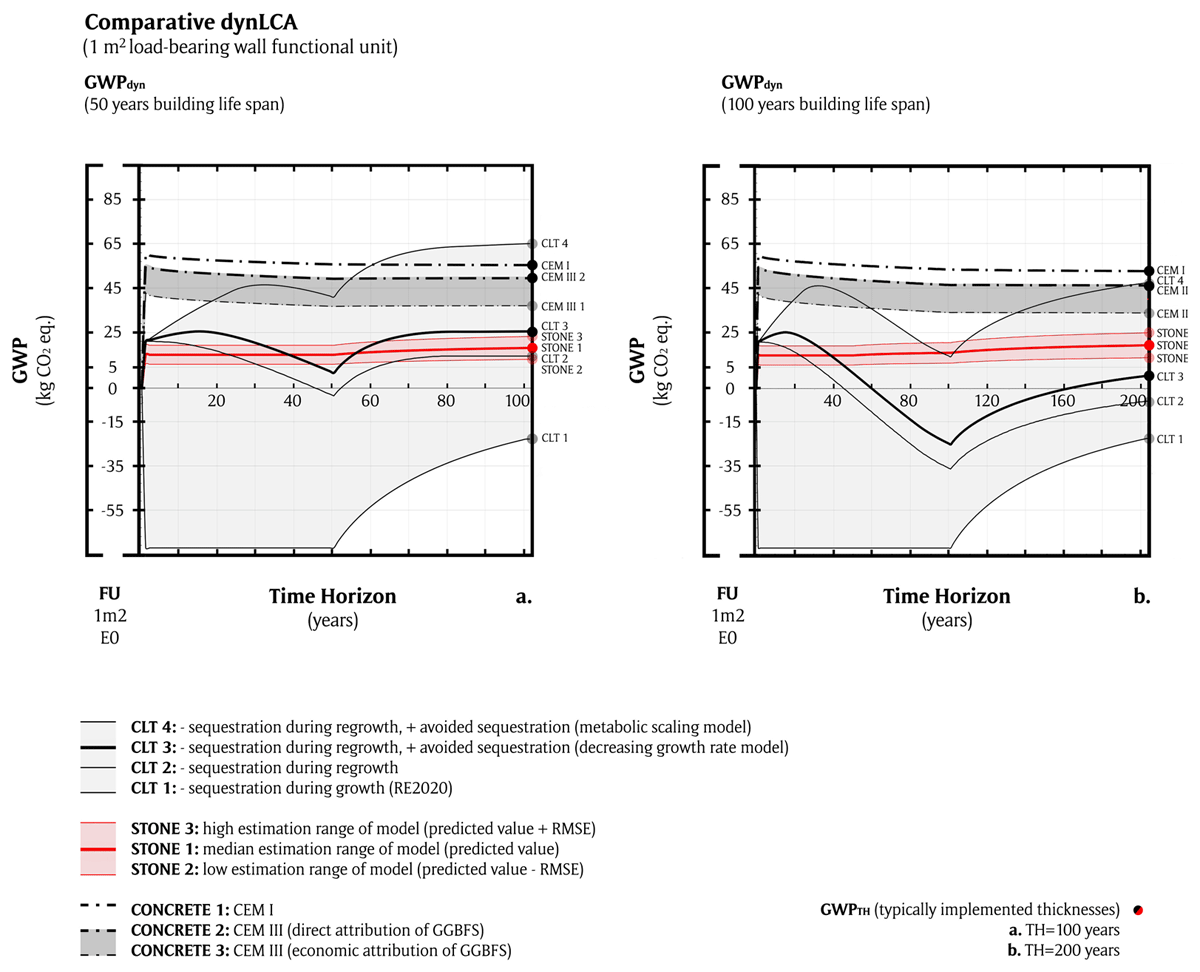
Figure 9
Comparative dynamic life cycle assessment (LCA); the stone model against various harvested wood products (HWPs) and concrete global warming potential (GWP) models shown for load-bearing wall surfaces with typically implemented thicknesses (13, 20 and 24 cm for cross-laminated timber (CLT), concrete and stone walls, respectively): (a) GWPdyn for 50-year life spans; and (b) sensitivity analysis for 100-year life spans.
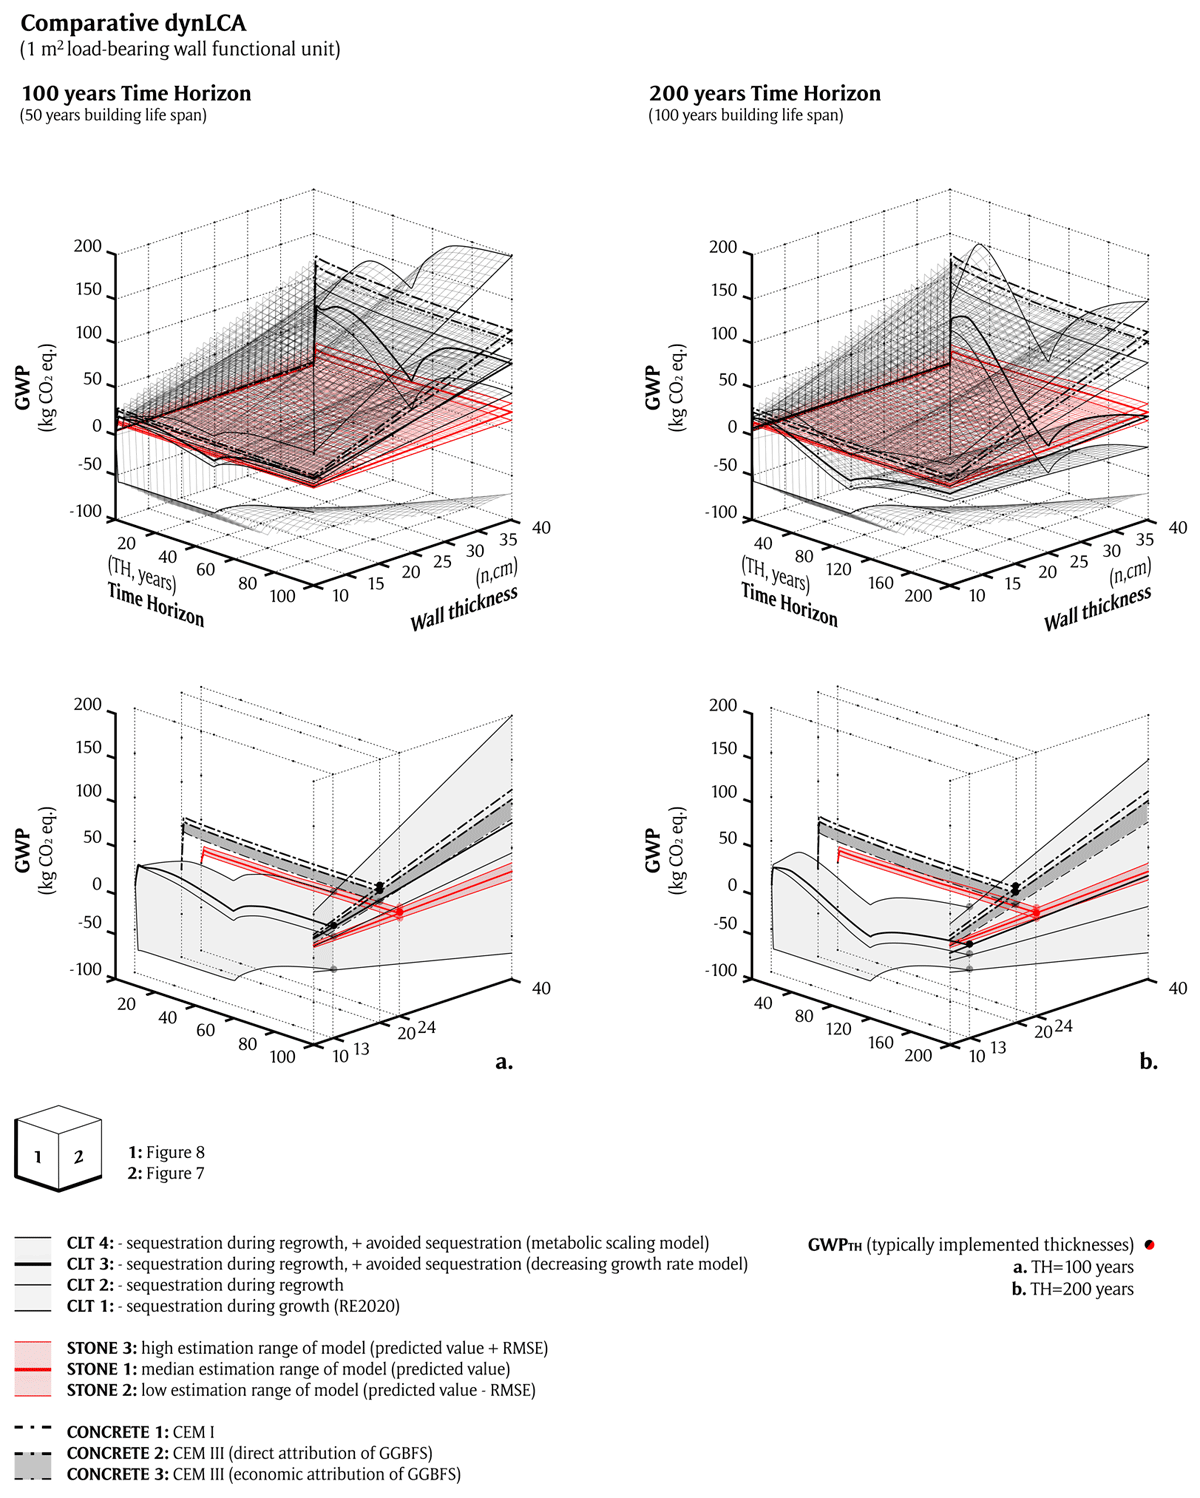
Figure 10
Comparative dynamic life cycle assessment (LCA); the stone model against various harvested wood products (HWPs) and concrete global warming potential (GWP) models shown for 1 m2 of load-bearing wall surface. (a) GWP for 50-year life spans; and (b) sensitivity analysis for 100-year life spans. Typically implemented thicknesses are highlighted in the lower figures.
The comparative impact of transport distances (A4) in the early life cycle stages (i.e. with a short-term impact) should also be analysed in light of the temporal dynamics of the emission profiles. The peak impact exhibited by the CLT3 scenario in year 15 (Figure 9a) corresponds to the maximum divergence from the median-stone scenario. Considering GWP15 values, cut-stone transport distances would need to increase from 60 to 351 and 556 km to exceed the impact of CLT sourced from French and Northern Europe’s boreal forests, respectively (assuming the CLT3 scenario for both cases). This suggests that the relevance of nationwide truck coverage from a single quarry may be debatable, at least from an immediate impact perspective.
At the level of the parc, the emissions associated with the implementation of the considered assemblies on 30% of new collective housing projects over the 2024–50 period are dynamically allocated for BLSs of 50 years (Figure 11a series), and 100 years (Figure 11b series). The resulting yearly instantaneous and cumulative global warming impacts (GWIinst and GWIcum, respectively) are plotted in the first and second rows of Figure 11 (see equations 2 and 3), while the relative impact (dynamic GWP) is shown in the third row. Previously observed trends are accentuated.
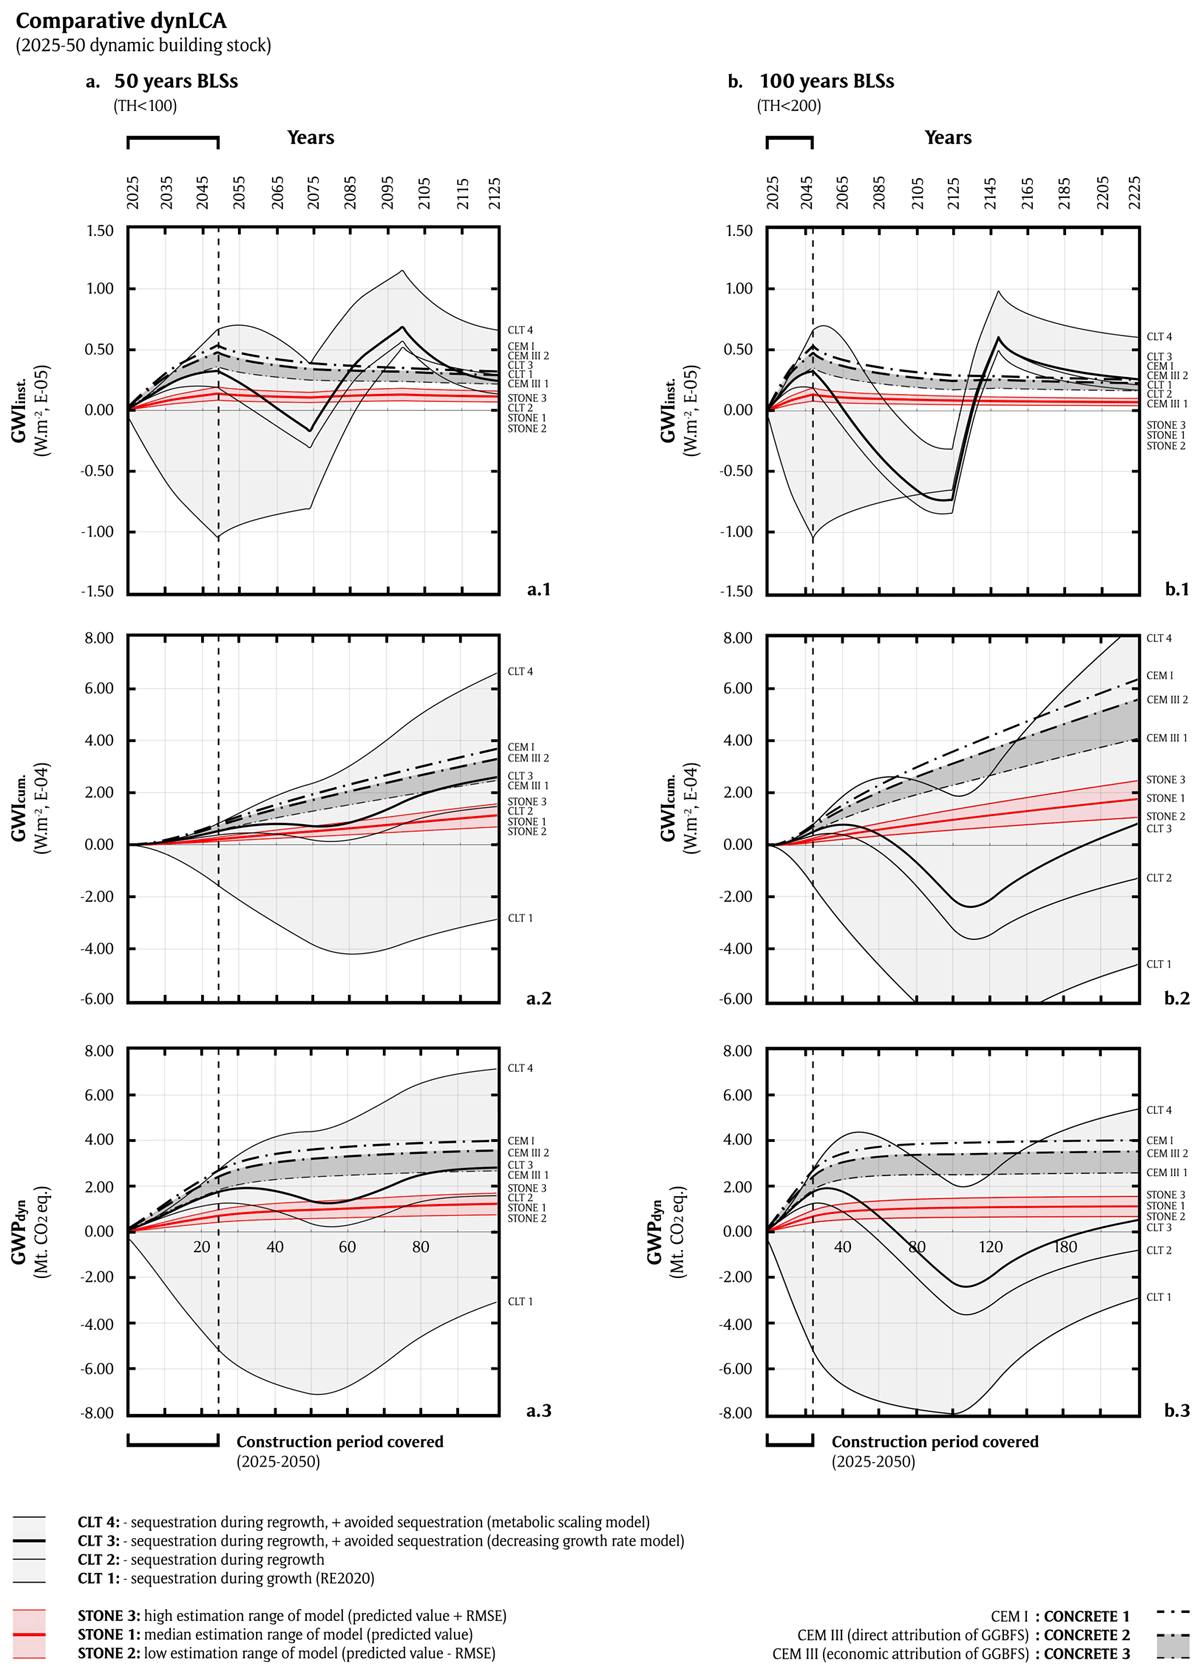
Figure 11
Building stock level analysis, assuming the implementation of considered alternatives on 30% of new collective housing projects over the 2025–50 period: (a) 50-year building life spans (BLSs); and (b) 100-year BLS. Instantaneous and cumulative global warming impact is shown in the first and second series, dynamic global warming potential (GWP) is shown in the third series.
Considering high-probability emission profiles and statutory 50-year BLSs, the substitution of 0.2 m-thick CEMI with 0.24 m-thick cut-stone on the considered fraction of the parc would amount to a 2.77 Mt CO2e decrease in the GWP100 impact of new constructions (i.e. dynamically weighted relative to 2025), against 0.43 for CEM III and 1.18 for CLT, with the stone scenario presenting higher comparative benefits both in the short and long terms. Considering the higher range of uncertainty for all materials, the implementation of stone over CLT could yield savings of up to 5.43 Mt CO2e over the period.
The 100-year BLS analysis shows peak short-term differences between CLT (high-probability CLT3 scenario) and cut-stone occurring in 2058, where GWP33 magnitudes are 2.33 times higher for CLT, amounting to a 1.09 Mt CO2e difference. The relative impact of the stone scenario (STONE 1) is shown to become higher than that of the CLT3 scenario in 2080, suggesting short-term climate benefits independent from BLSs for the former.
5. Discussion
In the framework of a rapidly warming climate (IPCC 2021), policymakers guiding construction sector industrial ecology roadmaps should anchor incentives for material selection in key emission profile criteria: (1) a low uncertainty range of GWP magnitudes; (2) invariability of GWP magnitudes through time (from year 0 to the TH of the analysis); and (3) a high comparative performance with potential alternatives. When observed, these criteria prevent (1) exponential propagation of unforeseen detrimental environmental outcomes within urgently implemented industrial strategies; (2) discrepancies between short- and long-term climate effects (potentially decoupled); and (3) missed opportunities. The results show that within the French context and among the assessed materials, cut-stone appears to be an alternative uniquely satisfying these criteria, with the additional and distinctive advantages to present:
A highly competitive extraction intensity, on a yearly extraction volume per ha basis, when compared with managed forests (50,000 m3/ha/year for cut-stone against 3.5 m3/ha/year for CLT3), directly resulting in highly concentrated extraction sites, offering highly beneficial comparative impacts on biodiversity losses, one of the main trade-offs of managed forestry activities (EFSOS 2011), and advantages in terms of environmental management (enforcing compliance with the strict requirements of the French Environmental Code—articles L. 515-3 and R. 515-2 to R. 515-7 (Gouvernement Français 2022)—is relatively straightforward, against the multilateral actions required to ensure careful planning and monitoring of the European bioeconomy (Mishra et al. 2022).
Domestic market supply chains with no inter-sectorial competition, differentiating from the HWPs sector (current imports rates of 37%; VEMA 2020), with increasing demand, and projected 15-year stagnation of the productivity of French forests; ADEME 2016) and the mineral admixtures sector (applications for fly ashes as catalysts for metal recovery, and GGBFS for carbon sequestration and soil remediation in farmland (Beerling et al. 2018; Blissett & Rowson 2012).
No required extensive research and development, as opposed to other suitable material alternatives for large-scale substitution of carbon-intensive materials (e.g. low-grade calcined clays for clinker substitution; Khalifa et al. 2020), allowing rapid deployment of industrial strategies.
With mechanical properties often unsuited for high-rise buildings (i.e. average compressive strength of 19.2 MPa; Pestre 2021), typical soft limestones appear as ideal candidate materials within a collective housing industry with average building heights lower than four stories (see subsection 3.5).
Results also suggest the central importance of considering underlying ranges of model uncertainties to critically evaluate comparative benefits of material alternatives, various allocation conventions having the embodied carbon of HWPs, from lower to higher probability, go from sequestering twice as much as that which stone alternatives would emit, to emitting 3.6 times more, with the former low-probability scenario enforced as statutory. Assuming typically implemented thicknesses and the higher range of uncertainty for all considered materials, stone presents unequivocally better performances than all alternatives in the short and long terms for all BLSs (a sensitivity analysis for BLSs of up to 1000 years is provided in Appendix 1.4 in the supplemental data online). Unlike the considered alternatives, the straightforward processes amounting to the environmental impact of cut-stones (extraction, transport and laying, neither dependant on synthetic manufacturing nor complex or diffuse biogenic growth processes) require no allocation conventions, only net absolutes, and as such result in comparatively lower ranges of uncertainty.
At the scale of the parc, the results suggest that the use of cut-stone could help reduce the embodied emissions of the housing construction sector. The study could nevertheless underestimate the comparative benefits of cut-stone assemblies by discarding favourable aspects from the functional unit (of which an exhaustive account is provided in Appendix 1.5 in the supplemental data online), including:
higher durability (Mequignon et al. 2013)
higher reuse potential (INSITU 2022)
higher integrated multifunctionality (allowing further passive substitution of mechanical systems)
lower embodied impact of typically implemented subcomponents, either insulation (perspiring biogenic insulation often implemented to safeguard hygro-thermal properties) or fire retardants (unlike CLT, stone requires no additional layers to comply with current insurance requirements (PDP 2021)
greater margin of decarbonisation (i.e. electrification) of the underlying industrial processes (ANSI/NSC 373; NSC 2022)
greater climate resilience of the material supply (unlike managed forests, quarries are not subject to gradually increasing climate-related pressures, e.g. fire and hydric stress, expansion of bio-aggressors).
Provided with the findings of this study, subsequent analyses should explore the actions needed to support a potential transition, in terms of (re)structuring, (re)expansion and (re)exploitation, of the cut-stone sector, regarding current shortcomings such as insufficient supplies (extraction volumes authorised in terms of supply scenario preventing potential widespread use), the induced insufficient competitiveness of the sector, insufficiently structured construction codes (e.g. lacking fire resistance test results, compressive strength safety factors uncoherent with advances in non-destructive integrity tests (Eurocode 6), incoordination of seismic design specifications within the EU (Eurocode 8), unadapted thermal standards (developed for light inertias, discarding hygrothermal, effusive and radiative properties of continuous thermal mass assemblies; Moe 2014), and the insufficient knowledge of the actors of the construction sector (i.e. the absence of dimension stone structure design from architecture and civil engineering curricula).
6. Limitations and future outlooks
The above considerations along with the presented results (i.e. derivation of a cut-stone material carbon impact model, and benchmarking of the results with available alternatives) both pertain to the French building and construction sector, with limited applicability abroad:
Applicability of the GWP outputs of the derived volumetric impact model for cut-stone products to foreign cut-stone sectors depends on cross-border differences in electricity mixes and cutting techniques (the primary context-dependent variables), and variations in transport distances. The straightforward adaptability of the latter (i.e. a function of stone density, and transit type and distance—see the sensitivity analysis in Figure 7) and the direct correlation between stone density and cutting technique (Bianco & Blengini 2019) inherently accounted for by the model suggests that correction coefficients applied to the electricity emission factors of the data inputs would be sufficient to allow reasonable confidence in context-specific reappropriations of the model. However, the absence of differentiated inventory entries (e.g. the electric versus fossil fuel-based fraction of energy inputs) in most underlying EPDs precludes robust extrapolations.
Likewise, context-specific factors for the developed allocation models for CLT (e.g. species-specific biogenic growth rate models) and concrete (GGBFS emission factors derived from ArcelorMittal blast furnaces), along with RE2020-specific methodological features (dynLCA and consideration of sequestered carbon), all prevent direct applicability of the comparative results with other settings, as evidenced by notable fluctuations in average GWP100 magnitudes (i.e. +34%, +54% and –23% for CEM I, CEM III and CLT wall assemblies, respectively) between the context-specific high-probability scenarios presented in the study and the averages of a comprehensive international EPD dataset (11,864, 47 and 26 EPDs considered for CEM I, CEM III and CLT, respectively; EC3 2020).
Cross-contextually relevant concerns are found in methodological considerations more than model outputs, with key replicable findings that could benefit research on high inertias stone buildings abroad:
The demonstrated correlation between GWP per unit mass and material thickness enables the adaptation and derivation of context-specific volumetric carbon-impact models for cut-stone materials in any national context with enough available EPDs, offering an expedient alternative to the resource-consuming process of conducting independent recomputations of EPDs for every quarry exploitation.
The demonstrated significance of considering an exhaustive range of underlying-processes allocation models (e.g. the influence of diffuse or avoided sequestration dynamics for HWPs) for ensuring fair comparative LCAs.
Note that the conservative forest rotation period used in the study corresponds to average recommendations for Norway spruce on medium fertile sites (Äijälä et al. 2019; Kellomäki et al. 2021)—aligning with recent dynamic assessments of European’s bio-construction industry (Göswein et al. 2021; Pittau et al. 2019). Future studies should consider sensitivity analysis to address the fact that sustainable management practices are increasingly given greater priority, resulting in longer rotation periods compared with those examined in the study (EFSOS 2011). Also, the study assumes sequestration dynamics corresponding to the immediate replanting of a tree after cutting, and future sensitivity analyses should take into account that this may not always be the case (section L124-6 of the forestry code allowing a five-year gap between cutting and replanting for sustainable management practices). Finally, the use of metabolic scaling models (i.e. net primary productivity models developed at the tree scale, instead of the common even-aged forest-stand scale) to evaluate avoided-sequestration dynamics is a novel topic (Stephenson et al. 2014), and subsequent studies should ensure they remain current with the latest scientifically endorsed methodologies, including those that have not yet been released.
7. Conclusions
This study assessed the climate mitigation potential of reintegrating cut-stone materials into contemporary construction practices in light of the objectives outlined in France’s RE2020 low-carbon building standard.
A model for the systemic evaluation of the embodied emissions of cut-stone (a high social value and multifunctional material combining structural, hygrothermal, acoustic and visual functions) on the French market was derived and validated, shown to be reliable for thicker (> 0.2 m) assemblies, and whose methodology could be replicated abroad. Average GWP100 (global warming potential) magnitudes of 18.08 kg CO2e/m2 were found for typically implemented masonry thicknesses and average densities on the French market, with emission profiles relatively unaffected by variations in volume (more stone and thus thicker assemblies equal less carbon per kg of stone).
A comparative life cycle assessment (LCA) was performed with commonly considered low-carbon material alternatives on the French market (harvested wood products (HWPs) and low-carbon concrete). Typically implemented thicknesses were used as a functional unit, with French industry averages of 13, 20 and 24 cm used for cross-laminated timber (CLT), concrete and stone, respectively. Underlying ranges of uncertainty were evaluated using the root mean square error (RMSE) of the developed model in the case of stone, and exhaustive ranges of GWP allocation conventions in the case of alternative materials. HWPs were shown to go from sequestering twice as much as that which stone assemblies emit (sequestration considered during growth of the tree—a statutory convention in French environmental legislations), to potentially emitting 3.6 times more (sequestration considered during regrowth, and avoided sequestration after cut accounted for using a metabolic scaling model), while low-carbon slag concretes were shown to go from emitting 2.0 times more (economic attribution of ground granulated blast furnace slag (GGBFS)—a statutory convention) to 2.73 times more (direct attribution of GGBFS), thus demonstrating the critical importance of considering various GWP allocation methodologies to critically assess the comparative benefits of various material alternatives. At the scale of foreseeable annual housing construction rates in France (considering high-probability scenarios, typically implemented load-bearing wall thicknesses, and statutory building life spans (BLSs) and time horizon (TH) of analysis), exclusive implementation of cut-stone load-bearing walls over reinforced concrete element (CEM I) within 30% of new collective housing projects over the 2025–50 period would result in a 2.77 Mt CO2e decrease in the GWP100 of the parc (i.e. dynamically weighted relative to 2025), against 0.43 for CEM III, and 1.18 for CLT.
The differentiating climate performances of industrial applications of cut-stone assemblies are demonstrated through their compliance (proven uncommon) with three emission profile criteria: (1) a low uncertainty range of GWP magnitudes; (2) invariability of GWP magnitudes through time (from year 0 to the TH of the analysis); and (3) a high comparative performance with potential alternatives. Additional industrial comparative advantages are discussed (in terms of extraction intensity, biodiversity management, domestic market opportunities and potential speed of deployment). Overall, this study contributes to demonstrating the relevant part the cut-stone sector could play, in conjunction with other typically considered low-carbon alternatives, in a comprehensive industrial approach to mitigate embodied emissions in the construction industry.
Notes
[2] Assuming average inherent compressive strengths of 36, 22.5 and 19.2 MPa for CLT, concrete and cut-stone, respectively (Chiniforush et al. 2021; Pestre, 2021).
[3] Considering an average λ of 0.12, 0.88 and 0.035 W/m/K for CLT, stone and EPS insulation, respectively, and a surface thermal resistance of 0.17 m2.K/W (ISO 2007).
[4] Assuming quarrying depths of 10 m/year and 50% rejection rates for cut-stone (SNROC et al. 2014), and the current 14.8 M m3/year softwood production rate of the 4.4 M ha of managed softwood forests in France, with typical CLT industry rejection rates of 80% for CLT (ADEME 2016; CNPF & Fransylva 2021).
Acknowledgments
The authors express their sincere gratitude to Edward Woods, Head of Engineering at Bouygues Immobilier SAS, for his invaluable support and unwavering commitment during the development of the framework that allowed for the successful execution of this research.
Author contributions
TDT: Conceptualisation, methodology, investigation, data curation, formal analysis, visualisation, writing—original draft and revision, and project administration. TP: methodology and data curation (limited to cut-stone embodied carbon model), review of the manuscript.
Competing interests
TDT has no competing interests to declare. TP is affiliated with the Technical Centre for Natural Building Materials (CTMNC), an industrial technical centre (ITC) of industrial governance entrusted (by ministerial order of 31 December 1957) to conduct research and development work of general interest for the stone industrial sector. TP declares that this affiliation did not influence the design or execution of the study sections for which he was responsible in this study.
Funding
This study was conducted as part of the research and development activities (strategic foresight for sustainability in the built environment) undertaken by the Bouygues Immobilier SAS Engineering Department, with the unpaid (and solicited) collaboration of the Technical Centre for Natural Building Materials (CTMNC).
Supplemental data
Two files containing supplemental data for this article can be accessed at: https://doi.org/10.5334/bc.278.s1