
Table 1
Manifestation and impact of the urban climate in temperate climates.
| TYPE OF IMPACT | IMPACT PARAMETER | DESCRIPTION OF IMPACT |
|---|---|---|
| Climate | Air temperature | Increase in air temperature in relation to the surrounding countryside, with increases up to 6°C recorded in temperate climate cities—typically highest at night (Kleerekoper et al. 2017) |
| Relative humidity | Drier conditions in cities arising from the nature and intensity of human activity as well as patterns of irrigation in open spaces (Phelan et al. 2015) | |
| Precipitation | Increased precipitation downwind of cities (in summer and the mornings) (Golroudbary et al. 2018). Air pollution exacerbates condensation and may increase regional precipitation (Freitag et al. 2018) | |
| Regional/global climate | Urban climate has a feedback with regional climates in highly urbanised regions of the world such as Western Europe (a slower increase in the daily maximum air temperature but a faster increase in the daily minimum temperature, leading to a smaller diurnal variation) (Daniel et al. 2018; Katzfey et al. 2020), but the relationship in other (less urbanised) regions as well as the exact mechanisms of the feedback are unclear | |
| Wellbeing and biodiversity | Air quality | Transport as well as waste heat from buildings contribute significantly to air quality deterioration. Air pollution acts as a greenhouse gas to trap urban heat, leading to a feedback loop between temperature and air quality |
| Vegetation and biodiversity | Local warming and air pollution reduce the vegetation’s ability to provide ecosystem services (such as cooling) by interfering with its growth (Gunawardena et al. 2017). Additionally, local temperature changes affect the diversity of urban flora and fauna (enhancing the ability of invasive species to thrive as well as decreasing native species’ ability to adapt) | |
| Human health | Risk of mortality due to heat increases by between 1% and 3% per 1°C change in high temperature (Hajat & Kosatky 2010). Societal costs are tempered by population density, the general economic health of the city and the fraction of the elderly population, and further complicated by equity and social justice issues | |
| Carbon | Energy consumption | Building energy demand is decreased in winter (less heating) and increased in summer (more cooling) (Kolokotroni et al. 2010). The temporal differences in their peak occurrence may lead to greater carbon emissions depending on the electricity generation mix (Skelhorn et al. 2018). The configuration of buildings with respect to one another and the thermal properties of buildings and pavements will influence building energy demand in complex ways (cf. Futcher et al. 2018) |
| Water (quality and quantity) | Increases in water use (e.g. for irrigation) as well as runoff (due to paving and roads). Sealed surfaces also reduce water availability to absorb heat, leading to temperature changes. Rise in surface temperature affects water runoff temperature as well as chemistry, leading to a loss of water quality (Phelan et al. 2015) | |
| Economic impacts | Higher cooling loads (thus, higher energy use) and productivity losses have economic consequences. This is further exacerbated by air quality deterioration |
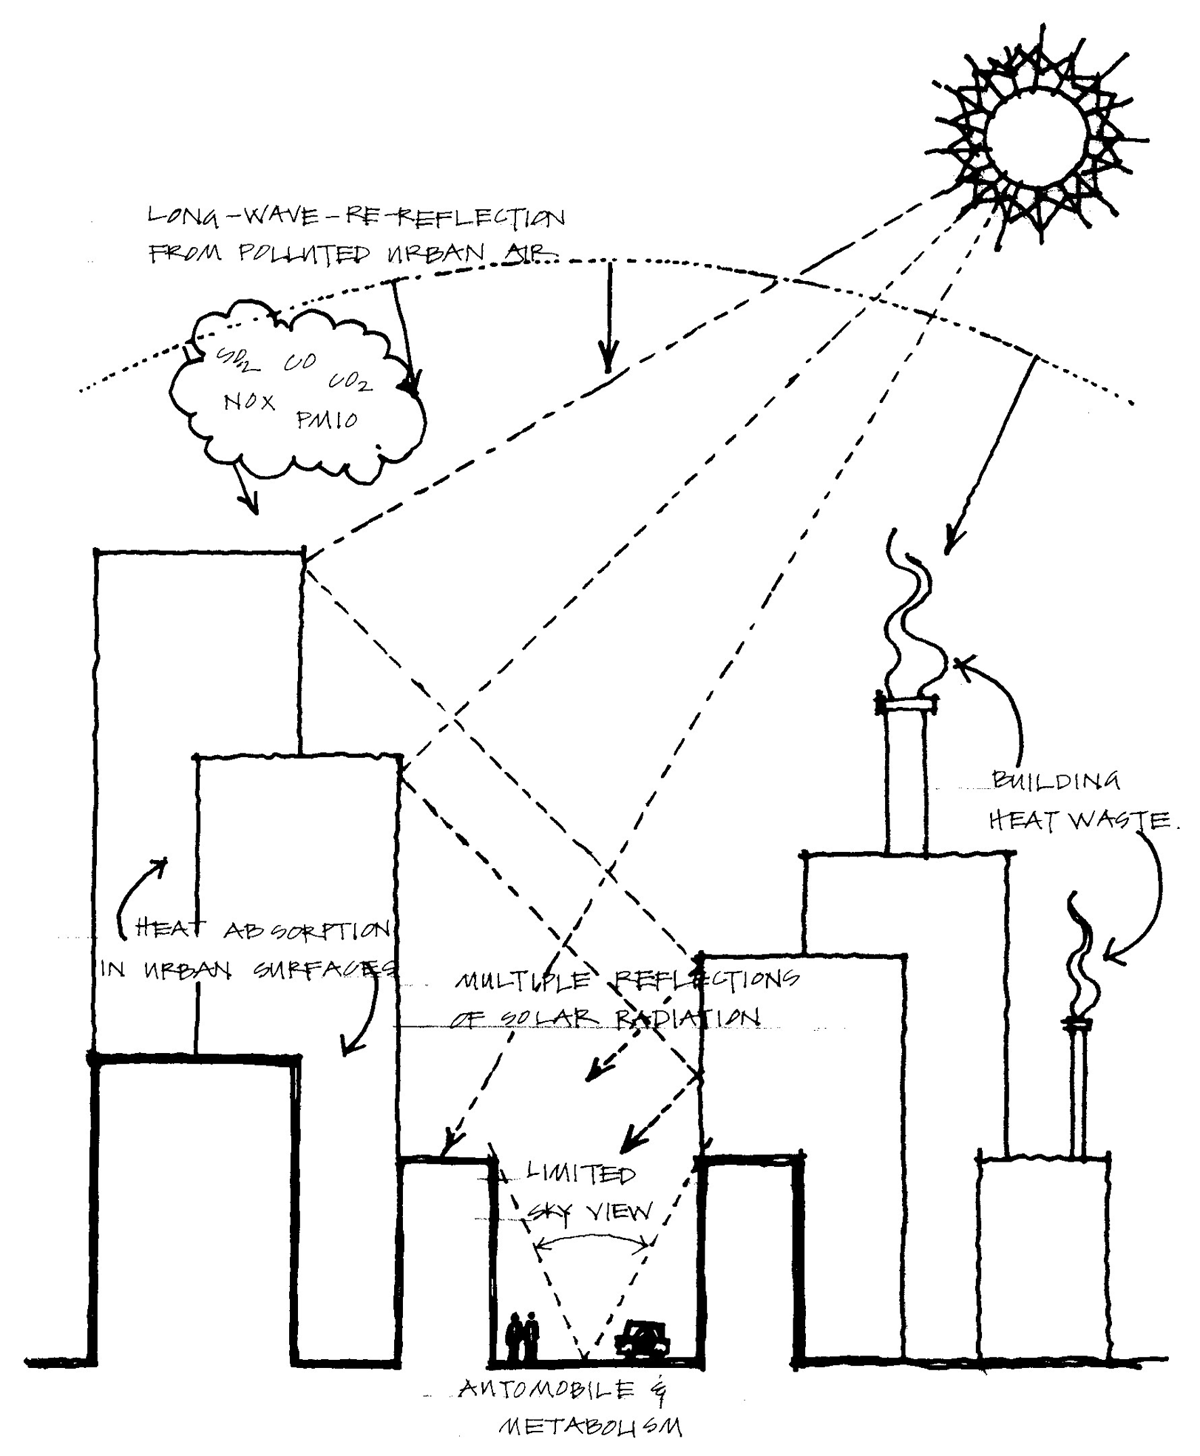
Figure 1
Summary view of the factors affecting the urban climate.
Source: Emmanuel (2005).
Table 2
Practical tools for urban climate mitigation.
| APPROACH | DESCRIPTION | INTENDED USERS | POINT OF APPLICATION |
|---|---|---|---|
| Urban climate mapping | Urban climate mappings (UCMaps) consist of a UC-AnMap, which analyses climatic, geographical and planning information in map form, and a UC-ReMap, which develops planning instructions from an urban climatic point of view (see Ren et al. 2011 for a review). Useful technical standards exist for UCMap (VDI 1997) | Urban planners and urban designers | Masterplan, zoning plan and local development plan |
| Shading analysis | Optimising street canyon geometry to enhance the thermal comfort in public places offers several approaches to enhance shading. These include shadow-casting by buildings on public places and the ‘urban cool umbrella’ (https://www.castrucciarchitect.com/urban-cool-umbrella) that uses street furniture to enhance shading in public places | Urban designers, building designers and building services engineers | Street design and preliminary planning approval for buildings |
| Ventilation analysis | Following from the Severe Affective Respiratory Syndrome (SARS) epidemic in 2003, the Hong Kong government promulgated air ventilation assessment (AVA) regulations (Hong Kong Government 2006) to monitor the air flow effects of buildings. AVA uses the velocity ratio as an indicator of wind availability | Urban planners and public health officials | Masterplan, urban regeneration and neighbourhood development plan |
| Planning codes as toolkits to manage urban heat | Several heat island-mitigation toolkits and codes (including mandates and incentives) exist in the US to facilitate decision-making at local government levels. These include the ‘cool roofs’ programme (enhancing roof albedo); ‘green roof’ (intensive and extensive roof green cover); ‘cool pavements’ (similar to cool roofs, but for pavements) and urban forestry regulations (see Hoverter 2012 for a review) | Urban planners, building designers, building services engineers and public health officials | Streetscape design and building design |
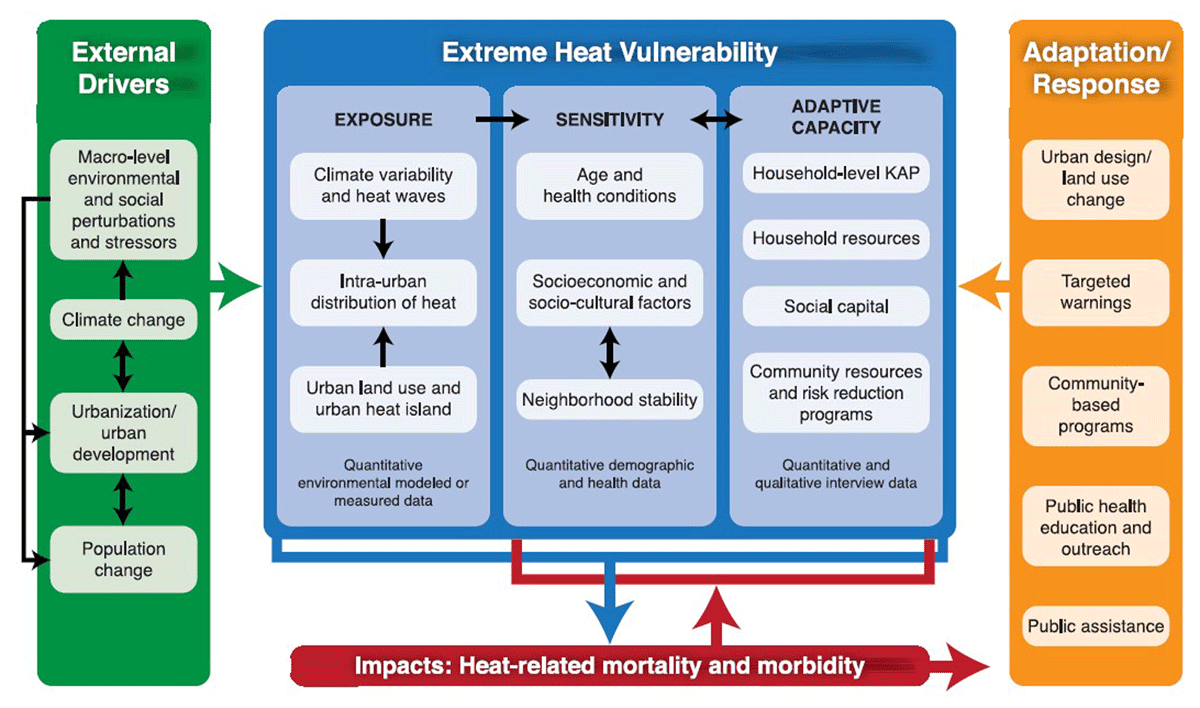
Figure 2
Heat vulnerability framework.
Source: Wilhelmi & Hayden (2010).
Table 3
Action areas for an urban heat resilience policy.
| POLICY AREAS | ACTIONS |
|---|---|
| Public health | Hotspot mapping; heat-related workload scheduling; and heat-related health and safety management |
| Building regulations | Heat stress-resistant building design guidelines; building morphology and form controls; control of building surfaces/material properties; financial incentives; include heat stress resistance in building energy certification; demonstration buildings |
| Planning actions | Cool refuges/public places for adaptation; heat mapping as part of an urban planning framework; urban climate mapping; ventilation and shadow assessment; open space/nature-based solutions (NbS) as part of the planning framework, inclusion of future climate scenarios for current regulations and practices |
| Infrastructure and services | Enhance infrastructure demand monitoring and modelling to account for heat stress; adopt public transport infrastructure to heat stress; review water and electricity infrastructure to manage heat-related demand |
[i] Source: Adapted from Hatvani-Kovacs et al. (2018) and based on discussions in this Briefing Note.
| Albedo | Fraction of solar radiation reflected from a surface |
| Aspect ratio | Ratio between the width of a street and the average height of buildings that abut it |
| AVA | Air ventilation assessment |
| Cool roof | A high-albedo roof |
| FAR | Floor area ratio |
| Form factor | Measure of vertical density |
| NbS | Nature-based solutions |
| PAD | Plan area density |
| SARS | Severe Affective Respiratory Syndrome |
| UC-AnMap | Urban climate analysis map |
| UC-ReMap | Urban climate recommendation map |
| UHI | Urban heat island |
| Urban canopy layer | Space from the ground up to the average height of roofs |
| Urban cool umbrella | Shadow-casting by buildings on public places |
| Volumetric compactness | Horizontal density |