
1. Introduction
The dramatic growth in the scientific understanding of the microclimatic consequences of urban growth is increasingly yielding policies, programmes, protocols and planning codes to mitigate its negative consequences. The aim of this briefing note is to succinctly capture key considerations and current developments that have a bearing on planning practice. It highlights the current science findings as well as knowledge gaps, closing with key issues for the integration of urban heat resilience policy with climate change mitigation.
The urban microclimate anomaly is at its most distinctive state on clear (cloudless) and calm (little or no wind) nights (ranging from soon after sunset to just before dawn) and manifests itself in air temperature, relative humidity, wind (speed and direction) as well as precipitation in the manner described in Table 1. It further impacts building energy needs, human comfort and wellbeing, as well as regional climate change.
Table 1
Manifestation and impact of the urban climate in temperate climates.
| TYPE OF IMPACT | IMPACT PARAMETER | DESCRIPTION OF IMPACT |
|---|---|---|
| Climate | Air temperature | Increase in air temperature in relation to the surrounding countryside, with increases up to 6°C recorded in temperate climate cities—typically highest at night (Kleerekoper et al. 2017) |
| Relative humidity | Drier conditions in cities arising from the nature and intensity of human activity as well as patterns of irrigation in open spaces (Phelan et al. 2015) | |
| Precipitation | Increased precipitation downwind of cities (in summer and the mornings) (Golroudbary et al. 2018). Air pollution exacerbates condensation and may increase regional precipitation (Freitag et al. 2018) | |
| Regional/global climate | Urban climate has a feedback with regional climates in highly urbanised regions of the world such as Western Europe (a slower increase in the daily maximum air temperature but a faster increase in the daily minimum temperature, leading to a smaller diurnal variation) (Daniel et al. 2018; Katzfey et al. 2020), but the relationship in other (less urbanised) regions as well as the exact mechanisms of the feedback are unclear | |
| Wellbeing and biodiversity | Air quality | Transport as well as waste heat from buildings contribute significantly to air quality deterioration. Air pollution acts as a greenhouse gas to trap urban heat, leading to a feedback loop between temperature and air quality |
| Vegetation and biodiversity | Local warming and air pollution reduce the vegetation’s ability to provide ecosystem services (such as cooling) by interfering with its growth (Gunawardena et al. 2017). Additionally, local temperature changes affect the diversity of urban flora and fauna (enhancing the ability of invasive species to thrive as well as decreasing native species’ ability to adapt) | |
| Human health | Risk of mortality due to heat increases by between 1% and 3% per 1°C change in high temperature (Hajat & Kosatky 2010). Societal costs are tempered by population density, the general economic health of the city and the fraction of the elderly population, and further complicated by equity and social justice issues | |
| Carbon | Energy consumption | Building energy demand is decreased in winter (less heating) and increased in summer (more cooling) (Kolokotroni et al. 2010). The temporal differences in their peak occurrence may lead to greater carbon emissions depending on the electricity generation mix (Skelhorn et al. 2018). The configuration of buildings with respect to one another and the thermal properties of buildings and pavements will influence building energy demand in complex ways (cf. Futcher et al. 2018) |
| Water (quality and quantity) | Increases in water use (e.g. for irrigation) as well as runoff (due to paving and roads). Sealed surfaces also reduce water availability to absorb heat, leading to temperature changes. Rise in surface temperature affects water runoff temperature as well as chemistry, leading to a loss of water quality (Phelan et al. 2015) | |
| Economic impacts | Higher cooling loads (thus, higher energy use) and productivity losses have economic consequences. This is further exacerbated by air quality deterioration |
2. Causes
Cities tend to absorb more of the total available heat (i.e. solar radiation plus heat generated from human activities), thereby raising the urban air temperature. The way land is used and covered, the configuration (massing) of buildings relative to each other and in relation to streets, the thermal properties of building materials and pollution from human activities all add to the unique urban signature on local climate.
At street level, the height of buildings with respect to the width of streets (also known as the aspect ratio) and the direction of the wind with respect to the street layout determine the nature of air flow within resultant canyons. These influence both their temperature as well as their air quality. Differential heating of canyon walls (especially the windward walls) and the addition of roughness elements (such as awnings, protrusions and setbacks) in combination with an appropriate canyon aspect ratio (especially a square canyon, where the average height of buildings is equal to the width of street) could enhance street ventilation (Fellini et al. 2020).
The influence of urban as well as street-level parameters on local climate is dependent on the location of the city (the ‘latitude effect’). At lower latitudes with high levels of solar insolation (i.e. the amount of energy from the sun), street-level conditions are less likely to be affected by building shading. At higher latitudes, the effect of solar insolation is highly dependent on the geometry of building forms. Street layout (e.g. diagonal streets versus a grid pattern oriented along the cardinal directions) add further complications. Urban density—whether induced by ‘vertical’ parameters such as the floor area ratio (FAR) or facade area as indicated by the facade-to-site ratio, or ‘horizontal’ density as indicated by plan area density (PAD) that indicates the extent of plot coverage—also influences the local climate (Chatzipoulka & Nikolopoulou 2018). High horizontal density would lead to stronger urban climate anomaly in winter (Table 1), while an increase in vertical density would result in an intense summertime urban heat island (UHI) (Salvati et al. 2019).
Planners and designers may be able to influence the horizontal density (the compactness of an urban arrangement) and the vertical density (the height of buildings as well as the efficiency with which the built volume is enclosed by the building envelope). These could be used to enhance local thermal comfort at street level.
Figure 1 summarises these interactions at both the street and citywide scales to highlight the planning controls that could be used to ameliorate the negative consequences of urban climate. Street geometry, built form, vegetation and the thermal properties of materials are the key levers to control urban climate at local scales. The use of these need to be context specific and wider questions relating to urban activities, land use and functions should also be considered (Jamei et al. 2016). Human thermal comfort depends not only on air temperature but also on other factors such as wind, solar reflectance and humidity (Heris et al. 2020). Thus, urban climate mitigation needs an integrated approach that addresses all local climate conditions simultaneously.
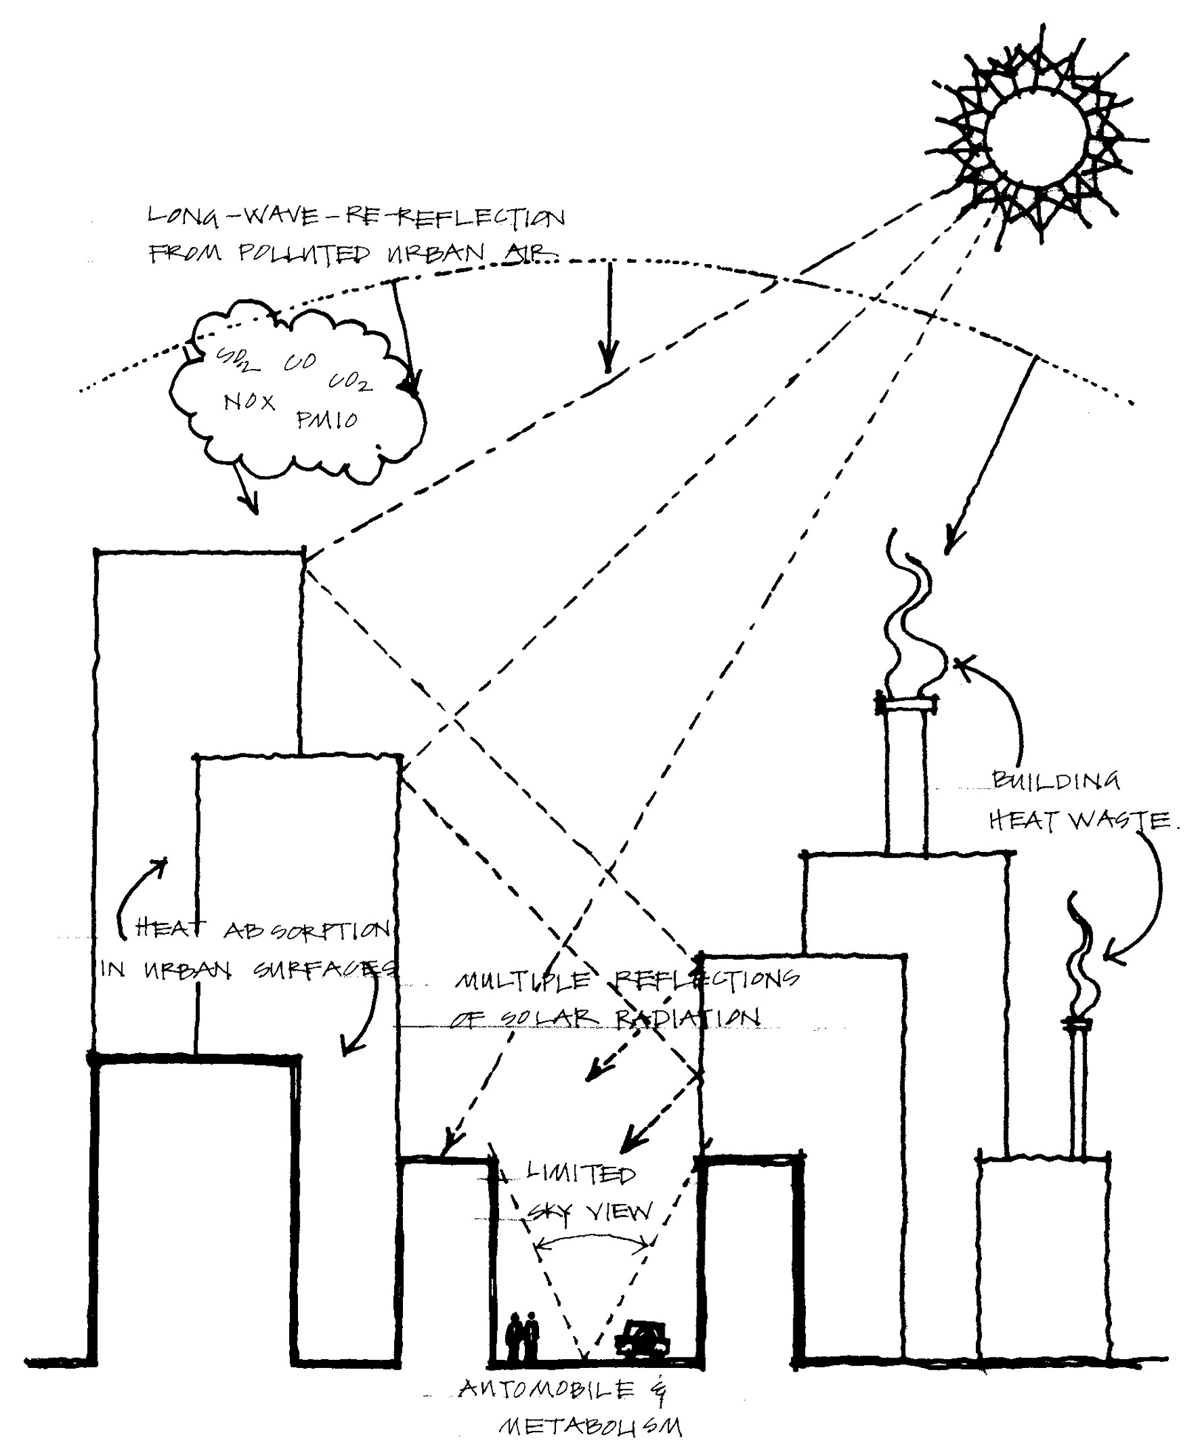
Figure 1
Summary view of the factors affecting the urban climate.
Source: Emmanuel (2005).
3. Approaches to mitigation
Attempts to mitigate the negative consequences of urban climate need to consider the questions of WHAT we want to change as well as WHERE we want to achieve this. In terms of the ‘what’ question, the goals of mitigation options can be grouped into three:
Climate improvement: temperature control to manage heatwaves and mitigate overheating, reduce interference with humidity and precipitation.
Health and wellbeing: thermal comfort and air quality enhancement; health, productivity and comfort; and improvements to biodiversity.
Carbon management: efficiency enhancement in energy and water use.
Tools and approaches to achieve these at scale are three-dimensional urban form, nature-based solutions (NbS) and the manipulation of the surface properties of buildings.
In terms of urban form, volumetric compactness (horizontal density), aspect ratio and form factor (vertical density), plot surface, openness to sky (as given by the sky view factor and distance to the nearest wall), and land cover types (especially hard surfaces that act as heat sources or soft surfaces that act as heat sinks) are all important for mitigating the negative consequences of urban climate (Giridharan & Emmanuel 2018). The presence of open spaces, the shape of building envelopes and the symmetry of the street further add to local-level (at the street scale) thermal comfort variations during the day (Guo et al. 2019).
Solar geometry dictates the prioritisation of streets and facades. East–west canyons receive more direct sun than north–south canyons and therefore solar radiation falling on eastern and western facades has the most impact on the microclimate. Its impact on north and south facades makes negligible contributions to pedestrian thermal comfort (Taleghani et al. 2021).
The NbS can also be applied to urban climate mitigation, including green (vegetation) and blue (water) infrastructures. The evapotranspiration-based cooling influence of both green and blue space is critical to the lower atmosphere in cities (i.e. the space from ground up to the average height of roofs—the ‘urban canopy layer’). The magnitude and spread of cooling by NbS depends on the size, spread, distribution and geometry of such solutions. Solitary large parks offer minimal cooling across large areas (Gunawardena et al. 2017), whereas a more distributed provision of green spaces spreads the cooling benefit more widely. However, city-scale cooling is mainly derived from the increased surface roughness of green space (i.e. improved convection efficiency) rather than evaporation (Gunawardena et al. 2017). Blue space cooling during the day can be substantial, but there is a nocturnal warming penalty. When both green and blue spaces are employed together, they can offer many synergistic ecosystem benefits, including cooling (Gunawardena et al. 2017).
For thermal comfort in the streets and neighbourhoods (as opposed to mere air temperature at the street level or across the city as a whole), trees in combination with buildings, grass verges against paved surfaces, and aligning the streets along predominant wind directions can all help to mitigate thermal discomfort in summer (Kleerekoper et al. 2017) without a significant wintertime penalty. In terms of ‘efficient’ positioning of trees, the north-east side of a north-west to south-east street or the north side of an east–west canyon is more useful while their positioning in north–south or north-east to south-west street canyons is more flexible (Chatzidimitriou & Yannas 2017).
Building envelopes provide the third set of urban climate mitigation possibilities. The choice of materials depends on street orientation (Taleghani et al. 2021). A high albedo (i.e. high solar reflectance) enables heat to be quickly radiated back into the atmosphere (Hoverter 2012). High-albedo roofs are widely used in the US (so-called ‘cool roofs’), where a combination of building codes, grant programmes and utility rebates are deployed to reduce both the building energy needs as well as urban air temperature. However, there are uncertainties related to the value for money of the high-albedo approach at city scales as opposed to energy savings to individual buildings (Pomerantz 2018).
The final question to be answered in urban climate mitigation is WHERE interventions should be attempted. The scale of interventions could either be macro (city wide) or micro (neighbourhoods to single street blocks). The former is more beneficial in terms of climate improvement and carbon management, whereas the latter has more immediate health and wellbeing benefits. All three approaches (urban form, NbS and building surfaces) are amenable to both scales.
3.1. Comparative benefits of mitigation approaches
Both urban form and NbS could provide shading that leads to improved thermal comfort as well as improved ventilation. Both the shading effects as well as the influence of air ventilation are useful to reduce surface temperature (Peng et al. 2017). While urban form has the ability to promote/hinder shading and ventilation, trees provide additional ‘non-climate’ benefits (such as CO2 sequestration, oxygen generation, pollutant removal, and recreational and amenity benefits) (Cheung & Jim 2018). Their location and spacing with respect to street geometry are important street design considerations.
In terms of NbS versus surface thermal properties, a city-wide increase of albedo would not be as effective at lowering the average ambient temperature when compared with green (vegetated) surfaces (Santamouris 2014). In sunny climates, reflective roofs present an important advantage, while in moderate and cold climates vegetative roofs present higher benefits. Additionally, weatherisation is a serious problem for reflective surfaces. High levels of reflective surfaces in urban areas (i.e. albedo > 0.3) are impractical (maintenance difficulties due to air pollution and precipitation as well as excessive glare). The installation of reflective roofs on high-rise buildings is unlikely to make much impact on urban climate. A practical level of albedo improvement (up to 0.3) with a moderate level of green cover (up to 20% of the urban surface) has the greatest potential to improve the urban microclimate (Yuan et al. 2017).
4. Urban climate mitigation in practice
Practical approaches to mitigate the negative consequences of urban climate are emerging around the world in terms of mapping and analytical tools as well as planning codes (Table 2).
Table 2
Practical tools for urban climate mitigation.
| APPROACH | DESCRIPTION | INTENDED USERS | POINT OF APPLICATION |
|---|---|---|---|
| Urban climate mapping | Urban climate mappings (UCMaps) consist of a UC-AnMap, which analyses climatic, geographical and planning information in map form, and a UC-ReMap, which develops planning instructions from an urban climatic point of view (see Ren et al. 2011 for a review). Useful technical standards exist for UCMap (VDI 1997) | Urban planners and urban designers | Masterplan, zoning plan and local development plan |
| Shading analysis | Optimising street canyon geometry to enhance the thermal comfort in public places offers several approaches to enhance shading. These include shadow-casting by buildings on public places and the ‘urban cool umbrella’ (https://www.castrucciarchitect.com/urban-cool-umbrella) that uses street furniture to enhance shading in public places | Urban designers, building designers and building services engineers | Street design and preliminary planning approval for buildings |
| Ventilation analysis | Following from the Severe Affective Respiratory Syndrome (SARS) epidemic in 2003, the Hong Kong government promulgated air ventilation assessment (AVA) regulations (Hong Kong Government 2006) to monitor the air flow effects of buildings. AVA uses the velocity ratio as an indicator of wind availability | Urban planners and public health officials | Masterplan, urban regeneration and neighbourhood development plan |
| Planning codes as toolkits to manage urban heat | Several heat island-mitigation toolkits and codes (including mandates and incentives) exist in the US to facilitate decision-making at local government levels. These include the ‘cool roofs’ programme (enhancing roof albedo); ‘green roof’ (intensive and extensive roof green cover); ‘cool pavements’ (similar to cool roofs, but for pavements) and urban forestry regulations (see Hoverter 2012 for a review) | Urban planners, building designers, building services engineers and public health officials | Streetscape design and building design |
Applying current knowledge about urban climate to urban planning requires the accurate characterisation of land use/land cover and the functions of urban neighbourhoods. Typically, planning considers urban space in terms of discrete sets of urban form or land-use-based zoning, or a combination thereof. However, amelioration of urban climate calls for an integrated, goal-oriented approach (climate improvement, health and wellbeing, or carbon management) to better describe the urban form and to deal with the intrinsic complexity of urban spaces (Vanderhaegen & Canters 2017). The recently introduced Local Climate Zone (LCZ) approach (Stewart & Oke 2012) provides a useful method to combine both the form and function of urban spaces from a local climate point of view.
5. Action points
Planning approaches to urban climate mitigation should be seen as part of the wider, climate change vulnerability actions. The mapping of heat vulnerability provides a way to couple surface UHI measures with socioeconomic indicators of vulnerability. Figure 2 provides a framework to tackle heat vulnerability and bring adaptation responses to global climate change together with urban climate-mitigation measures to reduce risks at both scales simultaneously.
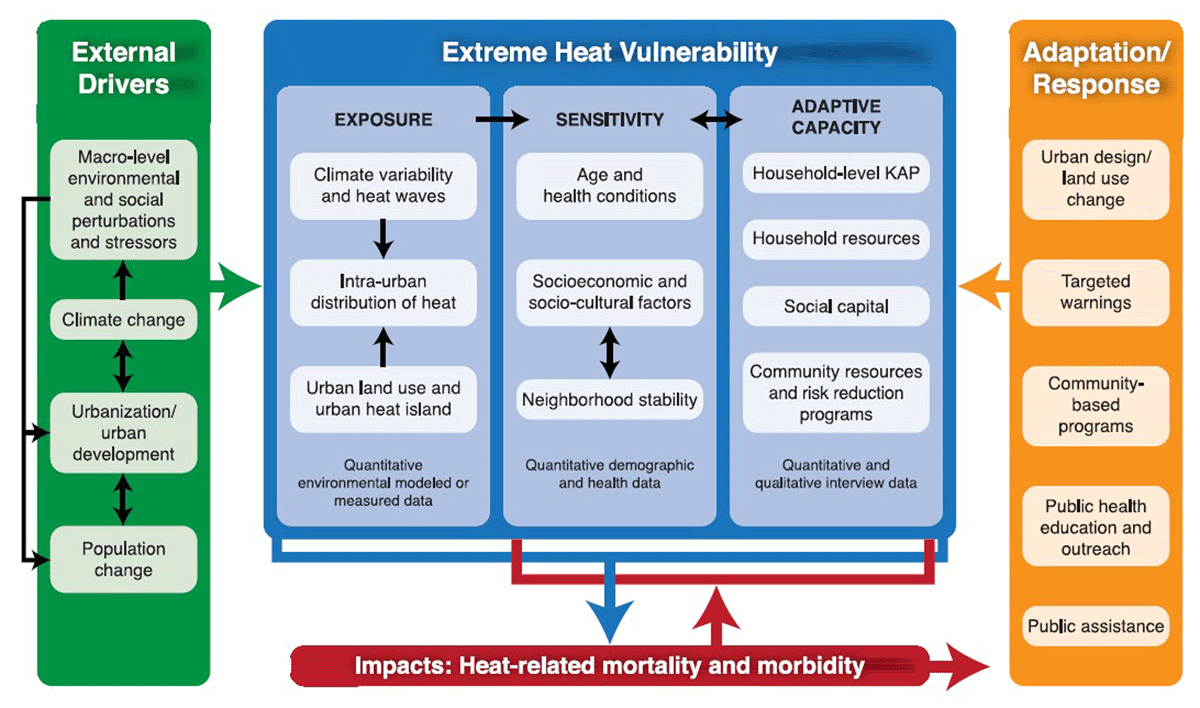
Figure 2
Heat vulnerability framework.
Source: Wilhelmi & Hayden (2010).
Having mapped the heat vulnerability, planning action could focus on enhancing heat resilience. Heat resilience in this context refers to urban planning, building design, public health and infrastructure provision to increase the quantity and quality of coping strategies. Table 3 provides a policy framework indicating four areas where action is needed for such heat resilience.
Table 3
Action areas for an urban heat resilience policy.
| POLICY AREAS | ACTIONS |
|---|---|
| Public health | Hotspot mapping; heat-related workload scheduling; and heat-related health and safety management |
| Building regulations | Heat stress-resistant building design guidelines; building morphology and form controls; control of building surfaces/material properties; financial incentives; include heat stress resistance in building energy certification; demonstration buildings |
| Planning actions | Cool refuges/public places for adaptation; heat mapping as part of an urban planning framework; urban climate mapping; ventilation and shadow assessment; open space/nature-based solutions (NbS) as part of the planning framework, inclusion of future climate scenarios for current regulations and practices |
| Infrastructure and services | Enhance infrastructure demand monitoring and modelling to account for heat stress; adopt public transport infrastructure to heat stress; review water and electricity infrastructure to manage heat-related demand |
[i] Source: Adapted from Hatvani-Kovacs et al. (2018) and based on discussions in this Briefing Note.
Global climate change will impose additional pressures on urban climates. This is likely to result in an increasing frequency and length of warm events, significantly influencing how the local climate is experienced by urban dwellers. The ‘southward shift’ of climate in cities provides an easy way to understand the urban climate of the future. Cities in the Northern Hemisphere, especially in Europe, follow a north-to-south transect at about 3–13 km/year. This average southward velocity is expected to double throughout the 21st century (Rohat et al. 2018). It is therefore possible for ‘northern’ cities to learn planning and urban design lessons from cities further south, including the benefits of shading, more compact development and more explicit use of NbS.
Such lessons should focus on climate-sensitive urban design, integrated land use and urban densification. Using the action areas highlighted in Table 3, planning authorities could establish a set of context-specific principles in terms of the three ‘goals’ of urban climate mitigation (see ‘Approaches to mitigation’) at different levels of granularity (site, street, neighbourhood, city).
Not all lessons from warm places are positive. Special mention must be made of the urban densification pressures (both horizontal and vertical density) that can exacerbate the urban microclimate anomaly. The heat vulnerability framework in Figure 2 shows a way to balance the drivers and responses to enhance resilience to heat and therefore urban liveability in the face of climate change.
Glossary
| Albedo | Fraction of solar radiation reflected from a surface |
| Aspect ratio | Ratio between the width of a street and the average height of buildings that abut it |
| AVA | Air ventilation assessment |
| Cool roof | A high-albedo roof |
| FAR | Floor area ratio |
| Form factor | Measure of vertical density |
| NbS | Nature-based solutions |
| PAD | Plan area density |
| SARS | Severe Affective Respiratory Syndrome |
| UC-AnMap | Urban climate analysis map |
| UC-ReMap | Urban climate recommendation map |
| UHI | Urban heat island |
| Urban canopy layer | Space from the ground up to the average height of roofs |
| Urban cool umbrella | Shadow-casting by buildings on public places |
| Volumetric compactness | Horizontal density |
Competing interests
The author has no competing interests to declare.