
Fig. 1.
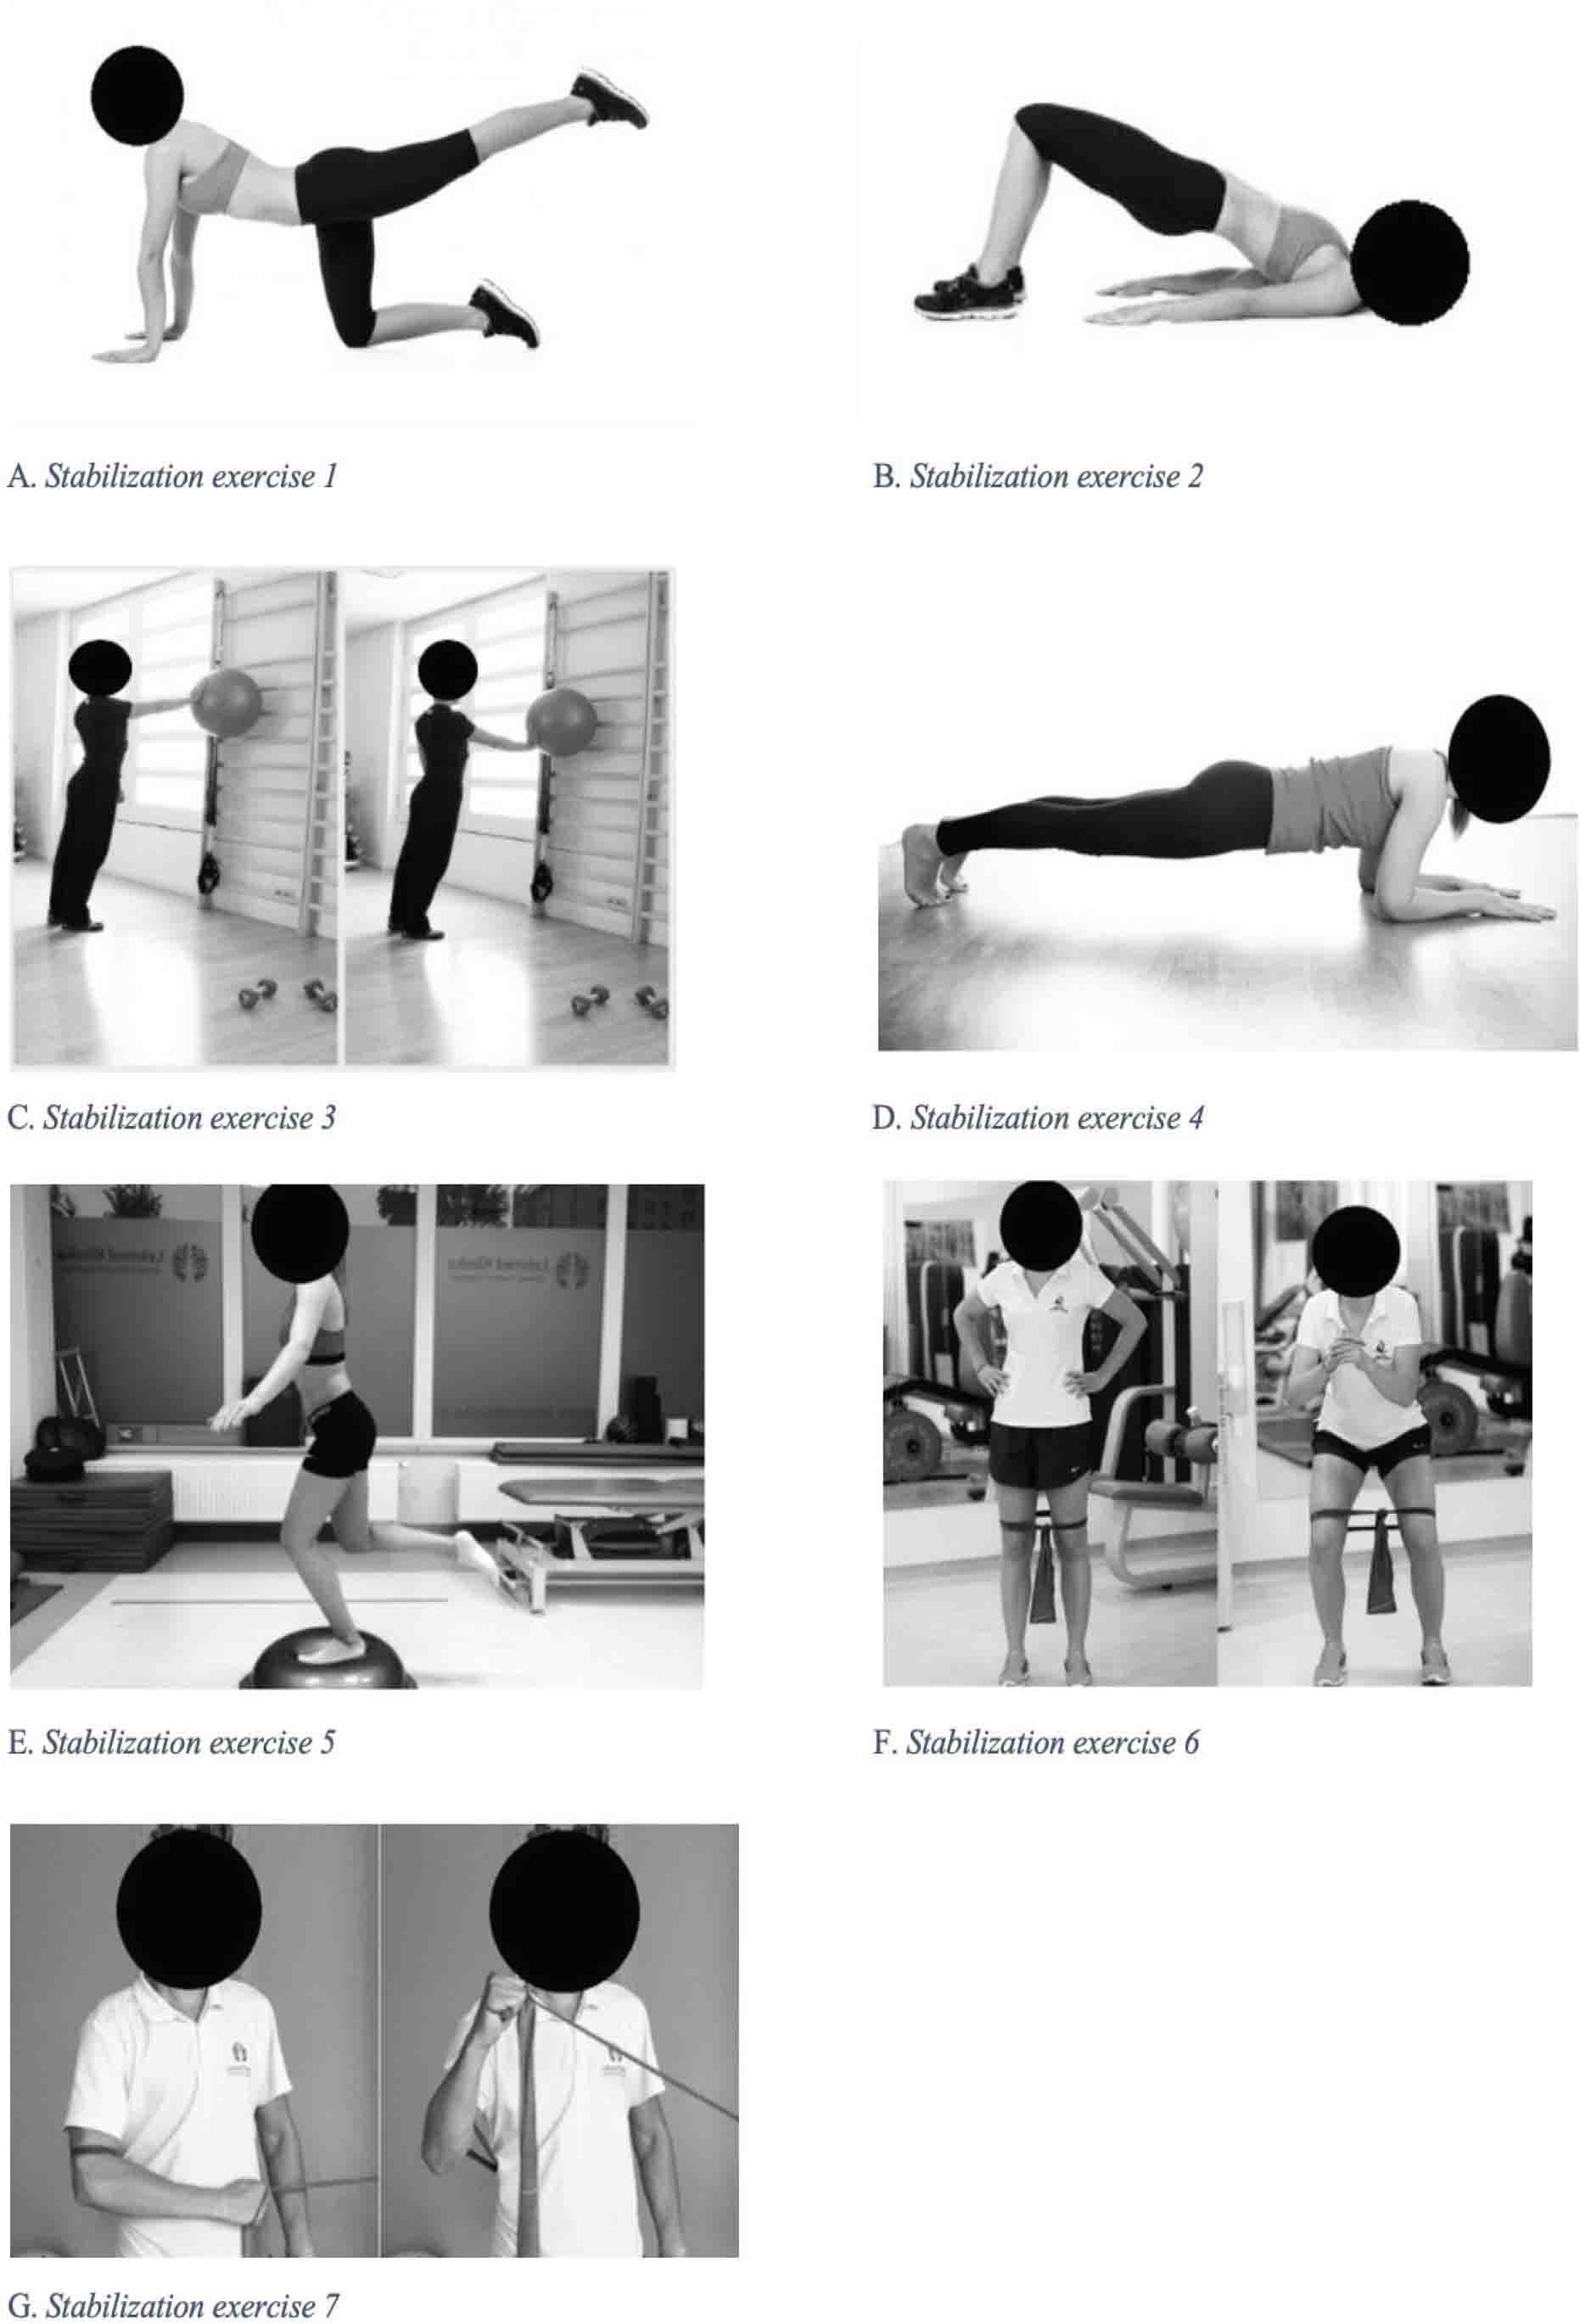
Fig. 2.
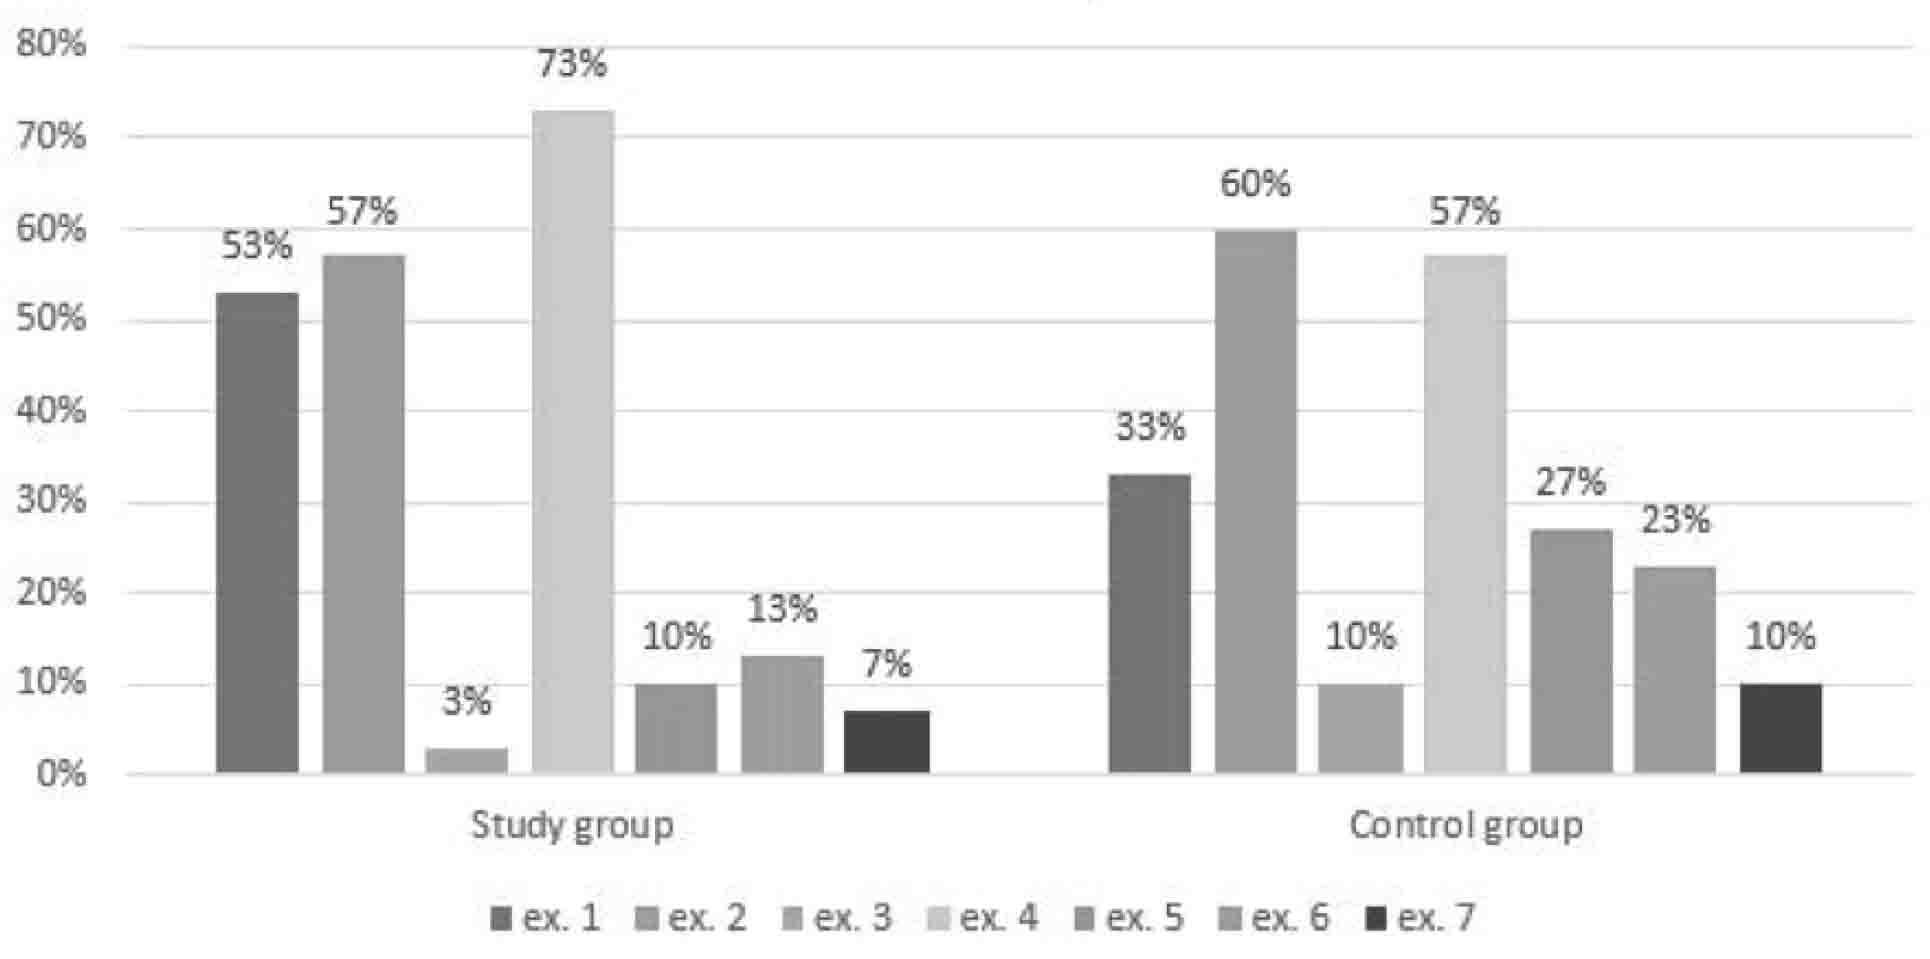
Fig. 3.
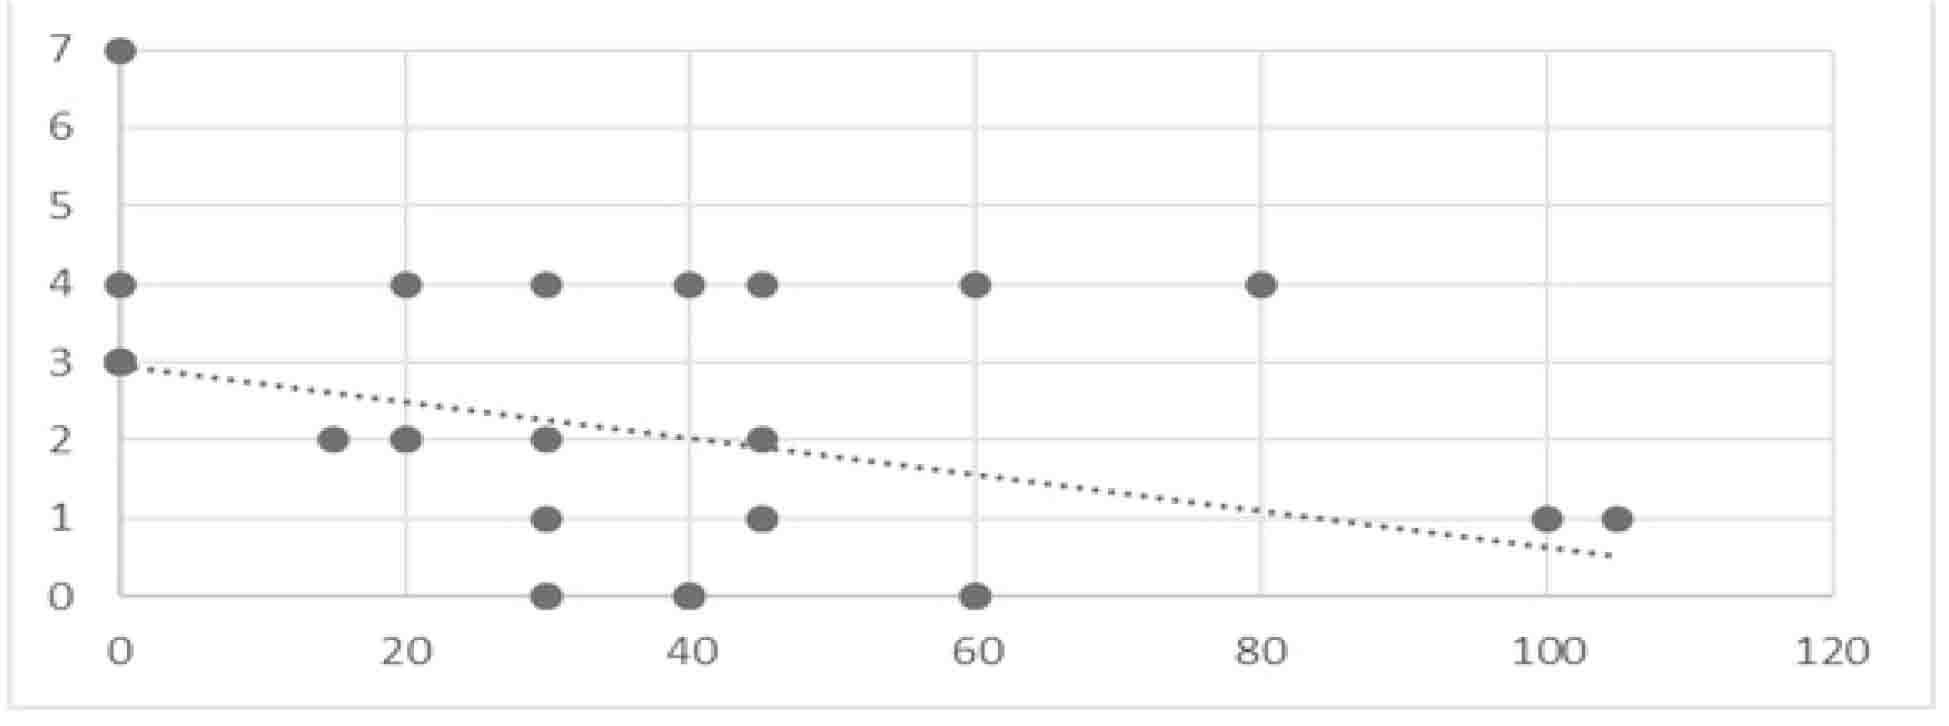
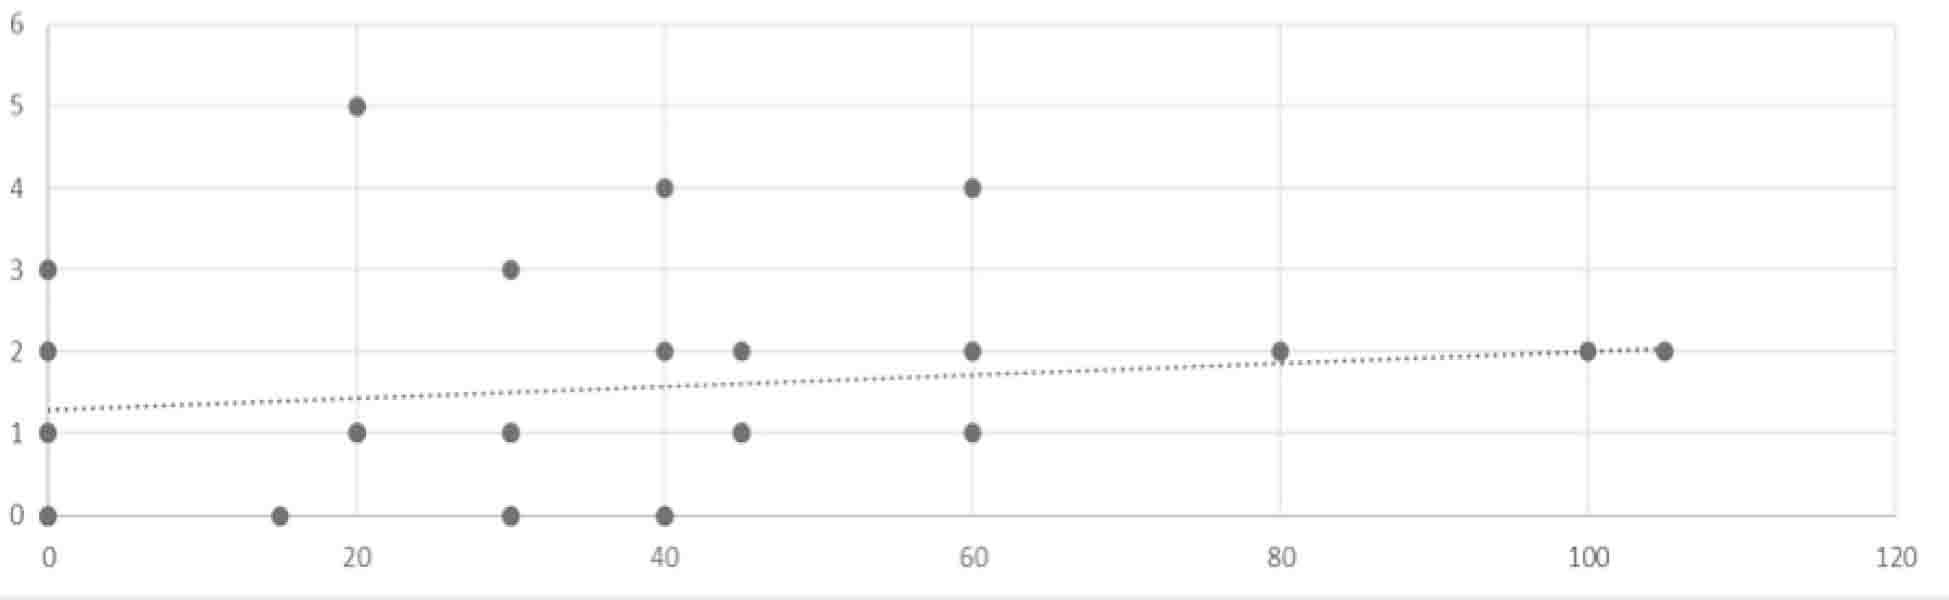
Fig. 4.
Relation between the average time spent weekly on the exercises and the frequency of pain occurrence in study group
| Pearson linear correlation coefficient | -0.38 |
|---|---|
| Student’s t-test value | -2.16 |
| p-value | 0.04 |
Body parts affected by the injuries suffered by study and control group subjects
| Location of injury | Study group | Control group | ||
|---|---|---|---|---|
| No. of subjects | % | No. of subjects | % | |
| Lower extremity injuries | 40 | 89% | 6 | 55% |
| Shoulder joint injuries | 3 | 7% | 1 | 9% |
| Other | 2 | 4% | 4 | 36% |
| Total | 45 | 100% | 11 | 100% |
Description of study and control group
| Age | Height | Body mass | BMI | |
|---|---|---|---|---|
| Study group | avg. 24.9 yrs sd. 2.1 | avg. 1.7 m sd. 0.1 | avg. 60.1 kg sd. 7.7 | avg. 20.5 sd. 1.4 |
| Control group | avg. 25 yrs sd. 3.5 | avg. 1.7 m sd. 0.1 | avg. 58.5 kg sd. 10.3 | avg. 20.2 sd. 1.8 |
| Test statistic | -0.1 | 0.6 | 0.7 | 0.7 |
| p-value | 0.2 | 0.4 | 0.1 | 0.4 |
Correlation between the injuries of dancers and BHJS
| Study group | Control group | |
|---|---|---|
| Pearson linear correlation coefficient | 0.45 | -0.10 |
| Student’s t-test value | 2.63 | -0.54 |
| p-value | 0.02 | 0.34 |
Types of injuries suffered by study and control group subjects
| Type of injury | Study group | Control group | ||||||
|---|---|---|---|---|---|---|---|---|
| HS diagnosed | HS not diagnosed | HS diagnosed | HS not diagnosed | |||||
| No. of subjects | % | No. of subjects | % | No. of subjects | % | No. of subjects | % | |
| Fractures | 3 | 8% | 0 | 0% | 2 | 67% | 4 | 57% |
| Joint injuries | 10 | 26% | 0 | 0% | 1 | 33% | 1 | 14% |
| Muscle injuries | 21 | 53% | 1 | 100% | 0 | 0% | 2 | 29% |
| Other | 5 | 13% | 0 | 0% | 0 | 0% | 0 | 0% |
| Total | 39 | 100% | 1 | 100% | 3 | 100% | 7 | 100% |