
Fig. 1.
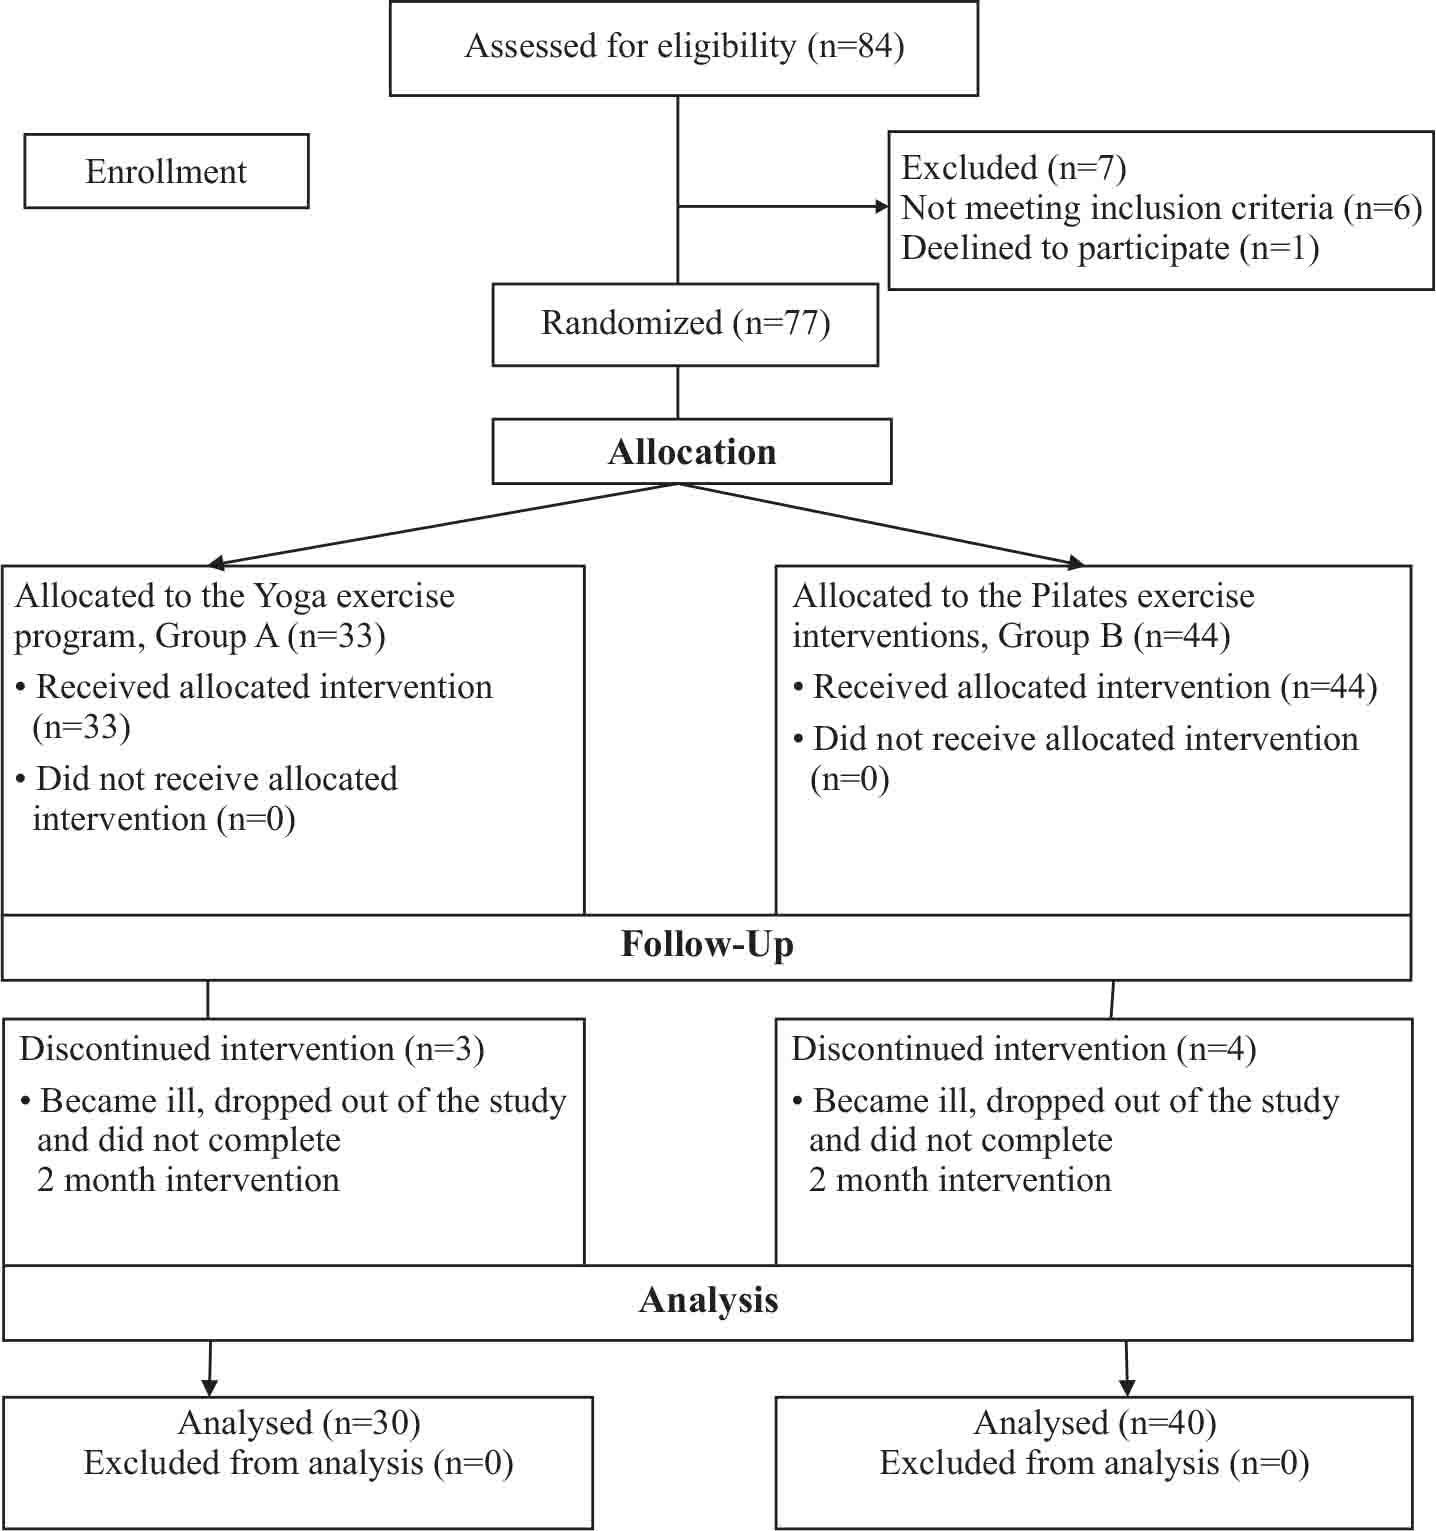
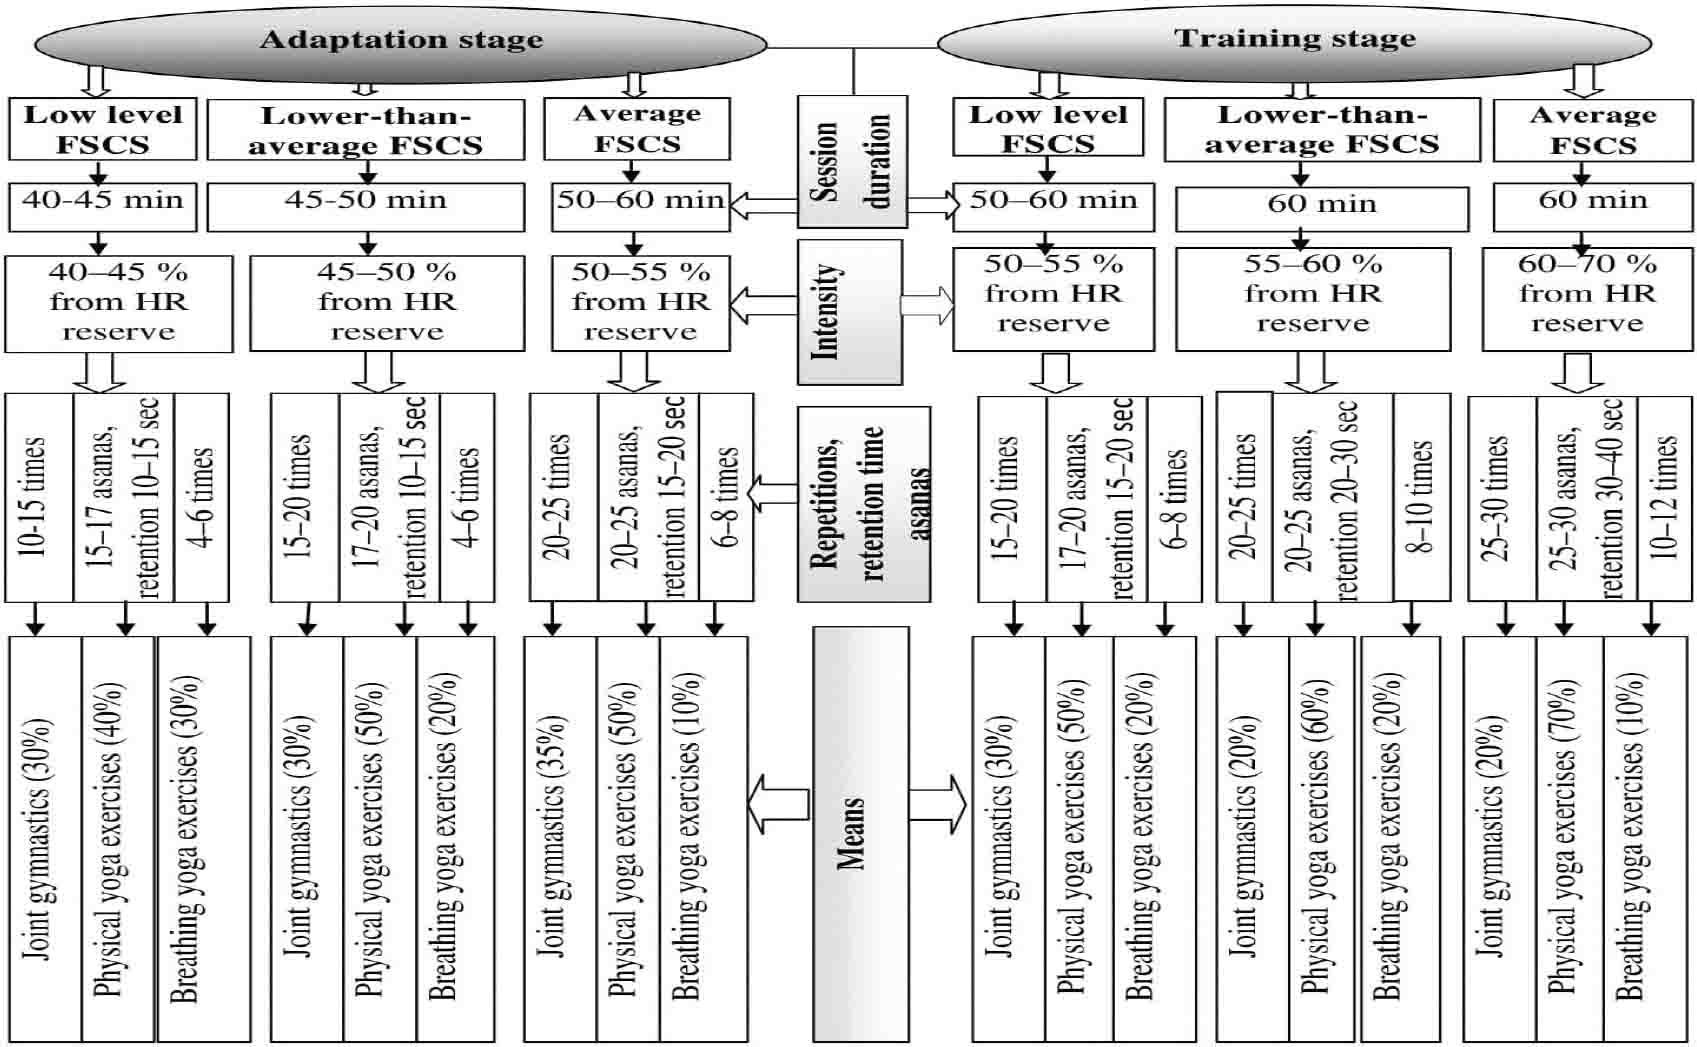
Fig. 2.
Comparison of HRV indicators between the group A and group B during outpatient rehabilitation
| Indicator | six months | twelve months | ||
|---|---|---|---|---|
| group A | group B | group A | group B | |
| SDNN (ms) | 23.60±1.04 | 23.36±1.07 | 26.72±1.17 | 23.44±1.19• |
| RMSSD (ms) | 21.64±1.18 | 17.77±1.05* | 23.50±0.99 | 20.16±1.08• |
| TP (ms2) | 541.96±45.82 | 545.71±30.36 | 720.69±61.93 | 550.36±41.02• |
| VLF (ms2) | 160.32±14.19 | 211.01±30.54 | 223.05±27.93 | 150.73±32.46 |
| LF (ms2) | 179.92±21.61 | 191.61±20.50 | 256.30±27.47 | 227.36±36.43 |
| HF (ms2) | 199.29±21.67 | 143.09±14.74* | 236.56±22.57 | 172.23±20.65• |
| LF/HF (c.u.) | 0.98±0.10 | 1.69±0.31* | 1.35±0.19 | 1.49±0.22 |
| Si (c.u.) | 265.36±17.22 | 290.72±19.86 | 224.56±18.66 | 281.05±17.69• |
Dynamics of HRV indicators in group A during outpatient rehabilitation
| Indicator | Baseline data | Duration of rehabilitation | |
|---|---|---|---|
| six months | twelve months | ||
| SDNN (ms) | 21.19±1.08 | 23.60±1.04** | 26.72±1.17••• |
| RMSSD (ms) | 18.59±1.50 | 21.64±1.18 | 23.50±0.99•• |
| TP (ms2) | 440.91±42.08 | 541.96±45.82** | 720.69±61.93••• |
| VLF (ms2) | 113.29±18.02 | 160.32±14.19* | 223.05±27.93•• |
| LF (ms2) | 167.92±20.33 | 179.92±21.61 | 256.30±27.47•• |
| HF (ms2) | 158.96±22.44 | 199.29±21.67 | 236.56±22.57• |
| LF/HF (c.u.) | 1.82±0.33 | 0.98±0.10** | 1.35±0.19 |
| Si (c.u.) | 361.80±32.21 | 265.36±17.22** | 224.56±18.66•• |
Dynamics of HRV indicators in group B during outpatient rehabilitation
| Indicator | Baseline data | Duration of rehabilitation | |
|---|---|---|---|
| six months | twelve months | ||
| SDNN (ms) | 21.30±1.08 | 23.36±1.07 | 23.44±1.19 |
| RMSSD (ms) | 19.46±1.96 | 17.77±1.05 | 20.16±1.08 |
| TP (ms2) | 436.91±41.04 | 545.71±30.36* | 550.36±41.02 |
| VLF (ms2) | 98.74±12.35 | 211.01±30.54** | 150.73±32.46 |
| LF (ms2) | 161.94±14.96 | 191.61±20.50 | 227.36±36.43 |
| HF (ms2) | 173.79±32.76 | 143.09±14.74 | 172.23±20.65 |
| LF/HF (c.u.) | 1.82±0.25 | 1.69±0.31 | 1.49±0.22 |
| Si (c.u.) | 351.85±25.53 | 290.72±19.86 | 281.05±17.69• |
Sociodemographic and treatment-related characteristics of study participants
| Characteristics | Groups | p | ||
|---|---|---|---|---|
| A (n=30) | B (n=40) | |||
| Age, (M±SD) | 59.10±1.37 | 59.40±1.24 | >0.05 | |
| Race | White, n (%) | 29 (97%) | 38 (95%) | >0.05 |
| Black, n (%) | 1 (3%) | 2 (5%) | >0.05 | |
| Married/committed relationship, n (%) | 28 (93%) | 36 (90%) | >0.05 | |
| High school graduate, n (%) | 16 (53) | 20 (50%) | >0.05 | |
| College graduate, n (%) | 13 (43%) | 18 (45%) | >0.05 | |
| Post-graduate, n (%) | 1 (3%) | 2 (5%) | >0.05 | |
| Body mass index, kg/m2, (M±SD) | 24.11±0.38 | 24.20±0.44 | >0.05 | |
| Treatment | Radiotherapy, n (%) | 27 (90%) | 38 (95%) | >0.05 |
| Chemotherapy, n (%) | 3 (10%) | 2 (5%) | >0.05 | |
| Surgery type (mastectomy by Madden), n (%) | 30 (100%) | 40 (100%) | >0.05 | |
| Time since treatment completion, months (M±SD) | 5.13±2.87 | 5.13±2.79 | >0.05 | |
| Cancer Stage | Stage 1, n (%) | 9 (30%) | 14 (35%) | >0.05 |
| Stage 2, n (%) | 21 (70%) | 26 (65%) | >0.05 | |