
Figure 1
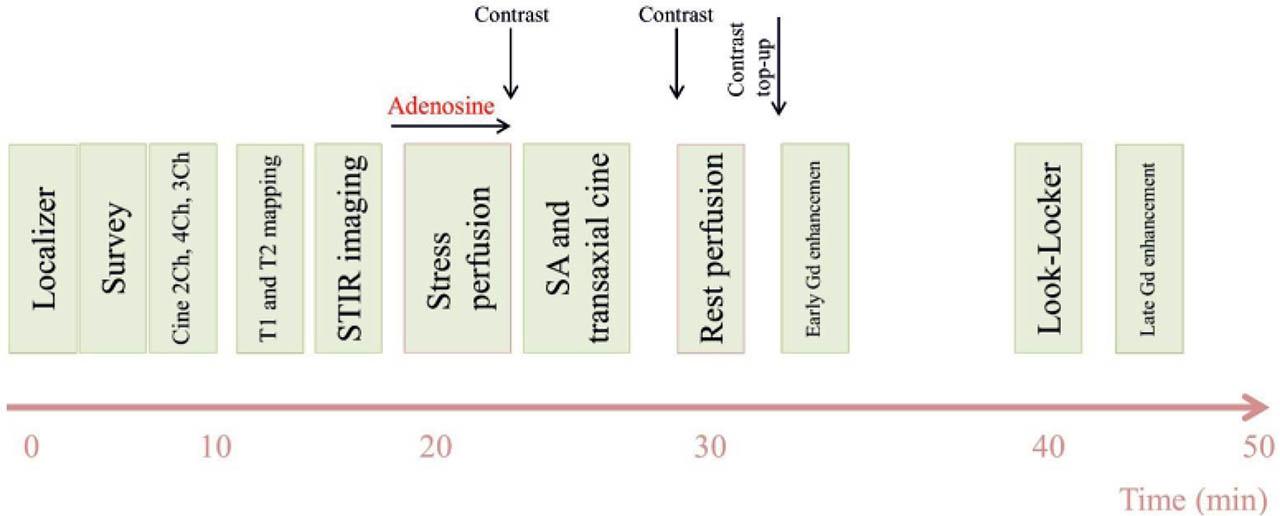
Figure 2
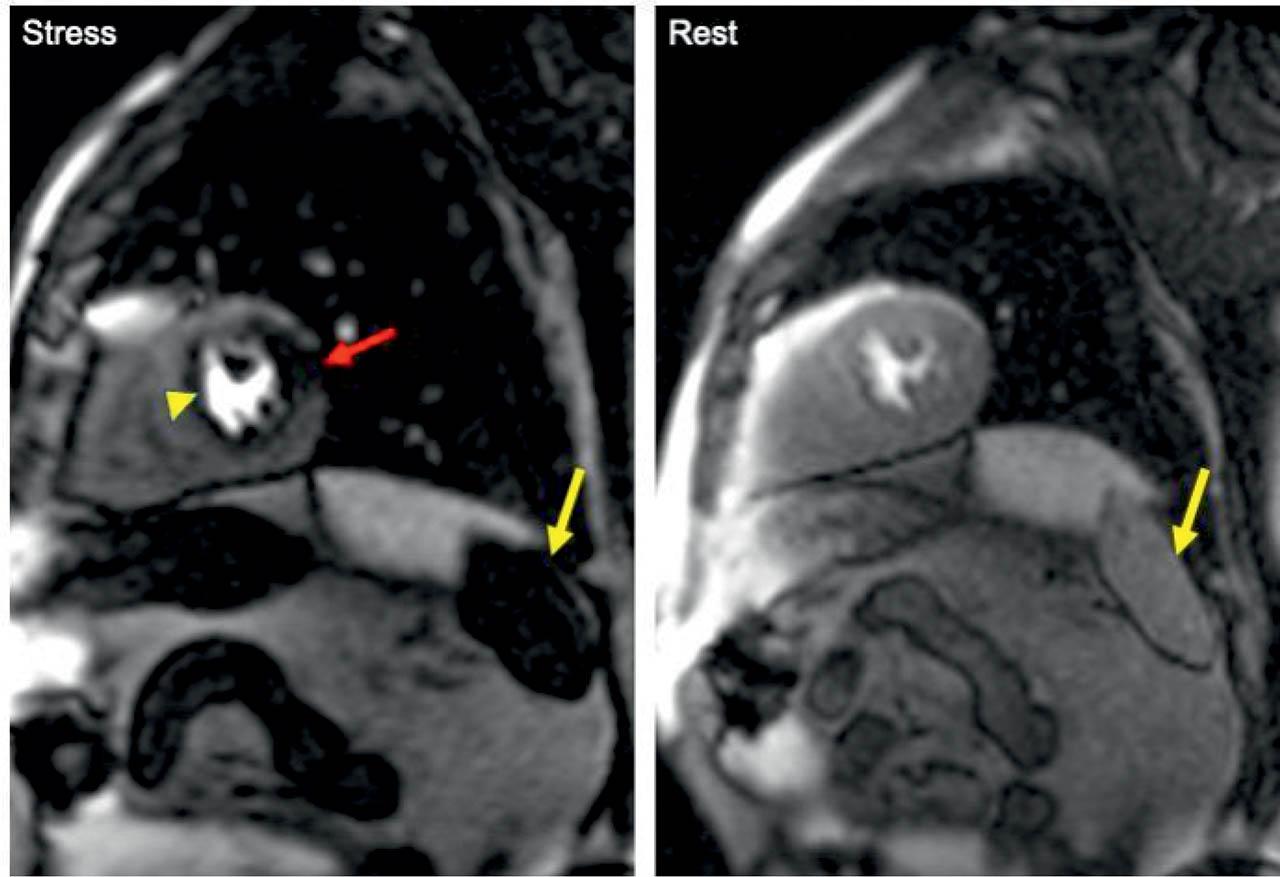
Figure 3
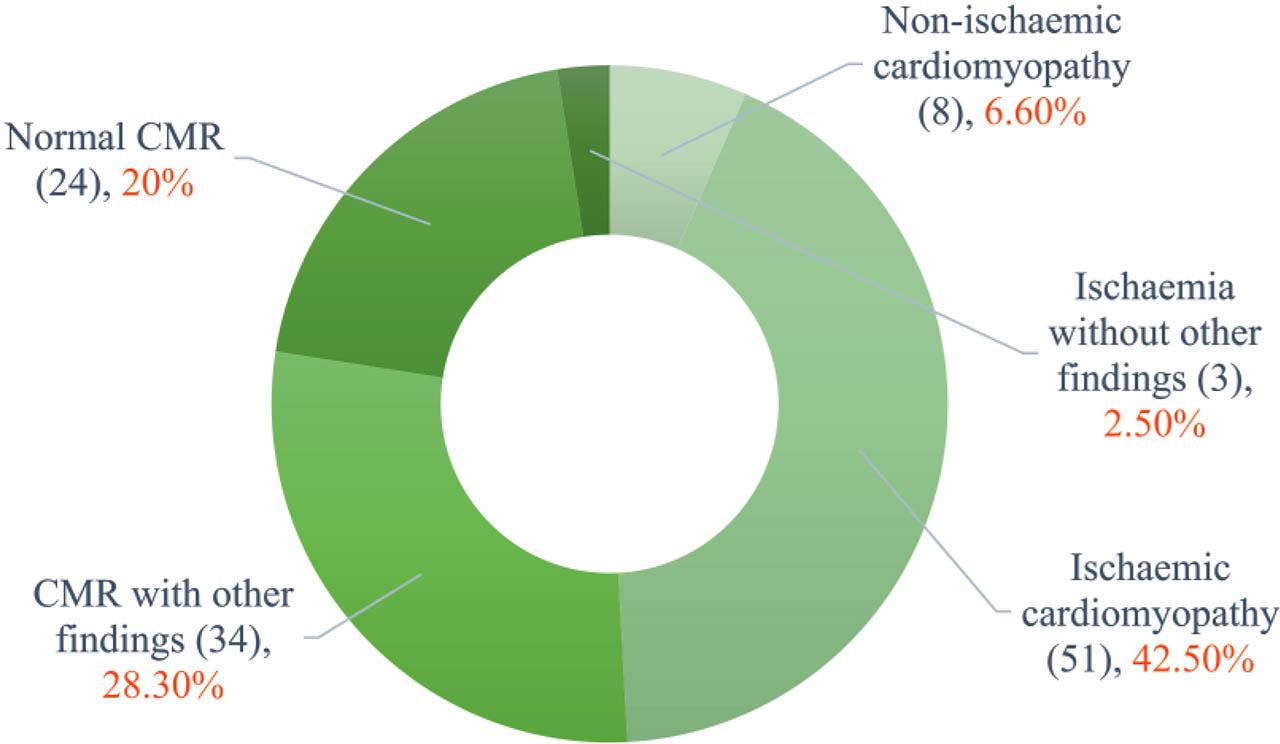
Figure 4
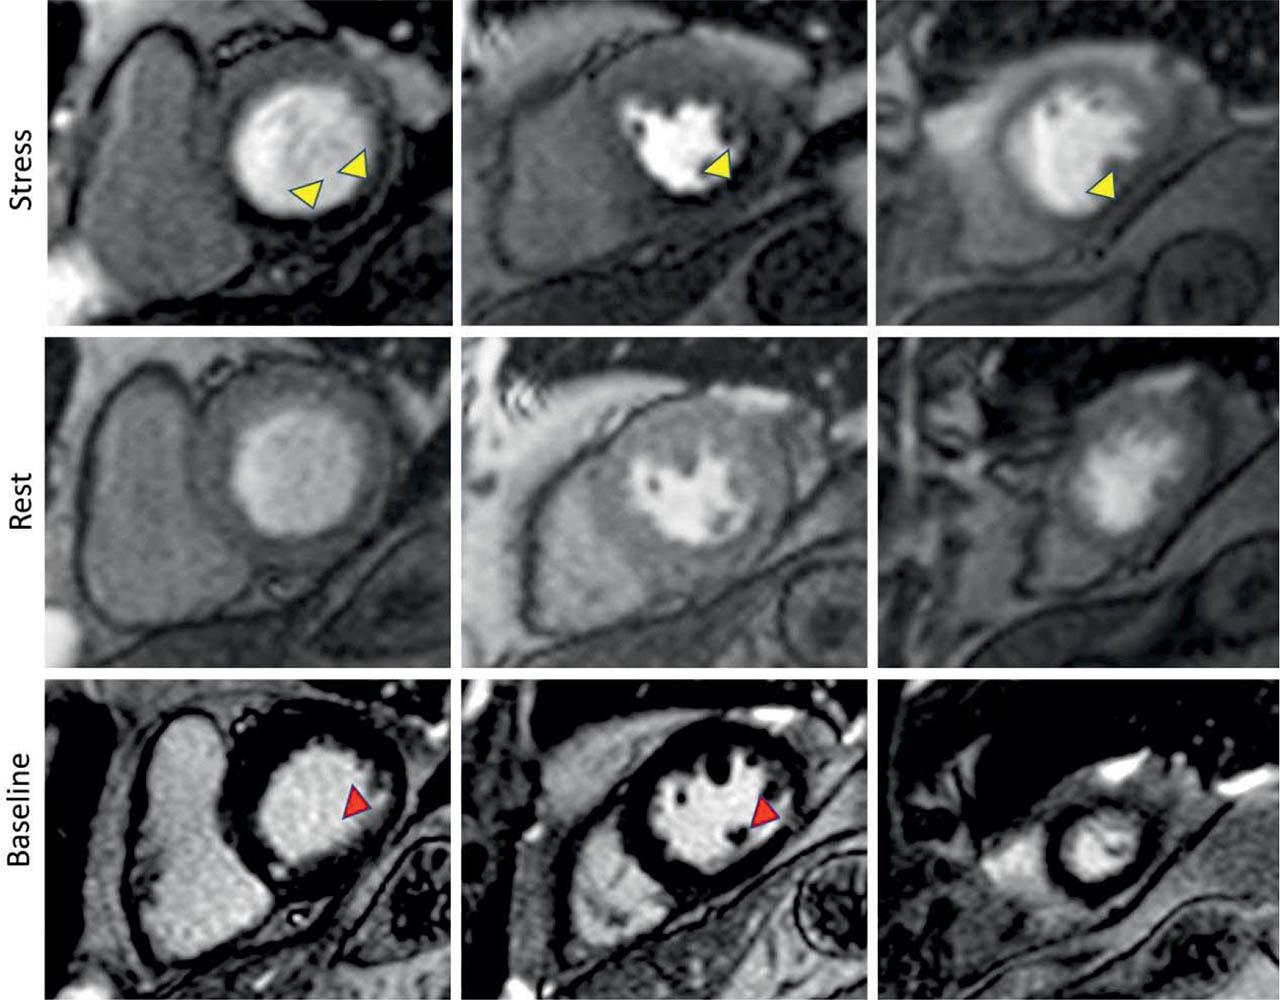
Figure 5
Figure 6
Clinical indications for which patients underwent stress perfusion CMR
| Clinical indication | Total (n=120) | Positive test | Negative test |
|---|---|---|---|
| Detection of ischaemia in patients with risk factors or atypical chest pain | 36 (30%) | 3 (8.33%) | 32 (88.88%) |
| Etiology of DCM | 4 (3.33%) | 1 (25%) | 3 (75%) |
| Detection of ischaemia in patients with history of MI or previous revascularisation | 51 (42.5%) | 11 (21.56%) | 40 (78,43%) |
| Detection of functional significance of intermediate lesions | 37 (30.83%) | 9 (24,32%) | 27 (72,97%) |
| Ventricular arrhytmia substrate detection | 5 (4.16%) | 0 | 5 (100%) |
Clinical end electrocardiography data of the analyzed patients
| Demographics (n=120) | |
| Age, years | 57 ± 11 |
| Men | 95 (79.1%) |
| BMI (kg/m2) | 28.9 ± 3.6 |
| Outpatient referral | 48 (40%) |
| Cardiovascular risk factors (data available for 75 patients) | |
| Hypertension | 53 (70.67%) |
| Hypercholesterolemia | 57 (76%) |
| Diabetes | 19 (25.33%) |
| Tobacco use | 33 (44%) |
| Median number of aggregated risk factors | 2 |
| Cardiovascular history | |
| Previous non-invasive ischaemia testing | 28 (23.33%) |
| Previous myocardial infarction | 51 (42.5%) |
| ICA before CMR | 77 (64.16%) |
Number of affected vessels on ICA
|
|
| History of PCI | 40 (33.3%) |
| History of CABG | 7 (5.83%) |
| ECG at the time of CMR | |
| Sinus rhythm | 113 (94%) |
| Atrial fibrillation | 7 (6%) |
| Extrasystoles | 8 (6.66%) |
| Narrow QRS | 106 (88.33%) |
| LBBB | 5 (4.16%) |
| RBBB | 9 (7.5%) |
Selected CMR findings
| General CMR findings | |
| Artifacts | 4 (3.33%) |
| Extracardiac findings | 34 (28,33%) |
| Efficient vasodilatory stress | 113 (94.16%) |
| Positive stress test | 21 (17.5%) |
| LV dimensions and function | |
| LV motion abnormalities | 44 (36,66%) |
| LV EDV (ml) | 188.35 ± 59.09 |
| LV EDVi (ml/m2) | 92,68 ± 29.13 |
| LV ESV (ml) | 87.12 ± 55.34 |
| LV SV | 100.78 ± 24.78 |
| LV EF | 56.87 ± 13.52 |
| LV myocardial mass (g/m2) | 56.74 ± 15.21 |
| Tissue characterization | |
| Oedema | 2 (1.66%) |
| Native T1 (ms) | 982.60 ± 151.20 |
| ECV (%) | 25.71 ± 2.51 |
| T2 (ms) | 46.06 ± 2.56 |
| Characterization of focal scars | |
| Scar present | 63 (52.5%) |
| Ischaemic scar | 49 (40.83%) |
| Non-ischaemic scar | 14(11.66%) |
Number of scars
|
|