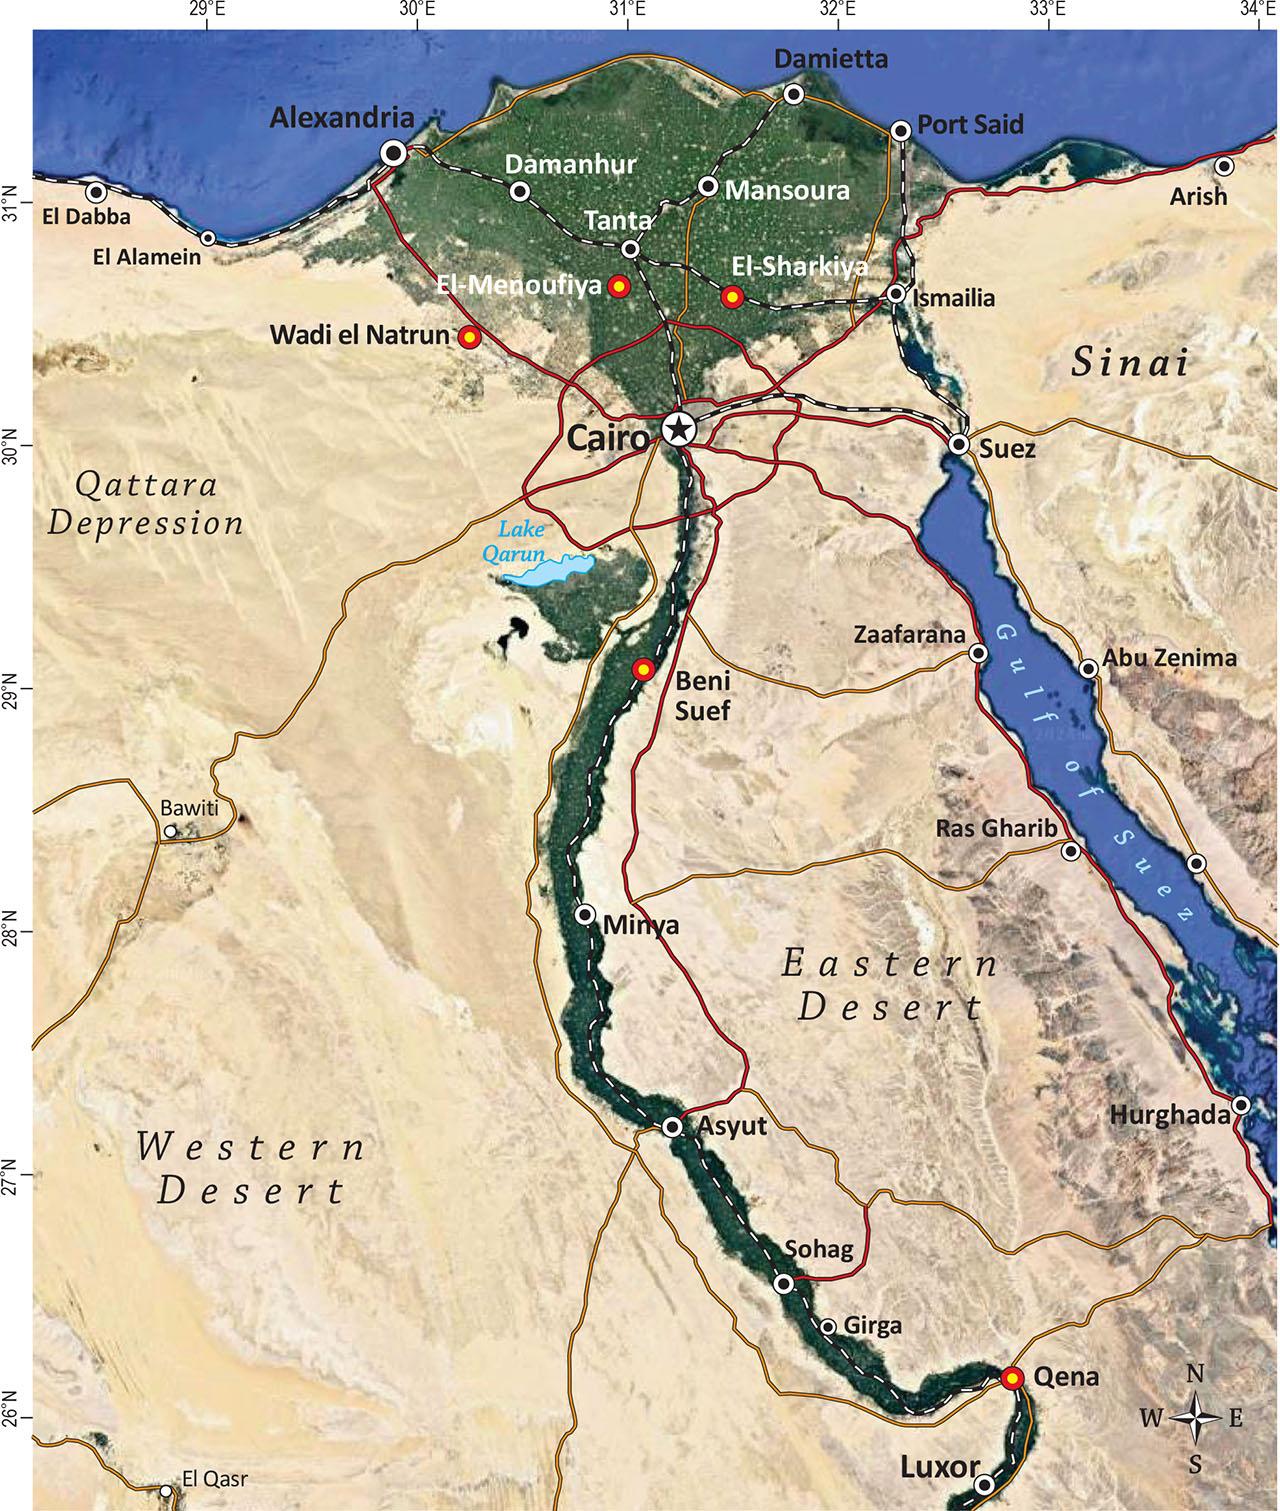
Have a personal or library account? Click to login
Importance of environmental factors and crop type on weed diversity associated with cereals in Egypt Cover

Importance of environmental factors and crop type on weed diversity associated with cereals in Egypt

Open Access
|Feb 2025

Figures & Tables

Figure 1:

Map with the five selected regions (governorates), represented by red dots.Slika 1: Zemljevid s petimi izbranimi območji (upravnimi enotami), prikazanimi z rdečimi točkami.

Figure 2:

Life form spectrum of weed vegetation associated with cereals in study areas. T = Therophytes, Cr = Cryptophytes, H=Hemicryptophytes, P = Phanerophytes, CH = Chamaephytes.Slika 2: Spekter življenskih oblik plevelne vegetacije v žitih na obravnavanih območjih. T = terofiti, Cr = kriptofiti, H = hemikriptofiti, P = fanerofiti, CH = hamefiti.

Figure 3:

Chorotypes of weed vegetation associated with cereals in study areas. M = Mediterranean, SA = Saharo-Arabian, Cosm = Cosmopolitan, IT = Irano-Turanian, Pal = Paleotropical, Cult = Cultivated, Pan = Pantropical, Oth = Other.Slika 3: Horotipi plevelne vegetacije v žitih na obravnavanih območjih. M = Sredozemski, SA = Saharo-Arabski, Cosm = kozmopolitski, IT = Irano-Turanski, Pal = Paleotropski, Cult = Gojeni, Pan = Pantropski, Oth = Ostali.

Figure 4:

Species richness (species number per relevé) in different crops, bioclimatic regions and seasons. Box-plots: horizontal line represents median, box’s upper and lower borders 1st and 3rd quartiles, vertical line represent the highest and lowest value excluding outliers and dots the outliers. Letters display pairwise treatment comparisons with Kruskal-Wallis test and Games-Howell posthoc test.Slika 4: Vrstna pestrost (število vrst na vegetacijski popis) v različnih poljščinah, bioklimatskih regijah in letnih časih. Škatle z brki: vodoravne črte predstavljajo mediano, zgornji in spodnji rob škatel predstavljata prvi in tretji kvartil, navpična črta največjo in najmanjšo vrednost brez osamelcev, točke predstavljajo osamelce. Črke predstavljajo parne primerjave s Kruskal-Wallisovim testom in Games-Howell posthoc testom.

Figure 5:

Beta diversity along three gradients (bioclimatic regions, crops and seasons). Sørensen index was calculated by bootstrap method. Letters display pairwise treatment comparisons with Kruskal-Wallis test and Games-Howell posthoc test.Slika 5: Beta diverziteta vzdolž treh gradientov (bioklimatsko območje, kulturna rastlina, letni čas). Sørensenov indeks smo izračunali z metodo bootstrap. Črke predstavljajo parne primerjave s Kruskal-Wallisovim testom in Games-Howell posthoc testom.

Figure 6:

DCA analysis of plots and explanatory variables passively projected onto the diagram of weed community in Egypt. Numerical variables are presented as blue arrows, categorical variables as centroids in red text and sampling plots as grey points. Eigenvalues of first two axes: 0.5077 and 0.3183. Abbreviations: CS – coarse sand, FS – fine sand, S.C – silt and clay, OM – organic matter, pH – soil reaction, EC – electrical conductivity.Slika 6: Analiza DCA popisnih ploskev in razlagalnih spremenljivk pasivno projiciranih na diagram plevelnih združb v Egiptu. Numerične spremenljivke so prikazane kot modre puščice, kategorične spremenljivke kot centroidi z rdečim tekstom in popisne ploskve kot sive točke. Lastne vrednosti za prvi dve osi: 0.5077 in 0.3183. Okrajšave: CS – debelozrnat pesek, FS – drobnozrnat pesek, S.C – melj in glina, OM – organska snov, pH – reakcija tal, EC – električna prevodnost.

Figure 7:

The ordination diagrams of the reduced RDA containing (a) soil variables as vectors, (b) crop, region and season as factors and (c) species. Only the species with the highest fit were presented (25 species with highest frequencies and highest fit along the first axis). For the soil variables abbreviations see Figure 6.Slika 7: Ordinacijski diagrami reducirane RDA, ki vsebujejo: (a) talne spremenljivke kot vektorji, (b) kulturna rastlina, območje in letni čas kot faktorji in (c) vrste. Prikazane so samo vrste, ki imajo največji fit (25 vrst z največjo frekvenco in fitom vzdolž prve osi). Za talne spremenljivke glej Slika 6.

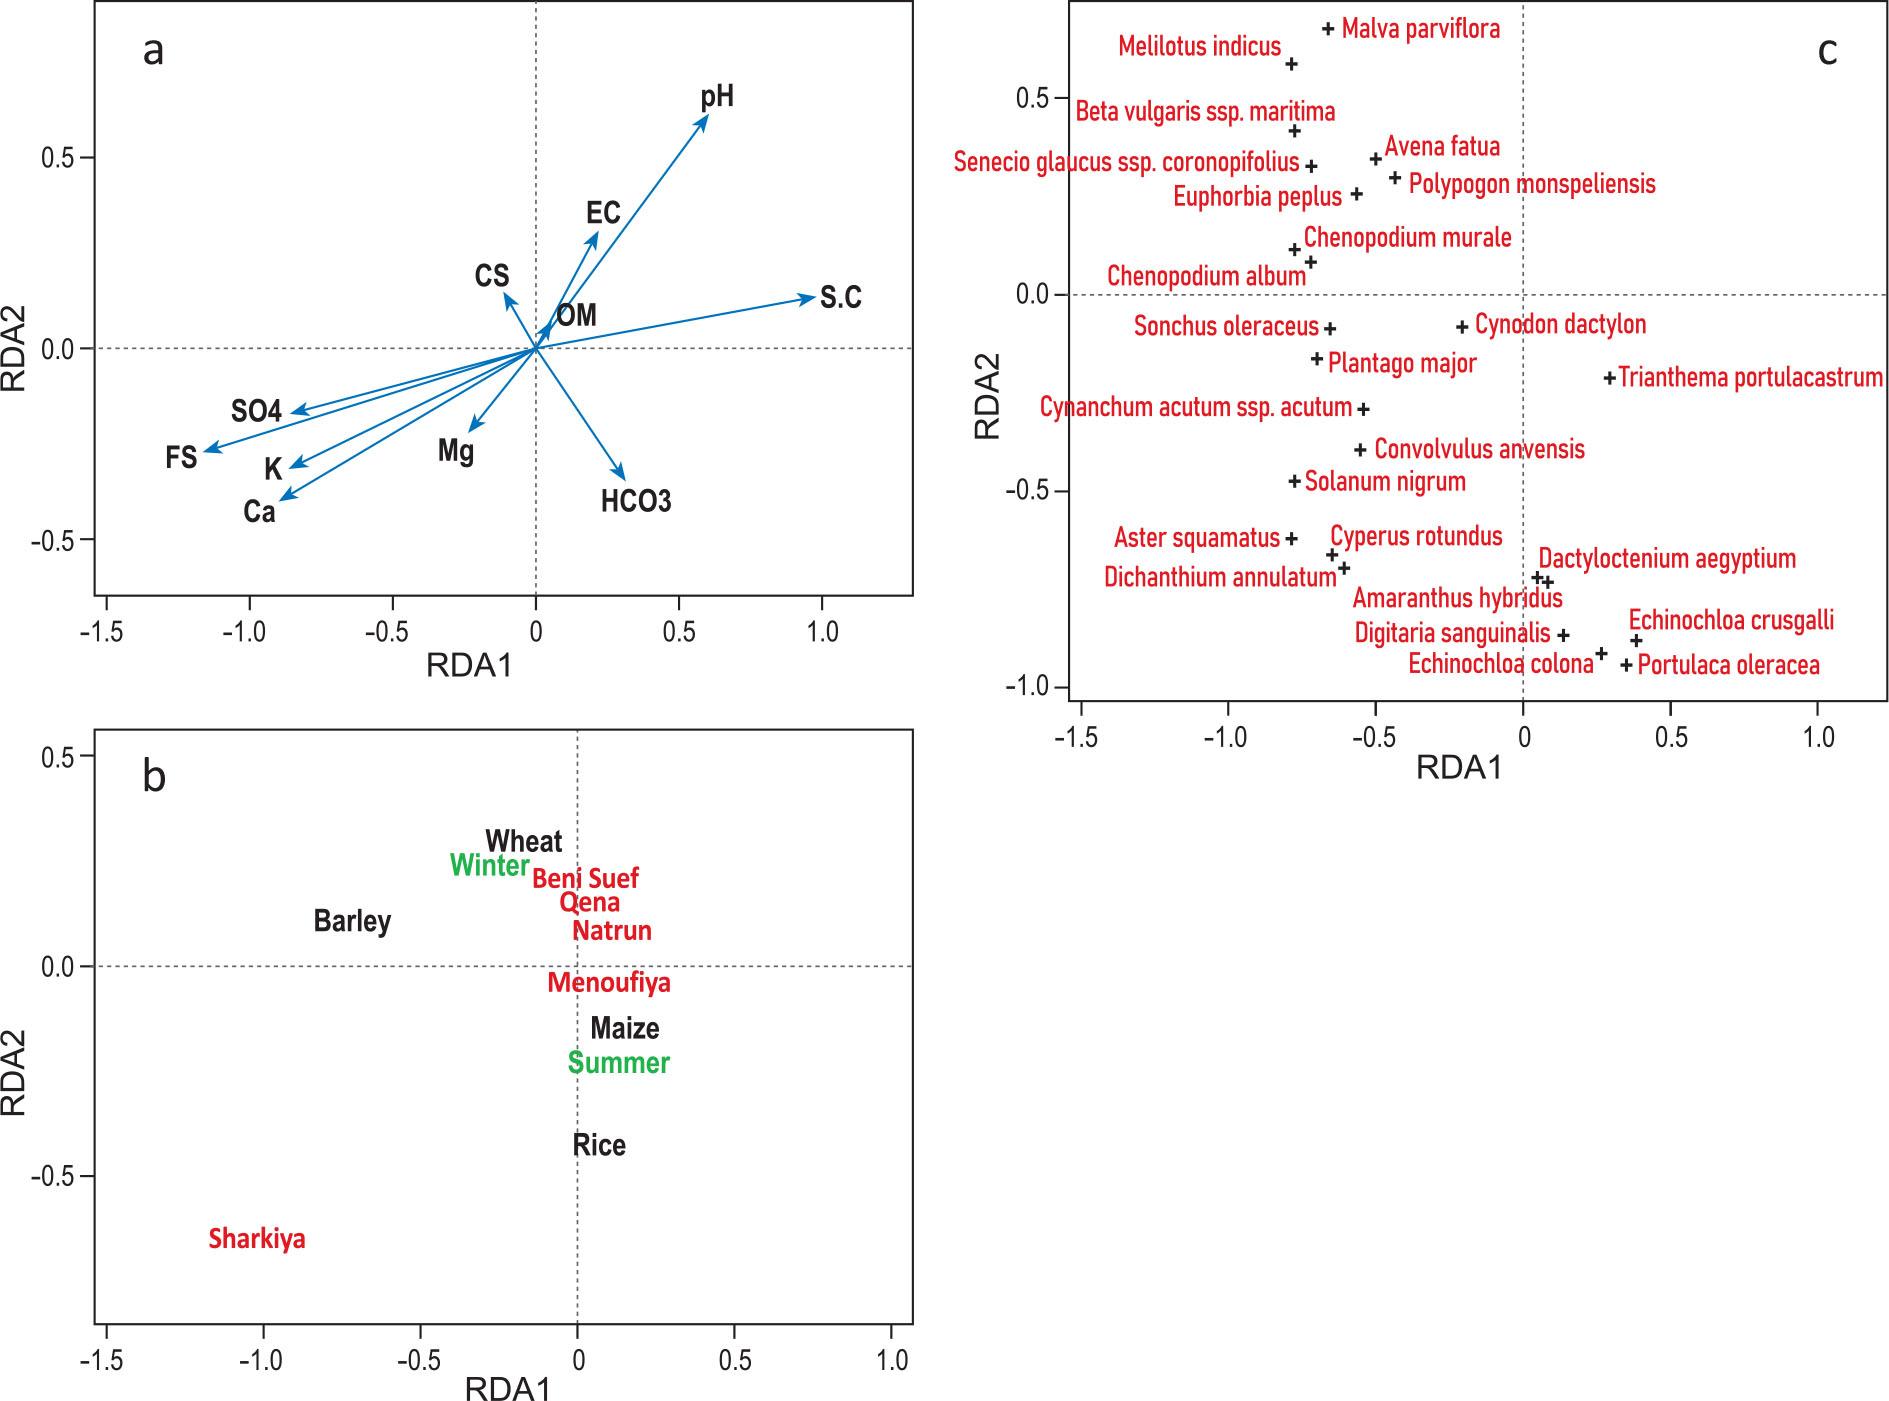
Gross and net effects of the explanatory variables on the weed vegetation resulting from partial RDA analysis with single variable_ RDA explained variation 0_366_ For the soil variables abbreviations see Figure 6_Tabela 2: Bruto in neto učinek razlagalnih spremenljivk na plevelno vegetacijo za posamezno spremenljivko v parcialni RDA_ Pojasnjena varianca v RDA je 0_366_ Za talne spremenljivke glej Slika 6_

Gross effectNet effect

VariabledfExplained variance %R2adj.Fp-valueExplained variance %R2adj.Fp-value
CS10.8810.00502.30230.0220 *0.245−0.00020.92890.4460
FS13.7820.034110.18000.0010 ***0.245−0.00020.92910.4790
S.C13.5270.03159.46790.0010 ***0.245−0.00020.92870.4880
OM10.7300.00351.90320.0600 .0.4910.00241.86260.0330 *
pH12.4950.02126.62780.0010 ***0.3340.00081.26630.1200
EC10.6960.00331.81620.0580 .0.3200.00061.21380.1820
HCO311.1000.00722.87990.0050 **0.3020.00041.14530.2330
SO412.0440.01675.40570.0020 **0.2770.00011.05230.3470
Ca12.1530.01775.69750.0010 ***0.233−0.00030.88370.6160
Mg11.1020.00722.88640.0110 *0.4210.00171.59590.0730 .
K12.1870.01815.78940.0010 ***0.3830.00131.45160.0640 .
Crop312.1030.110811.79500.0010 ***2.4100.02014.57400.0010 ***
Season17.6290.072721.39000.0010 ***0.0000.00000.0000
Region422.4300.212218.50600.0010 ***9.3590.08888.97020.0010 ***

Selected geographical, agricultural and climatic information (mean values of the 10 years from 2011 to 2021) for the nearest meteorological station in the studied regions_Tabela 1: Izbrani geografski, kmetijski in klimatski podatki (povprečne vrednosti za deset let med 2011 in 2021) za najbližje meteorološke postaje v raziskovanih območjih_

Region (Governorates)LatitudeLongitudeTotal Area (km2)Cultivated Area (%)Elevation (m asl)Tmax (°C)Tmin (°C)Tmean (°C)Rainfall (mm)
El-Sharkiya30°35′31° 30′41808113.0029.615.522.533.5
El-Menoufiya30°36′30°1′25435717.9029.415.322.434.6
Beni Suef29°4′31°6′13229130.4029.915.422.67.80
Qena26°10′32°43′17967572.6031.217.124.11.00
El-Buhaira30°58′30°33′281.713.4−23.0029.215.422.341.4
DOI: https://doi.org/10.3986/hacq-2025-0008 | Journal eISSN: 1854-9829 | Journal ISSN: 1581-4661
Language: English
Page range: 41 - 55
Submitted on: Aug 11, 2024
Accepted on: Nov 30, 2024
Published on: Feb 21, 2025
Published by: Slovenian Academy of Sciences and Arts
In partnership with: Paradigm Publishing Services
Publication frequency: 2 issues per year

© 2025 Ethar A. Hussein, Monier M. Abd El-Ghani, Urban Šilc, Lamiaa F. Shalabi, published by Slovenian Academy of Sciences and Arts
This work is licensed under the Creative Commons Attribution-NonCommercial-NoDerivatives 4.0 License.