
The pastures from the Danube Delta and its neighborhood are biodiversity-rich, with species of plants belonging to the Fabaceae, Poaceae, Cyperaceae, and Juncaceae families. According to Păcurar & Rotar (2014), these plants show differences in nutritional value and ecological conditions. On the other hand, Dipsacaceae, Plantaginaceae, Verbenaceae, and Urticaceae families have lower nutritional values from this point of view. A detailed inventory of the species composition and diversity is essential to characterize plant communities in these pastures (Guretzky et al., 2005; Klimek et al., 2007). Knowing the floristic composition is not only important from an ecological perspective but also from an economic perspective (Anamo et al., 2023). Such information about natural habitats can influence conservation and natural resource management decisions. For example, a high degree of information on the nutritional value of different plant species and families may be necessary for the rational use of grasslands as pastures in animal husbandry.
There is a fundamental need to know the habitat preferences of plant communities to conserve and assess biodiversity. Vegetation reflects plant adaptations to specific environmental conditions (Sosnowski & Solka, 2019) and habitat preferences. Floristic composition determines all significant aspects of the habitat, thus making it a prerequisite for understanding the variation in biodiversity and species richness in these habitats. As Sewale & Mammo (2022) mentioned, this information is necessary for obtaining an overview of biological diversity, as it describes a wide range of plant species. Other studies highlighted the floristic richness of the meadow ecosystems in the Danube Delta (Strat, 2016). About 300 plant species have been identified in the pastures of the Danube Delta. For example, species from the Poaceae family account for about 30%, Fabaceae family contribute 10%, and other grassland species from different families comprise the remaining 60%.
The pastoral value of the pastures in the Danube Delta is mediocre (Covaliov, 2023), with a low production potential of only 3–5 t/ha MV and an average load of 0.3– 0.5 large cattle units per ha (Decision no. 78/2015). The occurrence of the species Carduus nutans L. in pastures significantly reduces the quality of pastures in Mediterranean grasslands (Adar et al., 2023). Also, the quality of pastures is disturbed by the occurrence of various changes in land use and land cover (Calota & Patru-Stupariu, 2019).
The rapid increase in anthropogenic activities has significantly pressured the environment and natural ecosystems. In this context, intensive agricultural practices, extensive industrialization, accelerated urbanization, and climate changes have determined profound transformations in natural ecosystems, directly and indirectly affecting biodiversity. The impact of these anthropogenic activities on flora and vegetation has been shown in numerous studies (Dregne, 2002; Nakahama et al., 2015; Hussein et al., 2021).
This study aims to analyze the relationship between the floristic composition and environmental variables in some pastures in the Danube Delta. The study objectives were (1) the analysis of the floristic composition of pastures in the Danube Delta and (2) identifying environmental and chemical variables that influence variation in floristic composition. The results of this study will provide a detailed perspective on the floristic composition of the Danube Delta grasslands and contribute to the understanding of how environmental variables can influence the composition and structure of plant communities in these ecosystems.
The study was carried out in 2023 in 12 pasture areas from nine localities (Figure 1) from Tulcea County: Chilia Veche, Colina, Iazurile, Isaccea, Mahmudia, Murighiol, Niculițel (Niculițel-Saon, Niculițel-Carieră and Niculițel-Ocol), Pardina and Tulcea-Zaghen (Real Racing Equestrian club). Annual precipitation ranges from 390 mm to 460 mm, and annual mean temperatures from 10 °C to 11 °C (Fick & Hijmans, 2017). The elevation varied from 27 m to 231 m. Predominants are gleyic soils, kastanozem, solonchaks, solonetz, and alluvial soils (Florea & Munteanu, 2003).
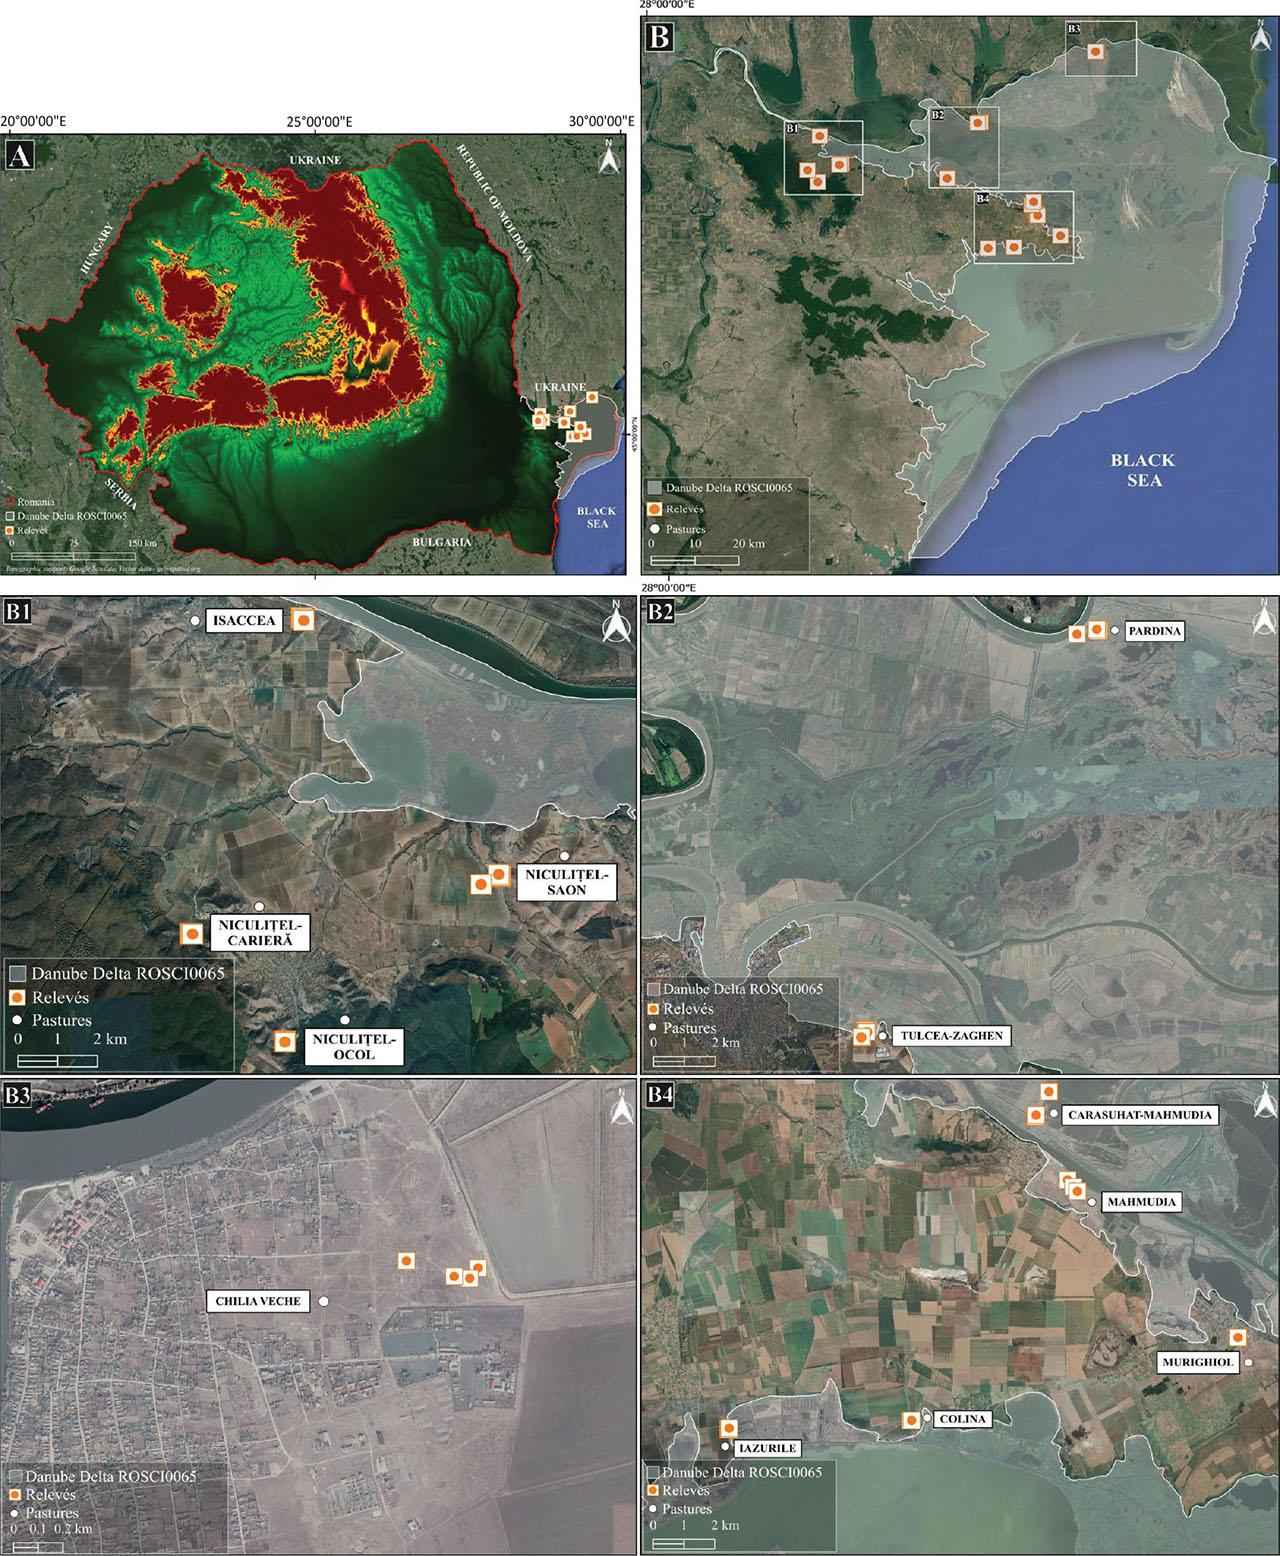
Map of the study areas: A) at the national level; B) at the Danube Delta ROSCI0065 level.
Slika 1: Zemljevidi raziskovanega območja: A) na državni ravni; B) na ravni delte Donave ROSCI0065.
For the vegetation analysis, phytocoenological relevés were carried out in each study area. In total, 50 relevés were carried out (including 120 taxa). The size of the plots was 100 m2 for heterogeneity to capture small-scale variations in species compositions. The vegetation was classified using the Agglomerative Hierarchical Clustering method (ß-flexible method, β = − 0.25, and the Bray-Curtis dissimilarity). The data were represented by the percentage values corresponding to the cover-abundance scale elaborated by Braun-Blanquet (1964), from each relevé, adapted according to Borza & Boșcaiu (1965) and Cristea et al. (2004): r (0.05%); + (0.5%); 1 (5%); 2 (17.5%); 3 (37.5%); 4 (62.5%); 5 (87.5%).
The dendrogram was performed using the GINKGO software of the VEGANA package (Bouxin, 2005). The mean Silhouette index determined the optimal number of clusters (Rousseeuw, 1987). The synoptic table was made in the JUICE version 7.1 (Tichý, 2002). For the clusters obtained, the diagnostic species were identified using IndVal (Indicator Value; Dufrêne & Legendre 1997). From a statistical point of view, a permutation test was used to select only species significantly associated with clusters (de Cáceres and Legendre, 2009). Thus, the threshold of (sqrt) IndVal was set at 0.500 (Legendre & Legendre, 1998). For each diagnostic species, two values were presented: the first is a statistical value, and the second is a p-value. For example, for cluster 1, the species Cynodon dactylon has a statistical value 0.713. The p-value for C. dactylon is 0.001, which is less than the significance level (alpha) 0.05 (denoted as ***). The map with the analyzed areas was made in the QGIS program version 3.28 (QGIS Development Team, 2022) and edited in Inkscape v1.3.2 (https://inkscape.org/).
The nomenclature of plant species follows EURO+MED (2024), the plant associations follow Chifu et al. (2014), and the higher syntaxa follow Mucina et al. (2016). EUNIS habitats were also identified using the EUNIS-ESy Expert System (Chytrý et al., 2020).
Topographic variables (elevation and aspect), climatic variables (annual mean temperature and annual mean precipitation, and chemical variables (pH, C, P, and humus) were used for the multivariate analysis. The elevation (m) and aspect were recorded in the field with AndroiTS GPS Test version 1.48 Pro, and annual mean temperature ( °C) and precipitation (mm) were extracted from the WorldClim database (Fick & Hijmans, 2017). In the AndroiTS GPS Test application, the aspect values were represented by degrees (e.g. 90º) and the abbreviation of the cardinal directions (e.g. E – eastern). For chemical data, soil samples were taken from each studied pasture. Afterwards, the total phosphorus – P (mg kg-1) was analyzed using the Egner-Riehm Domingo method according to ISO 11263 (1994). Soil pH according to SR ISO10390 (1998), the total carbon – C (%) concentration according to SR ISO 106940 (1998), and the humus (%) concentration was analyzed achieved according to SR ISO 106940 (1998) and STAS 7184/21-82.
Two methods were used to analyze the relationships between floristic composition and environmental variables: Detrended Correspondence Analysis (DCA) and Canonical Correspondence Analysis (CCA). In this context, DCA analysis was performed to detect floristic gradients, and CCA analysis was applied to quantify the effect of each environmental variable on floristic composition using the Monte Carlo permutation test (9999 iterations). Collinearity between environmental variables taken in the study was determined with the Variance Inflation Factor (VIF). Only variables with a VIF value < 5 were considered (Table 1). Analyzes were performed in the CANOCO program version 5.1 (ter Braak & Šmilauer, 2018).
VIF analysis between the variables studied.
Tabela 1: Analiza VIF med preučevanimi spremenljivkami.
| Variable | VIF |
|---|---|
| pH | 2.136 |
| Humus % | 2.153 |
| total P – total phosphorus (mg kg−1) | 1.238 |
| BIO12 – annual mean temperature ( °C) | 2.279 |
| Elevation (m) | 1.852 |
| Aspect | 1.042 |
Values for the studied variables are means ± standard deviations (SD). VEGC – vegetation cover, Annual mean temperature, Annual precipitation, C – organic carbon, P – total phosphorus, ELV – elevation, Asp – aspect (S – south, W – west, E – east, SE – southeast).
Tabela 2: Vrednosti preučevanih spremenljivk: srednje vrednosti ± standardni odkloni (SD). VEGC – pokrovna vrednost vegetacije, povprečna letna temperatura, povprečna letna količina padavin, C – organski ogljik, P – skupni forsfor, ELV – nadmorska višina, Asp – lega (S – jug, W – zahod, E – vzhod, SE – jugovzhod).
| Cluster | No. of species / 100 m2 | VEGC (%) | Chemical variables | Topographic variables | Climatic variables | |||||
|---|---|---|---|---|---|---|---|---|---|---|
| pH | C % | Humus % | P | ELV (m) | Asp | Annual mean temperature (°C) | Annual mean precipitation (mm) | |||
| 1 | 12 ± 4.7 | 83 ± 9.9 | 7.5 ± 0.4 | 8.9 ± 3.7 | 15.4 ± 6.5 | 2.6 ± 1.3 | 61 ± 55 | S | 10.9 ± 0.4 | 430 ± 24 |
| 2 | 9 | 94 ± 2.5 | 7.9 | 6.9 | 11.9 | 4.8 | 53 ± 8.1 | W | 10.9 | 462 |
| 3 | 5 ± 0.9 | 97 ± 4.6 | 7.7 ± 0.3 | 10.9 ± 5 | 18.8 ± 8.7 | 4.9 ± 1.2 | 31 ± 5.3 | S | 11.2 ± 0.01 | 407 ± 5.1 |
| 4 | 14 ± 0.7 | 76 ± 21 | 7.07 | 6.2 | 10.7 | 2 | 163 ± 6.3 | W | 10 | 462 |
| 5 | 8 | 88 | 8.02 | 2.7 | 4.7 | 2.5 | 47 | E | 10.9 | 436 |
| 6 | 13 | 69 | 8.03 | 2.7 | 4.7 | 2.5 | 63 | SE | 10.9 | 436 |
| 7 | 19 ± 1.5 | 84 ± 3.3 | 7.5 | 10.6 | 18.3 | 1.5 | 34 | S | 11.3 | 398 |
| 8 | 27 ± 1.4 | 98 ± 0.7 | 7.5 | 10.6 | 18.3 | 1.5 | 32 ± 3.5 | S | 11.3 | 398 |
For this analysis, various indices were used (Păcurar & Rotar, 2014): the demands of plant species for ecological variables (moisture – M, trophicity – T), agronomic variables (tolerance to grazing – G, fodder value – FV), and the evaluation of the anthropogenic impact (hemerobia – Hr; urbanophilia – UR). The analysis was carried out in the program RStudio version 2024.04.2+764 (RStudio Team, 2024), using the „radarchart” package (Ashton et al., 2016).
The moisture index (M) describes the relationship between soil moisture and the spread of plant species. The scale developed by Ellenberg et al. (1992) was used. The scale has values from 1 (xerophilic) to 10 (ultrahydrophilic).
The trophicity index (T) describes the relationship between the supply of soil elements and the spread of plant species. The scale developed by Ellenberg et al. (1992) was used. The scale has values from 1 – oligotrophic (nitrogenous) to 9 – extremely eutrophic (extremely nitrophilous).
The grazing index (G) describes the relationship between the influences of trampling and grazing and the spread of plant species. The scale developed by Briemle & Ellenberg (1994) and Briemle et al. (2002) was used. The scale has values from 1 – intolerant (sensitive) and 9 – extremely tolerant.
The fodder value (FV) includes the chemical composition, degree of consumption, palatability, degree of toxicity, etc. (Păcurar & Rotar, 2014). The scale developed by Briemle (1996) was used. The scale has values from 1 – toxic species to 9 – excellent fodder species (Klapp et al., 1953).
The hemerobia index (Hr) describes the intensity of the anthropogenic influence. The scale developed by Klotz & Kühn (2002) was used, with modifications made by Păcurar & Rotar (2014). The scale has values from 1 (no human intervention – ahemerobe) to 7 (extreme anthropic influence – metahemerobe).
The urbanophily index (UR) describes to what extent a certain species is (or is not) linked to human settlements. The scale developed by Klotz & Kühn (2002) was used. The scale has values from 1 (urbanophobic) to 5 (urbanophile).
The floristic composition was identified in three syntaxonomical classes: Festuco-Brometea, Molinio-Arrhenatheretea, and Sisymbrietea. In this context, the vegetation was grouped into three orders, four alliances, five plant associations, and two communities.
In the Festuco-Brometea class, two plant associations were included. The vegetation height in the analyzed areas is high and dense. The elevation is medium, the soils are weakly alkaline with moderate concentrations of organic carbon and humus. Also, the pastures have a high vegetation cover, and a low diversity, on slopes with a north-northwest and eastern aspect.
In the Molinio-Arrhenatheretea class, a plant association and a plant community were included. The vegetation has an average height in pastures with low elevation. The soils are weakly alkaline, rich in organic carbon and humus, and poor in phosphorus. The pastures have a high vegetation cover and diversity, on slopes with a west-southwest and east-southeast aspect.
In the Sisymbrietea class, two associations and two plant communities were included, on slopes with north-northeast, north-west and south aspects. The vegetation has an average height, which occurs at higher elevations. The soils are weakly alkaline, rich in organic carbon and humus and poor in phosphorus. Species diversity and vegetation cover are moderate.
Class.: Festuco-Brometea Br.-Bl. et Tx. ex Soó 1947
Order: Festucetalia valesiacae Soó 1947
All.: Festucion valesiacae Klika 1931
Ass.: Agropyro pectinati-Kochietum prostratae Zolyomi 1958
Ass.: Bombycilaeno erecti-Bothriochloetum ischaemi (Dihoru 1970) Dihoru et Doniță 1970
Class.: Molinio-Arrhenatheretea Tx. 1937
Order: Potentillo-Polygonetalia avicularis Tx. 1947
All.: Potentillion anserinae Tx. 1947
Ass.: Rorippo austriacae-Agropyretum repentis (Timár 1947) R. Tx. 1950
Community: Rumex crispus-Xanthium spinosum
Class.: Sisymbrietea Gutte et Hilbig 1975
Order: Sisymbrietalia sophiae J. Tx. ex Görs 1966
All.: Cannabidion sativae Golub et al. 2012
Ass.: Cynodonto dactyloni-Atriplicetum tataricae Morariu 1943
All.: Sisymbrion officinalis Tx. et al. ex von Rochow 1951
Ass.: Hordeo murini-Cynodontetum dactyloni Felföldy ex Borhodi 1949
Community: Cynodon dactylon-Xanthium spinosum
Community: Anisantha sterilis-Cynodon dactylon
EUNIS Habitats
V Vegetated man-made habitats
V1 Arable land and market gardens
V15 Bare-tilled, fallow, or recently abandoned arable land
V3 Artificial grasslands and herb-dominated habitats
V31 Agriculturally improved, re-seeded, and heavily fertilized grassland, including sports fields and grass lawns
R Grasslands and lands dominated by forbs, mosses, or lichens
R1 Dry grasslands
R1B Continental dry grassland (true steppe)
R6 Inland salt steppes
R65 Continental subsaline alluvial pasture and meadow
The cluster analysis results are presented as a dendrogram (Figure 2) and a synoptic table (Supplement E1). Vegetation was grouped into eight clusters and reflects the syntaxonomic classification described in the literature (Chifu et al., 2014): cluster 1: Hordeo murini-Cynodontetum dactyloni association; cluster 2: Agropyro pectinati-Kochietum prostratae association; cluster 3: Cynodonto dactyloni-Atriplicetum tataricae association; cluster 4: Anisantha sterilis-Cynodon dactylon community; cluster 5: Bombycilaeno erecti-Bothriochloetum ischaemi association; cluster 6: Rorippo austriacae-Agropyretum repentis associations; cluster 7: Cynodon dactylon-Xanthium spinosum community; cluster 8: Rumex crispus-Xanthium spinosum community.
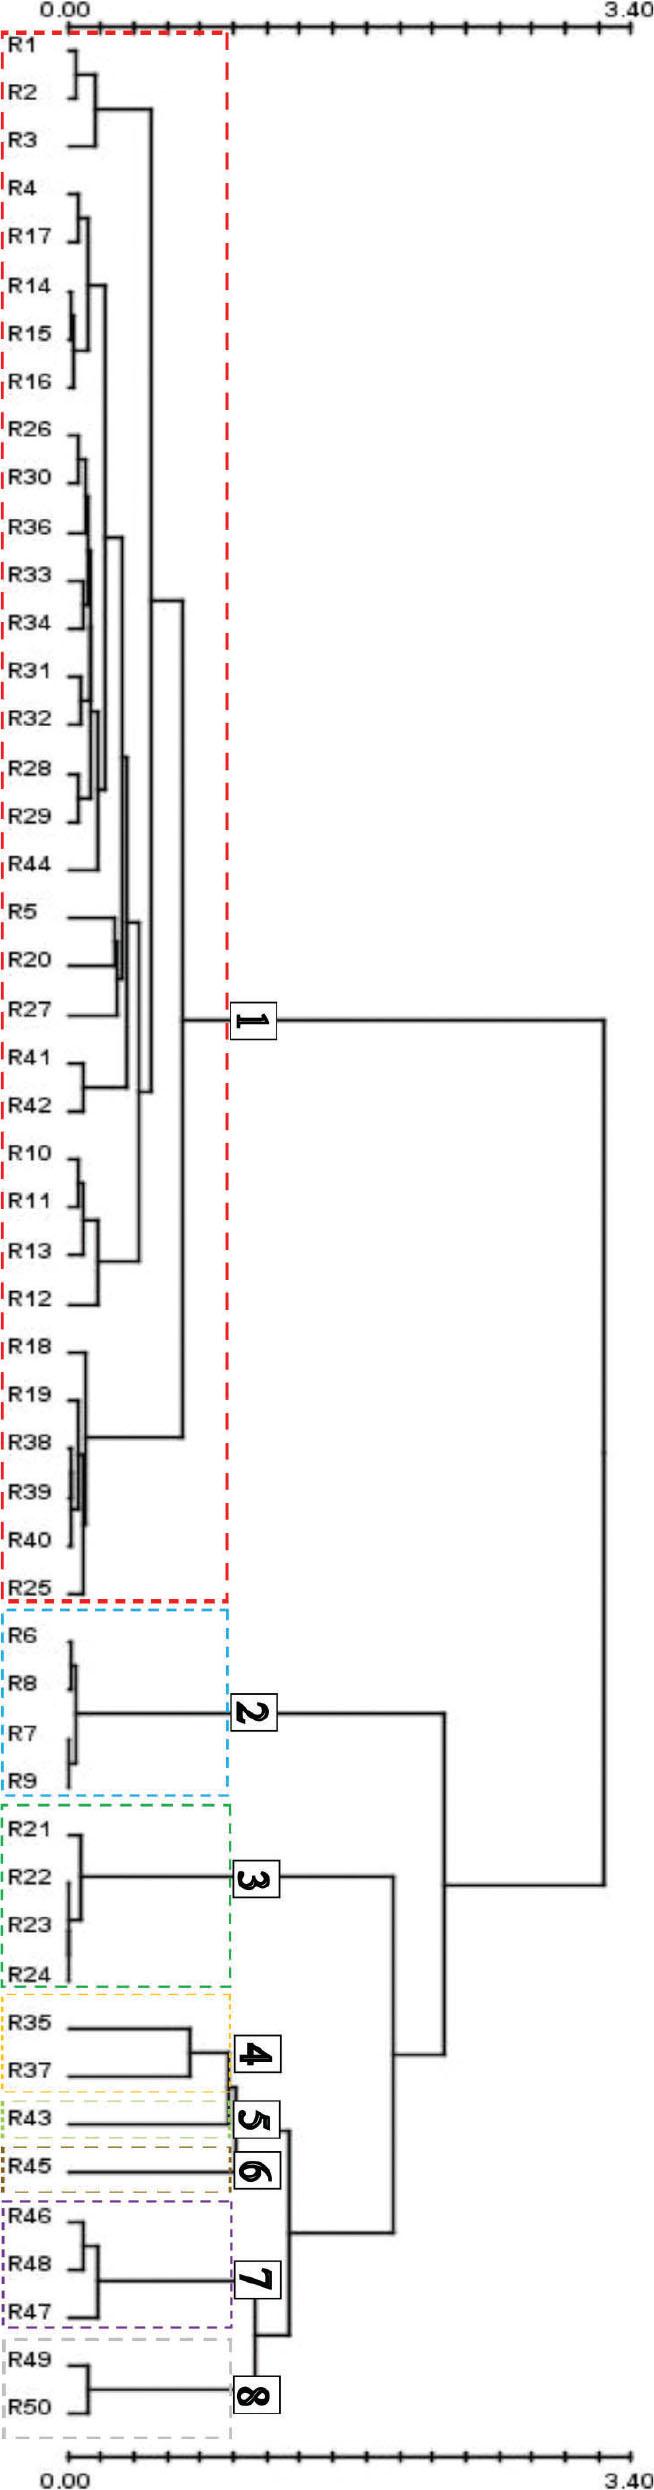
Dendrogram of vegetation data obtained from cluster analysis.
Slika 2: Dendrogram vegetacijskih popisov, narejen s klastrsko analizo.
Cluster 1: Hordeo murini-Cynodontetum dactyloni
Structure and composition of plant community: The diagnostic species is Cynodon dactylon (0.713, 0.001, ***). This cluster has moderate species diversity and high vegetation cover. The species Artemisia santonicum, Teucrium chamaedrys, Setaria viridis, Bromus hordeaceus and Potentilla reptans, had cover from 0.5% to 17.5%. The dominant species is Cynodon dactylon, which has a significant cover, from 62.5% to 87.5%
Ecology: The soil is weakly alkaline and rich in organic carbon and humus concentrations, indicating a fertile substrate. Total phosphorus is present in a poor concentration. The elevation is low, with slight slopes and a southern aspect.
Distribution: This cluster included 33 relevés, carried out in pastures from Chilia, Iazurile, Mahmudia, Murighiol, Niculițel (Niculițel-Carieră, Niculițel-Ocol, and Niculițel-Saon), Pardina and Tulcea-Zaghen (Tulcea County).
Cluster 2: Agropyro pectinati-Kochietum prostratae
Structure and composition of plant community: The diagnostic species is Agropyron cristatum subsp. pectinatum (0.999, 0.001, ***). The cluster has a lower diversity, with a high vegetation cover. Elytrigia repens has a moderate cover, and the dominant species, Agropyron cristatum subsp. pectinatum, has a cover of 87.5%.
Ecology: The soil is weakly alkaline, with a moderate organic carbon and humus concentrations. Total phosphorus is present in a moderate concentration. The elevation is low, with slight slopes and a western aspect.
Distribution: In this cluster were four relevés distributed in the Isaccea pastures (Tulcea County).
Cluster 3: Cynodonto dactyloni-Atriplicetum tataricae
Structure and composition of plant community: The diagnostic species are Atriplex tatarica (0.996, 0.001, ***) and Artemisia santonicum (0.971, 0.001, ***). Species diversity is low, and the vegetative cover is high. Artemisia santonicum and Cynodon dactylon has little cover. The dominant species is Atriplex tatarica, with a cover of 87.5%.
Ecology: The soil is weakly alkaline and rich in total phosphorus, organic carbon and humus concentrations. The elevation is low, with slight slopes and a southern aspect.
Distribution: This cluster contains four relevés distributed in the Iazurile and Colina localities (Tulcea County).
Cluster 4: Anisantha sterilis-Eragrostis minor community
Structure and composition of plant community: The diagnostic species are Anisantha sterilis (0.998, 0.039, *), Fragaria viridis (0.997, 0.025, *), and Medicago falcata (0.932, 0.05, *). Species diversity is moderate, and there is a high vegetation cover. Fragaria viridis has a little cover, and Cynodon dactylon has a moderate cover. Eragrostis minor and Anisantha sterilis are the dominant species.
Ecology: Community occurs at medium elevations with a western aspect. The soil is weakly alkaline and poor in total phosphorus, organic carbon, and humus concentrations.
Distribution: These relevés (two relevés) are distributed in the pastures of Niculițel-Carieră (Tulcea County).
Cluster 5: Bombycilaeno erecti-Bothriochloetum ischaemi
Structure and composition of plant community: The diagnostic species are Bothriochloa ischaemum (0.996, 0.013, *) and Knautia arvensis (0.920, 0.046, *). The cluster has low diversity and a high vegetation cover. Bromus hordeaceus and Cynodon dactylon have little cover, and the dominant species is Bothriochloa ischaemum.
Ecology: The soil is weakly alkaline, and poor in organic carbon, humus concentrations, and total phosphorus concentrations. The elevation is low, with an eastern aspect.
Distribution: A relevé made in Tulcea-Zaghen (Tulcea County) was included in this cluster.
Cluster 6: Rorippo austriacae-Agropyretum repentis
Structure and composition of plant community: The diagnostic species is Elytrigia repens (0.974, 0.026, *). Species diversity is moderate, and the vegetation cover is low. The dominant species is E. repens, while the other species have a low cover of 0.5%. This cluster is strongly influenced by E. repens, which has a central role in the structure of the plant association.
Ecology: The soil is weakly alkaline and poor in organic carbon, humus concentrations, and total phosphorus concentrations. The elevation is low, with a southeast aspect.
Distribution: This cluster includes one relevé distributed in Tulcea-Zaghen (Tulcea County).
Cluster 7: Cynodon dactylon-Xanthium spinosum community
Structure and composition of plant community: Species diversity and vegetation cover are high. Artemisia santonicum has a low cover and other species such as Centaurea iberica, Matricaria chamomilla, Rumex crispus and Xanthium spinosum have moderate covers. Cynodon dactylon is the dominant species.
Ecology: The soil is weakly alkaline, rich in organic carbon and humus concentrations, and poor in total phosphorus concentration. The elevation is low, with a southern aspect.
Distribution: This cluster includes three relevés distributed in the Carasuhat (Tulcea County).
Cluster 8: Rumex crispus-Xanthium spinosum community
Structure and composition of plant community: The diagnostic species are Arctium lappa (1.000, 0.001, ***), Argentina anserina (1.000, 0.001, ***), Ranunculus sceleratus (1.000, 0.001, ***), Veronica serpyllifolia (1.000, 0.001, ***), Urtica dioica (0.957, 0.005, **), and Daucus carota (0.932, 0.004, **). This cluster presents the highest diversity and vegetation cover. Polygonum aviculare has low cover, and other species, such as Centaurea iberica, Cynodon dactylon, Plantago media, and Xanthium spinosum, have moderate cover. Rumex crispus is the dominant species, 62.5%.
Ecology: The soil is weakly alkaline, rich in organic carbon and humus concentrations, and poor in total phosphorus concentration. The elevation is low, with a southern aspect.
Distribution: In this cluster are two relevés, distributed in the Carasuhat (Tulcea County).
The main determinants of the change in floristic composition are identified by indirect gradient analysis. Given that the gradient index of floristic similarity recorded a value of 4.02 (Table 3), applying the unimodal method, namely the Canonical Correspondence Analysis (CCA), was decided. The first axis explained 8.79% of the variability in the species data, while the second axis explained 16.53% of this variation.
Summary of DCA analysis.
Tabela 3: Povzetek analize DCA.
| Axis 1 | Axis 2 | Axis 3 | Axis 4 | |
|---|---|---|---|---|
| Eigenvalues | 0.6187 | 0.5442 | 0.2610 | 0.2015 |
| Explained variation (cumulative) | 8.79 | 16.53 | 20.24 | 23.1 |
| Gradient length | 4.02 | 3.51 | 2.26 | 2.18 |
| Pseudo-canonical correlation (suppl.) | 0.8628 | 0.7177 | 0.6117 | 0.5615 |
The DCA diagram highlights how different vegetation types are distributed on the first and second ordination axes. The first DCA axis was correlated with elevation, aspect and annual precipitation. The principal gradient in vegetation composition along the second axis can be explained by positive correlations with variables such as humus and phosphorus concentrations (Figure 3).
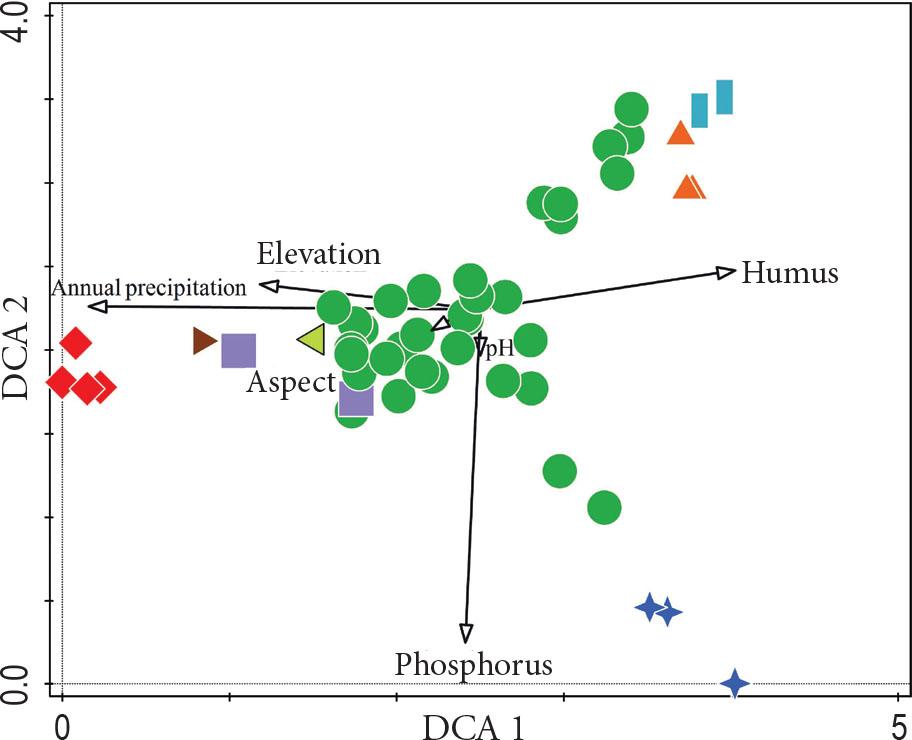
DCA ordination of the eight vegetation clusters: cluster 1: Hordeo murini-Cynodontetum dactyloni – green (circle); cluster 2: Agropyro pectinati-Kochietum prostratae – red (diamond); cluster 3: Cynodonto dactyloni-Atriplicetum tataricae – blue (star); cluster 4: Anisantha sterilis-Eragrostis minor community – purple (square); cluster 5: Bombycilaeno erecti-Bothriochloetum ischaemi – lightgreen (left triangle); cluster 6: Rorippo austriacae-Agropyretum repentis – brown (right triangle); cluster 7: Cynodon dactylon-Xanthium spinosum community – orange (up triangle); cluster 8: Rumex crispus-Xanthium spinosum community – skyblue (box).
Slika 3: DCA ordinacija osmih vegetacijskih klastrov: klaster 1: Hordeo murini-Cynodontetum dactyloni – zeleni krožec; klaster 2: Agropyro pectinati-Kochietum prostratae – rdeči diamant; klaster 3: Cynodonto dactyloni-Atriplicetum tataricae – modra zvezda; klaster 4: združba Anisantha sterilis-Eragrostis minor – vijoličasti kvadrat; klaster 5: Bombycilaeno erecti-Bothriochloetum ischaemi – svetlozeleni levi trikotnik; klaster 6: Rorippo austriacae-Agropyretum repentis – rjavi desni trikotnik; klaster 7: združba Cynodon dactylon-Xanthium spinosum – oranžni zgornji trikotnik; klaster 8: združba Rumex crispus-Xanthium spinosum – svetlomodra škatla.
The left side of the scatter diagram is occupied by relevés of Agropyro pectinati-Kochietum prostratae (red diamond). Rorippo austriacae-Agropyretum repentis (brown right triangle) dominates the lower left part of the ordination space, being well differentiated from the other vegetation units. The relevés of Cynodonto dactyloni-Atriplicetum tataricae (blue star), Cynodon dactylon-Xanthium spinosum community (orange up triangle) and Rumex crispus-Xanthium spinosum community (skyblue box) are found at the opposite end of the ordination diagram. Hordeo murini-Cynodontetum dactyloni relevés are in the middle of the ordination space (green circle).
The Canonical Correspondence Analysis showed that annual precipitation was the most influential environmental factor significantly affecting floristic composition in the Danube Delta pastures and neighboring areas, and others were less significant (Table 4).
Results of CCA ordination of the effect of variables on floristic composition.
Tabela 4: Rezultati CCA ordinacije vpliva abiotskih spremenljivk na floristično sestavo.
| Variable | Explains (%) | Contribution (%) | pseudo-F | p-value | P(adj) |
|---|---|---|---|---|---|
| Annual precipitation (mm) | 6.2 | 25.8 | 3.2 | 0.002 | 0.012 |
| Total phosphorus (mg kg-1) | 5 | 20.5 | 2.6 | 0.002 | 0.012 |
| pH | 4.6 | 18.9 | 2.5 | 0.002 | 0.012 |
| Humus % | 3.4 | 13.9 | 1.9 | 0.004 | 0.024 |
| Elevation (m) | 3.2 | 13.1 | 1.8 | 0.002 | 0.012 |
| Aspect (°) | 1.9 | 7.8 | 1.1 | 0.39 | 1 |
Most of the clusters include mesoxerophilic species adapted to moderate to dry conditions. The obtained data showed that the clusters are different regarding soil type. Cluster 3, for example, comprises mesophilic species adapted to wetter conditions, and cluster 8 comprises species that grow on mesotrophic and moderately nutrient-rich soils. Clusters 1, 4, 5, 6, and 7 include oligo-mesotrophic species, which grow on nutrient-poor soils. Cluster 2 comprises mesotrophic species that grow on moderately nutrient-rich soils. Regarding tolerance to grazing, it varies from moderate to total tolerance for cluster 7. The fodder value was low in all clusters obtained.
The anthropogenic impact on these species is generally moderate. All clusters include mesohemerobe and beta-euhemerobe species, indicating a significant anthropogenic impact on the floral composition. The species are mainly urbanophobic, i.e., they spread predominantly outside human settlements. However, Cluster 3 is a particular case, being urban neutral, which suggests that the species in this cluster are more adaptable to human presence.
The analyzed pastures are a mixture of natural and anthropogenic conditions. The floristic composition is dominated by species resistant to grazing, with low forage value and influenced by human activities. These characteristics require implementing sustainable grazing practices and adjusting pasture management to support animal productivity and ecological balance (Figure 4).
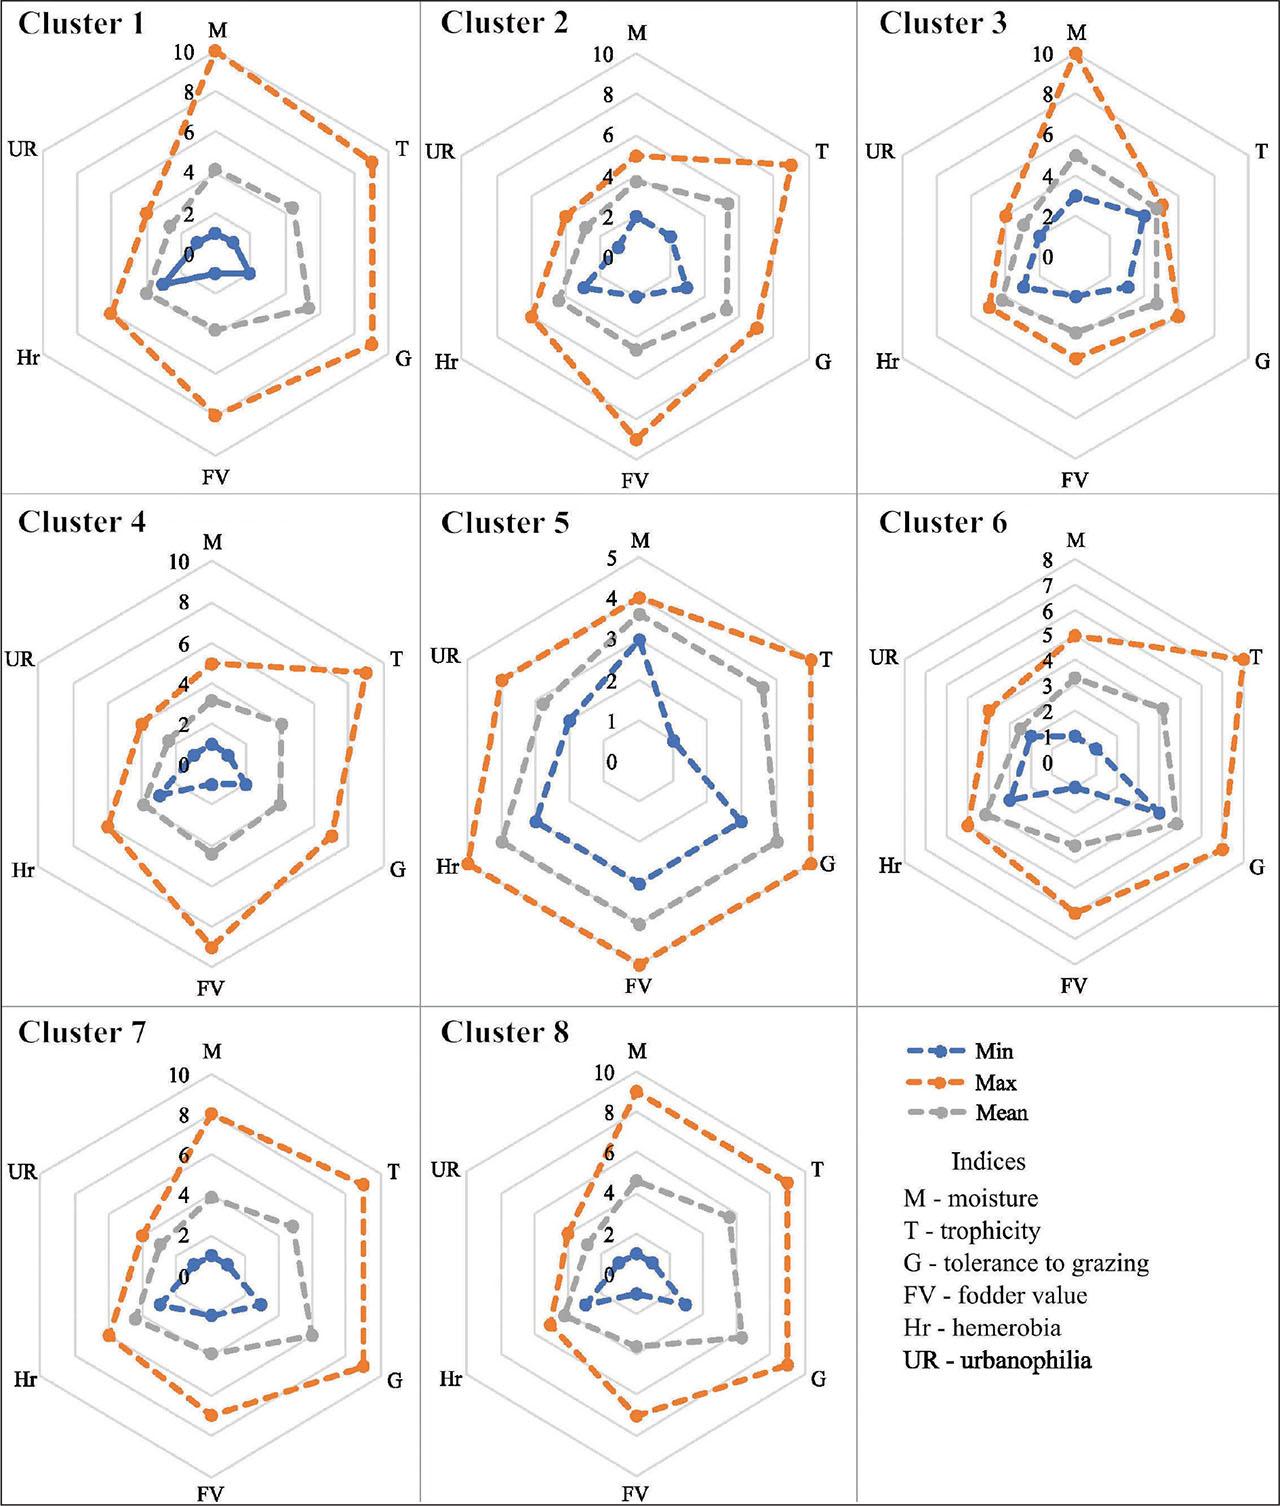
Cyclogram of agro-biological indices of pasture species.
Slika 4: Ciklogram agrobioloških indeksov pašniških vrst.
In the analyzed study, plant species are described as moderately resistant to grazing. These plants have adaptations that allow them to tolerate grazing pressure, but they are not completely immune to it. Animals graze these plants only partially, suggesting that grazing is intense enough to affect the vegetation but not severe enough to eliminate sensitive species. Species such as Cynodon dactylon, Potentilla reptans, etc. are resistant to grazing due to their ability to regenerate quickly and tolerate difficult environmental conditions, including grazing pressure. The type of grazing used is described as „semi-extensive pasture with a tillage system”. This system involves rotating the animals between different plots (paddocks), which allows re-vegetation in areas that are temporarily unused.
The quality of the pastures is given by the floristic composition of the pastures (Carreira et al., 2023), which highlights a diverse range of plant species. The plant species analyzed in the 12 pastures from Danube Delta are mostly palatable (Chirilă et al., 2024), indicating an interaction between plant availability and animal preferences.
A low number of species was recorded in the analyzed relevés. The decrease in the number of species is a consequence of grazing. In this case, our study is in line with the moderate disturbance hypothesis (Fox, 1979) according to which moderate grazing increases species diversity, while intensive grazing decreases species diversity (Herrero-Jáuregui & Oesterheld, 2018; Wang et al., 2018). Moderate grazing increases species diversity through direct consumption of competitive dominant plant species (Grime, 1973; Al-Mufti et al., 1977). At the same time, Rewilding Europe (2021) showed that areas with regular grazing from the Danube Delta have a greater diversity of species compared to areas without grazing, due to the prevention of the dominance of aggressive vegetation. In general, herbivores have an essential role in controlling the richness of plant species (de Bello et al., 2007). In this context, the role of herbivores has become an important issue in the conservation and management of grazing systems (Olff & Ritchie, 1998; Guo, 2004).
Grazing influences floristic composition in the studied pastures, favouring species resistant to grazing. Low species richness in intensively grazed areas suggests pressure is high. Therefore, the floristic composition is dominated by competitive species of rangelands (grazing-resistant). In contrast, in moderately grazed areas, total species increased by containing palatable and hardy plants. The analyzed pastures are dominated by species such as Cynodon dactylon, Agropyron cristatum subsp. pectinatum, Atriplex tatarica, and Bothriochloa ischaemum. Cynodon dactylon has been reported to be drought tolerant and able to grow in poor soils (Shi et al., 2014). The species C. dactylon can form dominant communities in various ecosystems due to its high adaptability (García et al., 2023). Also, the species Agropyron cristatum subsp. pectinatum and Bothriochloa ischaemum can form dense communities, suppressing other species. This is also supported by the study of Balyan & et al. (1991). Moreover, in our study, weakly alkaline soils, rich in organic carbon and humus, were associated with a greater number of species. Fertile and well-drained soils can support diverse and dense plant communities (Tilman et al., 1996). Species such as Rumex crispus and Artemisia austriaca also grow in these soils with high coverage. In contrast, the species Atriplex tatarica (Kochánková & Mandák, 2008) can colonize ruderal habitats.
The relationship between floristic composition and environmental variables is complex and influenced by geographic scale, taxonomic level, and study area (Qin et al., 2019). Our study demonstrated that annual precipitation, total phosphorus, soil pH, humus concentration, and elevation are the main variables influencing floristic composition variation in the analyzed pastures. Annual precipitation had the most significant impact on these factors. Following other studies (Xu et al., 2016; Xu et al., 2019), bioclimatic variables such as temperature and precipitation have been identified as the main variables of vegetation growth and distribution. In addition to these variables, interactions between soil chemical variables, such as phosphorus content and pH, and topographical variables have an essential role in shaping plant communities (Birhanu et al., 2021).
A moderate number of species were identified in clusters 2 and 4, where more significant amounts of precipitation were recorded. However, in cluster 8, where a greater number of species was recorded, precipitation was low. These analyzed areas, which contain a large number of species, in some months of the year, are flooded and contain underdeveloped species (the height and size of the leaves is small). Also, species in low precipitation areas may have specific adaptations that allow them to tolerate or thrive under water stress conditions. These adaptations may include morphological and physiological changes (Lambers et al., 2008), and the existence of varied ecological niches (Begon et al., 2006).
The richest phosphorus concentration is in cluster 3, where a high species richness was recorded. Interestingly, cluster 8 includes the highest number of species, but the phosphorus concentration is deficient. Soil phosphorus is essential for plants, involving various processes such as energy transfer and photosynthesis. Furthermore, different variations in total phosphorus concentration lead to increased or decreased richness, while the lowest phosphorus concentration can limit plant concentration (Cui et al., 2023).
Soil pH is between 7.07 and 8.03. Clusters with higher pH have fewer species. Cluster 8 includes 27 species per relevé, and the pH is weakly alkaline (7.5). In this context, our data show that weakly alkaline soils provide the best conditions for plant growth and development, while extreme pH levels limit species diversity. The data are also consistent with the literature (Zelnik & Čarni, 2013).
The higher the concentration of humus, the higher the number of species. Soil humus is important for soil fertility and structure. The high humus concentration shows how important the soil can be for plant growth (Cui et al., 2023).
Elevation varies between groups. Higher elevation ranges include moderate species richness. The relationship between elevation and species diversity is well studied (Lazarina et al., 2019). Körner (2007) further demonstrated that the diversity of species decreases with elevation since resources are limited, and climatic conditions become more adverse. Conversely, higher elevations can determine a great number of species in certain areas where specific microhabitats and local adaptations are present (Rahbek 1995).
The floristic composition of the analyzed pastures was diverse and related to environmental variables and grazing pressure. Therefore, sustainable management of this diversity is essential for maintaining productivity in these ecosystems. Understanding the impact of grazing on floristic composition can lead to developing management strategies to support the area's livestock productivity and ecological balance.
Environmental variables and anthropogenic impact strongly influence floral composition. Annual precipitation is a key factor that determines variation in floristic composition. Such results also show the importance of soil conditions influenced by the anthropogenic impact on the diversity and structure of the vegetation.
Most plant species are adapted to moderate to dry conditions (meso-xerophilous). Soil trophic varies between oligo-mesotrophic and mesotrophic while grazing tolerance is uniformly average. The species are generally fodder-poor, influenced by human impact (mesohemerobes and beta-euhemerobes), and tend to be moderately urbanophobic, distributed predominantly outside human settlements.
Through the analysis of the studied pastures, several dominant species have been identified that have a central role in the structure of these plant communities. Cynodon dactylon, Agropyron cristatum subsp. pectinatum, Atriplex tatarica and Bothriochloa ischaemum are the predominant species in these pastures. These species are colonizers, dominate different soil types, and adapt to varied environmental conditions. These soils are weakly alkaline, rich in organic carbon and humus, and poor in phosphorus.