
1. Introduction
Social cognitive theory has mostly served as the foundation for modelling research [1], where important characteristics of the action must be attended to, coded, and practiced, in order for modelled behaviour to be learned. Through them, the learner creates a mental model of the motor pattern that directs the creation of action and acts as a benchmark for the accuracy of actions [2]. In a VM technique, the learner watches a filmed sequence of a model displaying how a task should be accomplished, and then they try to accurately mimic the actions of the model [3,4]; this purportedly leads to increased performance, accelerated learning, and mastery of motor-control parameters [3,5]. A systematic review by Han et al. [6] found strong evidence supporting the effectiveness of observational learning for motor skill development in physical education, though moderate evidence suggested no significant difference in effectiveness between observing an expert model versus a self-model. The use of expert modelling (EM) is considered most advantageous in the early stages of skill development and is enhanced when examples are given before and throughout practice [7]. The use of expert video modelling (EVM) in students’ learning PE programs has been suggested to promote learning in hurdle clearing more effectively than traditional verbal feedback [8]. Similarly, Barzouka et al. [9] demonstrated that EVM is more effective than verbal training when used for volleyball motor acquisition, while Jarraya et al. [10] advocated the use of slow-motion videos in learning basketball tactical movements. In addition, Maryam et al. [11] concluded that EVM can be used to successfully enhance discus and hammer throw performance in track and field athletes.
In tennis, despite being directly under the player’s control, the serve is one of the most difficult strokes to learn, largely because it necessitates complex bodily synchronization, significantly contributing to winning or gaining an advantage in a match [12]. Similar to other sports, tennis has seen a huge increase in the use of technology in recent years [13,14]. Indeed, using contemporary technology has been shown in several studies to be helpful for learning [15], either acutely or over time [16], and to improve athletic performance in a variety of sports, including tennis [17]. However, some earlier work [18] did not support this, suggesting that video-mediated instruction methods in teaching novices the tennis serve are not successful. Accordingly, given the dearth of contemporary work on the topic, this study intends to investigate the impact of EVM instruction on the tennis serve precision for boys between the ages of 7 and 9 years. Drawing from the previously examined literature, we formulated two research hypotheses:
(i) Observing EVM twice improves serve accuracy to a significantly greater extent than watching it once or receiving traditional training.
(ii) Watching EVM one time elicited a greater impact on serve performance than typical training.
2. Materials and methods
2.1. Participants
Twenty-three young tennis players were assessed for eligibility. Six players were eliminated: two left-handed players, one player with a broken hand, and three girls (since there were more boys). The final sample comprised 17 male tennis players who were right handed and between the ages of seven and nine (mean age = 8.2 ± 0.87 years) from the “House of Youth Gremda.” They measured 1.30 ± 0.08 m in height, 29.35 ± 4.09 kg in body mass, 5.35 ± 1.11 years of tennis practice experience, 5.38 ± 0.76 h of weekly tennis training, and 2.00 h of weekly fitness training. Inclusion criteria comprised male, right-handed players aged 7–9 years, with at least 3 years of tennis experience, normal or corrected-to-normal vision, and regional competition level. Exclusion criteria included recent injury, motor-affecting medical conditions, inability to complete the protocol, and uncorrected visual impairment. Prior to data collection, all participants and their parents or legal guardians were informed of the study’s nature, objectives, and potential risks, both verbally and in writing (Figure 1).
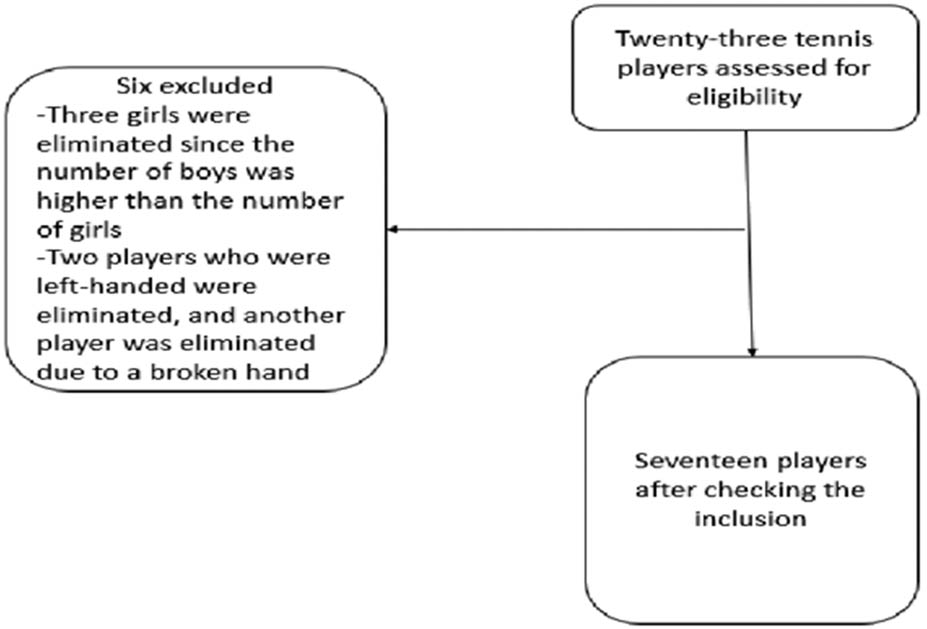
Figure 1
The study participant recruitment flowchart.
Written informed consent was obtained from the legal guardians, and verbal assent was provided by the children. The study was conducted in accordance with the Declaration of Helsinki.
2.2. Sample size estimation and justification
The sample size was determined using G*Power software (version 3.1.9.7; [19]). We anticipated a medium effect size (f = 0.25) based on previous research that investigated similar performance variables in young athletes [14]. With the alpha level set at 0.05 and the desired power (1 − β) at 0.80, the power analysis indicated that the study required a minimum of 12 participants. To ensure sufficient statistical power and account for potential attrition, we recruited 17 players.
In this experimental study, we used three cameras (model: Handycam Sony AX43A 4 K) with a wireless microphone with a DJ transmitter–receiver (VHF 10HL F4 Micro HF) [20].
Kinovea software (version 0.8.15), a validated tool for sports motion analysis [21], was used to analyse the following parameters: accuracy score, ball speed, and ball impact location.
2.3. Study design
All participants went through three conditions: CC, VMC1, and VMC2 (control condition (CC): this is traditional training; video model condition 1 (VMC1): in this condition, the participant watch a video of an expert once; and video model condition 2 (VMC2): the participants watch the expert video twice). The protocol consisted of conducting 48 serves, with the individual performing 16 serves (eight per diagonal) in each condition. Only VMC1 and VMC2 conditions necessitated looking at the video model before executing the serve, once or twice, respectively. The video clip lasted 18 s was presented in slow motion and included demonstrations from lateral angle. The video was silent and contained no verbal instructions. In VMC1, participants viewed the video once, concentrating on the player’s body movements, and subsequently engaged in a 15-min warm-up before executing the serve block. In VMC2, participants viewed the video twice: once prior to the warm-up, concentrating on body movement, and once subsequent to the warm-up, concentrating on the racket and ball impact position. In the control condition, participants had conventional training, which included a 15-min warm-up, verbal guidance on essential technical aspects (toss height, racket angle, follow-through), and corrective feedback during and subsequent to the serve attempts. The overall duration of this session was roughly 10–12 min. A delay of 1 week between each condition was observed to minimize carryover effects. All participants were recorded using three cameras strategically placed: one at the rear of the court (3 m behind the baseline), one laterally adjacent to the serve box (2 m from the court line), and one laterally near the baseline (2 m from the court line). The expert model was Carlos Alcaraz (World No. 2, 7 Grand Slam titles).
2.4. Testing procedures
The serve performance was evaluated under the “serve test condition,” consisting of performing 16 successive serves (8 per diagonal) and hitting the serves as fast as possible with their racket at a predetermined target. The experiment was carried out on an indoor tennis court, as previously described by Desliens et al. [22] and Guillot et al. [23]. The accuracy scores, ball speed, ball impact in the serve box, and the number of successful serves were measured using Kinovea (a video annotation tool designed for sport analysis, featuring utilities to capture, slow down, compare, annotate, and measure motion in videos) and has been employed in a number of prior investigations [24–26].
The target was defined from the ‘T’ of the court (the intersection of the service box and centrelines). The service box was divided into three scoring zones to assess serve accuracy: a small area (0.5 m × 0.5 m) awarded 5 points, a medium area (1 m × 1 m) awarded 3 points, and the full serve box awarded 1 point. While landing in the 5-point or 3-point areas represents higher accuracy, any serve landing within the service box (1-point area) was considered a successful serve and contributed to performance improvement (Figure 2) [14,22].
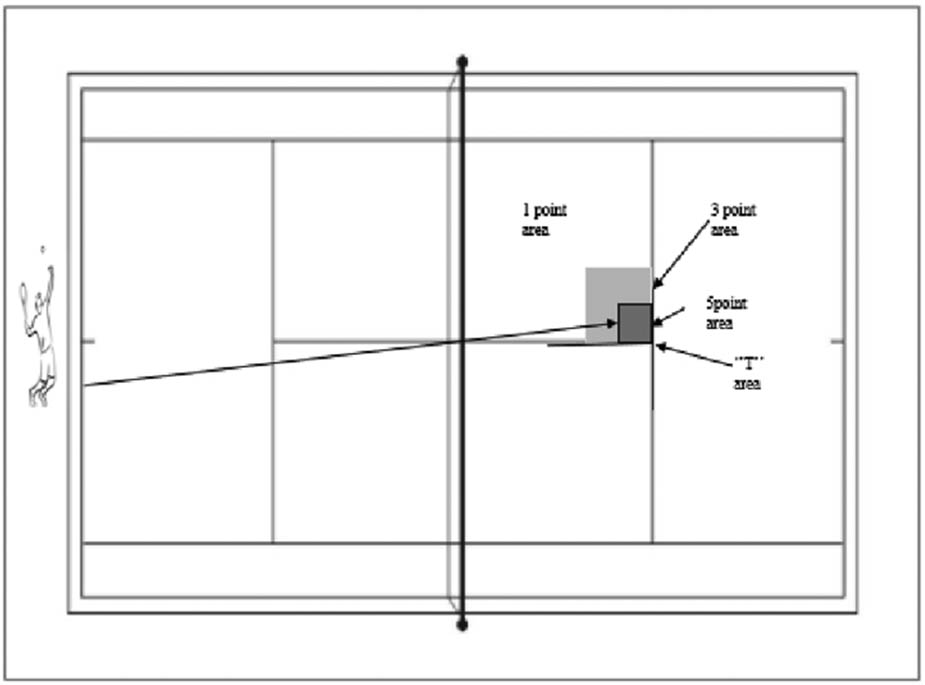
Figure 2
Scoring zones in the serve box.
2.5. Data analysis
Serve points areas were assigned for each zone in the accuracy score. Five points were awarded for the 0.5 m × 0.5 m zone, 3 points for the 1 m × 1 m zone, and just 1 point was awarded for the remaining serve box. The ball speed signified the fastest possible striking of the ball at any time between its release and the moment it lands in the serve box, measured in metres per second (m/s). The ball impact was defined as the radial error distance in meters between the player’s position (midpoint between the feet at the moment of racket-ball contact) and the ball’s landing point in the service box. This variable reflects serve accuracy, with lower values indicating better performance (i.e., the ball lands closer to the intended target) (measured in metres). Finally, successful serves number represented the number of successful serves under each condition that landed in the serve box rather than going out.
2.6. Statistical analysis
All data were presented as mean ± standard deviation (M ± SD) and were analysed using IBM SPSS Statistics [27]. The normality of distribution was confirmed using the Shapiro–Wilk test. Statistical significance was set at p < 0.05 for all analyses. Repeated-measures analyses of variance (ANOVA) with Greenhouse–Geisser correction was conducted to examine:
1) Conditions × Point Areas: [Conditions (CC vs. VMC1 vs. VMC2) × Point Areas (1-point, 3-point, 5-point)], allowing assessment of condition × point area interactions.
2) Conditions × Tests: [Conditions (CC vs. VMC1 vs. VMC2) × Tests (successful serve, ball speed, ball impact)], allowing assessment of condition × test interactions.
3) Comprehensive Model: Mauchly’s test of sphericity was applied and repeated-measures ANOVA were also run for [Conditions (CC vs. VMC1 vs. VMC2) × Tests (point area [1,8,15], successful serve, ball speed, ball impact)] to explore broader condition × test interactions.
Effect sizes were reported as partial eta squared (η 2 p) and interpreted as: small (0.01 < η 2 p < 0.06), medium (0.06 < η 2 p < 0.14), and large (η 2 p > 0.14) [28]. Statistical significance was set at p < 0.05. Pairwise comparisons with Bonferroni correction were applied to control for Type I error inflation in multiple comparisons.
3. Results
There was a significant effect of point areas (F (2, 32) = 274.756, p < 0.001, η 2 p = 0.945), and conditions (F (2, 32) = 85.612, p < 0.001, η 2 p = 0.843), as well as a significant point area × condition interaction (F (4, 64) = 7.077, p < 0.001, η 2 p = 0.307) (Table 1).
Table 1
Interaction between conditions and points areas
| Source | Correction | df | Mean square | F | Sig. | Partial eta squared | ε |
|---|---|---|---|---|---|---|---|
| Point area | Greenhouse-Geisser | 1.228 | 1187.745 | 274.756 | 0.001 | 0.945 | 0.614 |
| Condition | Greenhouse-Geisser | 1.414 | 52.050 | 85.612 | 0.001 | 0.843 | 0.707 |
| Point area × Condition | Greenhouse-Geisser | 2.514 | 23.094 | 7.077 | 0.001 | 0.307 | 0.629 |
Greenhouse-Geisser correction was applied due to violation of sphericity (ε = 0.614 for point area; ε = 0.707 for condition; ε = 0.629 for Point area × Condition). η 2 p = partial eta squared. n = 17 per condition.
Pairwise comparisons with Bonferroni correction revealed significant differences between point area 5 and point area 1 (mean difference = 6.588, 95% confidence interval (CI) [5.752, 7.425], p < 0.001), and between point area 3 and point area 1 (mean difference = 6.510, 95% CI [5.752, 7.425], p < 0.001). No significant difference was found between point area 5 and point area 3 (mean difference = −0.078, 95% CI [−0.396, 0.239], p = 0.608) (Table 2).
Table 2
Point area pairwise comparison
| Point Area | Mean Diff. | Std. error Diff. | Sig.bonf | Effect size | |
|---|---|---|---|---|---|
| Point area 5 | Point area 3 | −0.078 | 0.150 | 0.608 | 0.063 |
| Point area 5 | Point area 1 | −6.588 | 0.395 | 0.001 | 2.025 |
| Point area 3 | Point area 1 | −6.51 | 0.366 | 0.001 | 2.156 |
Pairwise comparisons with Bonferroni correction. n = 17 per condition. *p < 0.001 significant effect.
Similarly, significant differences were detected between each condition (p < 0.001) (Table 3).
Table 3
Conditions pairwise comparison
| Condition | Mean Diff. | Std. error Diff. | Sig.bonf | Effect size | |
|---|---|---|---|---|---|
| CC | VMC1 | −1.118 | 0.162 | 0.001 | 1.679 |
| CC | VMC2 | −1.667 | 0.131 | 0.001 | 3.087 |
| VMC1 | VMC2 | −0.549 | 0.085 | 0.001 | 1.558 |
CC = control condition; VMC1 = video modelling condition 1 (single exposure); VMC2 = video modelling condition 2 (repeated exposure). Pairwise comparisons with Bonferroni correction. n = 17 per condition. *p < 0.05 significant effect.
ANOVA findings revealed significant differences across the three conditions for successful serve (F (2, 32) = 85.612, p < 0.001, η 2 p = 0.843) and ball impact (F (2, 32) = 70.288, p < 0.001, η 2 p = 0.815), (Table 4).
Table 4
ANOVA results for successful serve, ball speed, and ball impact across conditions
| Correction | df | Mean square | F | Sig. | Partial eta squared | ε | |
|---|---|---|---|---|---|---|---|
| Succeful_Service | Greenhouse-Geisser | 1.414 | 156.149 | 85.612 | 0.001 | 0.843 | 0.707 |
| Ball_Speed | Sphericity assumed | 2 | 1.938 | 1.652 | 0.208 | 0.094 | 1.000 |
| Ball_Impact | Sphericity assumed | 2 | 103.767 | 70.288 | 0.001 | 0.815 | 1.000 |
Greenhouse-Geisser correction was applied for successful serve (ε = 0.707). Sphericity was assumed for ball speed and ball impact (ε = 1.000). η 2 p = partial eta squared. n = 17 per condition.
Pairwise comparisons with Bonferroni correction indicated that VMC2 significantly outperformed VMC1 and CC for successful serves, with mean differences of 1.65 (95% CI [1.10, 2.19]) and 5.00 (95% CI [4.17, 5.83]), respectively. Similarly, for ball impact, VMC2 produced significantly better scores than VMC1 and CC, with mean differences of 1.61 (95% CI [0.96, 2.26]) and 4.85 (95% CI [3.91, 5.79]), respectively, and no significant effect was observed for ball speed (p = 0.116–0.458) (Table 5).
Table 5
Pairwise comparisons for successful serve, ball speed, and ball impact across conditions
| Measure | Condition | Mean Diff. | Std. error Diff. | Sig.bonf | Effect size | |
|---|---|---|---|---|---|---|
| Succeful_Service | 1 | 2 | −3.353 | 0.485 | 0.001 | 1.678 |
| 1 | 3 | −5 | 0.393 | 0.001 | 3.086 | |
| 2 | 3 | −1.647 | 0,256 | 0.001 | 1.558 | |
| Ball_Speed | 1 | 2 | 0.671 | 0.404 | 0.116 | 0.403 |
| 1 | 3 | 0.404 | 0.357 | 0.275 | 0.274 | |
| 2 | 3 | −0.267 | 0.352 | 0.458 | 0.184 | |
| Ball_Impact | 1 | 2 | −3.244 | 0.481 | 0.001 | 1.636 |
| 1 | 3 | −4.85 | 0.443 | 0.001 | 2.656 | |
| 2 | 3 | −1.606 | 0.306 | 0.001 | 1.273 |
Pairwise comparisons with Bonferroni correction. CC = control condition; VMC1 = video modelling condition 1; VMC2 = video modelling condition 2. *p < 0.001 significant effect.
We found a significant effect of conditions (F (2, 32) = 55.402, p < 0.001, η 2 p = 0.776), tests (F (3, 48) = 33.049, p < 0.001, η 2 p = 0.674), and their interaction (F (6, 96) = 25.399, p < 0.001, η 2 p = 0.614) for point area 1 (Table 6).
Table 6
ANOVA results for condition, test, and their interaction for point area 1
| Source | Correction | df | Mean square | F | Sig. | Partial eta squared | ε |
|---|---|---|---|---|---|---|---|
| Condition | Sphericity assumed | 2 | 189.987 | 55.402 | 0.001 | 0.776 | 1.000 |
| Test | Greenhouse-Geisser | 1.362 | 224.276 | 33.049 | 0.001 | 0.674 | 0.454 |
| Condition × Test | Greenhouse-Geisser | 3.029 | 58.299 | 25.399 | 0.001 | 0.614 | 0.505 |
Greenhouse-Geisser correction was applied for Test (ε = 0.454) and Condition × Test (ε = 0.505). Sphericity was assumed for Condition (ε = 1.000). η 2 p = partial eta squared. n = 17 per condition.
Pairwise comparisons with Bonferroni correction revealed significant differences between all conditions (p < 0.001) and between all tests (p < 0.001) (Tables 7 and 8). Specifically, for point area 1, VMC2 significantly outperformed VMC1 and CC, with mean differences of 1.20 (95% CI [0.67, 1.73]) and 3.30 (95% CI [2.63, 3.98]), respectively. VMC1 also significantly outperformed CC (mean difference = 2.10, 95% CI [1.31, 2.89]).
Table 7
Pairwise comparisons between conditions for point area 1
| Condition | Mean Diff. | Std. Error Diff. | Sig.bonf | Effect size | |
|---|---|---|---|---|---|
| CC | VMC1 | −2.099 | 0.372 | 0.001 | 1.370 |
| CC | VMC2 | −3.303 | 0.319 | 0.001 | 2.509 |
| VMC1 | VMC2 | −1.204 | 0.250 | 0.001 | 1.168 |
Pairwise comparisons with Bonferroni correction. CC = control condition; VMC1 = video modelling condition 1; VMC2 = video modelling condition 2. *p < 0.001 significant effect.
Table 8
Pairwise comparisons between tests for point area 1
| Test | Mean Diff. | Std. error Diff. | Sig.bonf | Effect size | |
|---|---|---|---|---|---|
| Point area 1 | SS | −1.529 | 0.154 | 0.001 | 2.407 |
| Point area 1 | BS | 1.65 | 0.499 | 0.004 | 0.801 |
| Point area 1 | BI | −1.076 | 0.253 | 0.001 | 1.033 |
| SS | BS | 3.179 | 0.471 | 0.001 | 1.637 |
| SS | BI | 0.454 | 0.181 | 0.023 | 0.608 |
| BS | BI | −2.726 | 0.365 | 0.001 | 1.809 |
Pairwise comparisons with Bonferroni correction. SS = Successful Serve; BS = Ball Speed; BI = Ball Impact. *p < 0.05 significant effect.
Furthermore, for point area 3, there was a significant effect of conditions (F (2, 32) = 53.134, p < 0.001, η 2 p = 0.769), tests (F (3, 48) = 211.774, p < 0.001, η 2 p = 0.930), and their interaction (F (6, 96) = 41.187, p < 0.001, η 2 p = 0.720), (Table 9).
Table 9
ANOVA results for condition, test, and their interaction for point area 3
| Source | Correction | df | Mean square | F | Sig. | Partial eta squared | ε |
|---|---|---|---|---|---|---|---|
| Condition | Sphericity Assumed | 2 | 106.964 | 53.134 | 0.001 | 0.769 | 1.000 |
| Test | Greenhouse-Geisser | 1.904 | 1095.228 | 211.774 | 0.001 | 0.930 | 0.635 |
| Condition × Test | Greenhouse-Geisser | 2.683 | 82.093 | 41.187 | 0.001 | 0.720 | 0.447 |
Greenhouse-Geisser correction was applied for Test (ε = 0.635) and Condition × Test (ε = 0.447). Sphericity was assumed for Condition (ε = 1.000). η 2 p = partial eta squared. n = 17 per condition.
Pairwise comparisons with Bonferroni correction revealed significant differences between all conditions (p < 0.001) and between all tests (p < 0.001) (Tables 10 and 11). Specifically, for point area 3, VMC2 significantly outperformed VMC1 and CC, with mean differences of 0.91 (95% CI [0.53, 1.29]) and 2.48 (95% CI [1.91, 3.05]), respectively. VMC1 also significantly outperformed CC (mean difference = 1.57, 95% CI [1.00, 2.14]).
Table 10
Pairwise comparisons between conditions for point area 3
| Condition | Mean Diff. | Std. error Diff. | Sig.bonf | Effect size | |
|---|---|---|---|---|---|
| CC | VMC1 | −1.57 | 0.267 | 0.001 | 1.424 |
| CC | VMC2 | −2.479 | 0.271 | 0.001 | 2.220 |
| VMC1 | VMC2 | −0.91 | 0.181 | 0.001 | 1.219 |
Pairwise comparisons with Bonferroni correction. CC = control condition; VMC1 = video modelling condition 1; VMC2 = video modelling condition 2. *p < 0.001 significant effect.
Table 11
Pairwise comparisons between tests for point area 3
| Test | Mean Diff. | Std. error Diff. | Sig.bonf | Effect size | |
|---|---|---|---|---|---|
| Point area 3 | SS | −8.039 | 0.284 | 0.001 | 3.430 |
| Point area3 | BS | −4.86 | 0.423 | 0.001 | 2.784 |
| Point area3 | BI | −7.586 | 0.352 | 0.001 | 2.611 |
| SS | BS | 3.179 | 0.471 | 0.001 | 1.637 |
| SS | BI | 0.454 | 0.181 | 0.023 | 0.608 |
| BS | BI | −2.726 | 0.365 | 0.001 | 1.809 |
Pairwise comparisons with Bonferroni correction. SS = Successful Serve; BS = Ball Speed; BI = Ball Impact. *p < 0.05 significant effect.
For point area 5, there was a significant effect of conditions (F (2, 32) = 65.551, p < 0.001, η 2 p = 0.804), tests (F (3, 48) = 206.675, p < 0.001, η 2 p = 0.928), and their interaction (F (6, 96) = 34.816, p < 0.001, η 2 p = 0.685) (Table 12).
Table 12
ANOVA results for condition, test, and their interaction for point area 5
| Source | df | Mean square | F | Sig. | Partial eta squared | ε | |
|---|---|---|---|---|---|---|---|
| Condition | Sphericity assumed | 2 | 113.366 | 65.551 | 0.001 | 0.804 | 1.000 |
| Test | Greenhouse-Geisser | 1.998 | 1064.442 | 206.675 | 0.001 | 0.928 | 0.666 |
| Condition × Test | Greenhouse-Geisser | 2.991 | 70.423 | 34.816 | 0.001 | 0.685 | 0.499 |
Greenhouse-Geisser correction was applied for Test (ε = 0.666) and Condition × Test (ε = 0.499). Sphericity was assumed for Condition (ε = 1.000). η 2 p = partial eta squared. n = 17 per condition.
Pairwise comparisons with Bonferroni correction revealed significant differences between all conditions (p < 0.001) and between all tests (p < 0.001) (Tables 13 and 14). Specifically, for point area 5, VMC2 significantly outperformed VMC1 and CC, with mean differences of 0.94 (95% CI [0.59, 1.29]) and 2.55 (95% CI [2.03, 3.08]), respectively. VMC1 also significantly outperformed CC (mean difference = 1.61, 95% CI [1.08, 2.15]).
Table 13
Pairwise comparisons between conditions for point area 5
| Condition | Mean Diff. | Std. error Diff. | Sig.bonf | Effect size | |
|---|---|---|---|---|---|
| CC | VMC1 | −1.614 | 0.254 | 0.001 | 1.542 |
| CC | VMC2 | −2.553 | 0.247 | 0.001 | 2.503 |
| VMC1 | VMC2 | −0.939 | 0.164 | 0.001 | 1.388 |
Pairwise comparisons with Bonferroni correction. CC = control condition; VMC1 = video modelling condition 1; VMC2 = video modelling condition 2. *p < 0.001 significant effect.
Table 14
Pairwise comparisons between tests for point area 5
| Test | Mean Diff. | Std. error Diff. | Sig.bonf | Effect size | |
|---|---|---|---|---|---|
| Point area 5 | SS | −8.118 | 0.325 | 0.001 | 3.033 |
| Point area 5 | BS | −4.938 | 0.415 | 0.001 | 2.889 |
| Point area 5 | BI | −7.664 | 0.376 | 0.001 | 2.469 |
| SS | BS | 3.179 | 0.471 | 0.001 | 1.637 |
| SS | BI | 0.454 | 0.181 | 0.023 | 0.608 |
| BS | BI | −2.726 | 0.365 | 0.001 | 1.809 |
Pairwise comparisons with Bonferroni correction. SS = Successful Serve; BS = Ball Speed; BI = Ball Impact. *p < 0.05 significant effect.
4. Discussion
The aim of the present study was to investigate the acute effect of using EVM to improve tennis serve performance in 7- to 9-year-old boys tennis players. Accordingly, we found that observing EVM twice improves serve accuracy to a significantly greater extent than watching it once or receiving traditional training, which validates our hypothesis.
The improvement noted in our study could be attributed to the formation of a reliable internal reference through more frequent watching of EVM. Indeed, this repetition may be regarded as essential for comprehending the skill and tracking progress [15].
Relatedly, it has been suggested that the effectiveness of EM is greatest during the early stages of skill development and can be further enhanced through repeated observation. Scully and Newell [29] proposed that observing a skilled model improves learners’ ability to perceive the relative motion between body parts, allowing them to better integrate additional feedback or coaching to support skill acquisition, particularly in the initial phases of learning. This is especially relevant for young players, who are still developing the serve technique; widely considered one of the most challenging in tennis and requiring years of practice to master.
In the present study, we introduced a condition in which players observed the expert model twice, aiming to maximize the benefits of EVM. This repetition served as a baseline for evaluating and refining their own performance, encouraging participants to encode information from the expert demonstrations into visual working memory [4]. Such an approach may have enabled players to make technical corrections independently, thereby enhancing performance, accelerating learning, and improving motor-control precision [3,5].
Moreover, the second video modelling condition (VMC2) elicited greater improvements in both ball impact and the number of successful serves compared with VMC1, reinforcing the notion that repeated exposure to EM provides a reliable means of supporting skill retention and learning [30].
Consequently, the continual observation of the accurate model demonstration appears to enhance the precision and longevity of cognitive representation. Further, the findings of this study demonstrate that employing EVM in both VMC2 and VMC1 can improve precision, the number of successful serves, and ball impact in relation to the point areas (point areas 1, 3, and 5).
The results of this study corroborate the hypothesis, indicating that watching EVM one time elicited a greater impact on serve performance than typical training. Indeed, a significant improvement in ball impact, which comes from the players’ genuine efforts to place the ball in the required box to score more points, as well as the number of successful serves, were higher than in CC.
Evidently, EM is advantageous because viewing a proficient model makes it easier to learn the movement pattern required to properly do the skill [31]. Indeed, social cognitive theory suggests that information communicated by modelled performances is converted into a cognitive representation by means of selective attention to spatial and temporal aspects [32]. It appears that significant pieces of information regarding limb and body postures are picked up by the visual system and subsequently converted into suitable motor commands, allowing the players to roughly mimic the observed skill.
Moreover, expert models have been shown to assist acquisition by influencing attentional processes, also positively influencing performance by encouraging observers to use the knowledge they have gained through observation. Shafizadeh et al. [33] and Porter et al. [34] assert that coaches can significantly affect athletes’ performance by verbally modifying just one or two words in their instructions. However, in this study, the CC showed less favourable results compared to the other conditions. This result implies that, even if the VMC2 appears to be the optimal approach for increasing performance, the VMC1 still promises superior performance over the CC.
It is important to consider the results in the context of complex athletic skill development, such as the serve, which requires precise body movements and increasing strength over time, especially in 7- to 9-year-old boy’s players.
The mixed findings in the literature underscore that the effectiveness of video-based interventions is not uniform. For instance, Emmen et al. [18] investigated the effects of video-modelling and video-feedback on learning the tennis service in novices. Their results indicated that while video-feedback did not lead to a statistically significant improvement in service performance compared to a control group, the authors noted a trend toward enhanced performance for the group that combined modelling with feedback. This suggests that the mere presence of video is insufficient and that the integration of multiple viewing strategies may be crucial for learning. Similarly, Madou and Cottyn [35] examined the use of live delayed video feedback via iPads within a real-world physical education setting. Their findings showed no significant impact on motor skill learning, suggesting that simply introducing technology without structured pedagogical guidance may be insufficient to realize the potential of self-observation demonstrated in controlled laboratory settings. These contradictory results highlight the importance of considering contextual and methodological factors such as participant age, skill level, intervention duration, and the integration of instructional guidance when evaluating the efficacy of video-based learning tools.
Numerous limitations must be recognised. Initially, the sample size (n = 17) was rather little, constraining statistical accuracy and applicability. Although a power analysis indicated that 12 participants were sufficient to detect a medium effect size (f = 0.25) based on previous research (Guillot et al., 2013), this assumption was based on limited evidence, and the use of multiple dependent variables typically requires larger samples. Second, the predetermined sequence of conditions (CC, VMC1, VMC2) might have elicited order and practice effects, even with a 1-week washout interval between each condition. As a result, it is challenging to ascertain if the enhancements were attributable to video modelling or simply to repeated exposure to the assessment procedure. Nonetheless, given that this was an acute effect study aimed at evaluating the immediate efficacy of video modelling, the results ought to be regarded as first evidence. Third, the restricted age bracket (7–9 years) and the sole inclusion of male subjects constrain the applicability to female players and different age groups. The acute design assessed only immediate effects, and long-term retention was not examined. Subsequent investigations ought to utilise larger and more heterogeneous samples, counterbalanced or randomised methodologies, and longitudinal tracking to enhance causal inference and evaluate retention.
5. Conclusion
The present study sought to examine the acute effects of EVM on improving tennis serve performance under three conditions: control (CC), single exposure (VMC1), and repeated exposure (VMC2). Accordingly, our findings indicated that observing the expert model twice (VMC2) produced the greatest benefits, facilitating technical corrections, accelerating learning, and enhancing both the accuracy and durability of cognitive representations. These results suggest that EVM supports a deeper understanding of the relative motion between body segments, thereby enabling players to integrate augmented feedback and optimize skill acquisition more effectively. Nonetheless, it is crucial to recognise that the predetermined sequence of conditions (CC, VMC1, VMC2) constrains causal attribution, as the influences of repeated practice and order effects cannot be disentangled from the impact of video observation. Therefore, compared to traditional training, video modelling sessions were linked to greater instant performance scores. Future study should utilise counterbalanced designs to enhance causal inference.
Acknowledgement
Special thanks to all the players who participated in this study. Additionally, we are grateful to the house of youth Gremda, and the coaches who helped us to finish our study.
Funding information
Authors state no funding involved.
Author contributions
Conceptualization: Eya Kachouri: The preparation of the research program, The execution of research, The interpretation of data, Preparation of the manuscript; Conceptualization, Data curation, Formal analysis, Investigation, Methodology, Software, Validation, Visualization, Writing – original draft. Ghaith Ezeddine: Preparation of the manuscript: review & editing, Methodology. Hiba Kachouri: Preparation of the manuscript: review & editing, Methodology. Cain C. T. Clark: Preparation of the manuscript: English review- editing. Bessem Mkaouer: The statistical analysis: Formal analysis, Project administration, Supervision, Validation, Visualization, review & editing. Nafaa Souissi: The preparation of the research program: Project administration, Supervision, Validation, Visualization, review & editing.
Conflict of interest statement
The authors declare no potential conflicts of interest with respect to the research, authorship, and/or publication of this article.
Data availability statement
The data supporting this study are available from the corresponding author on reasonable request.