
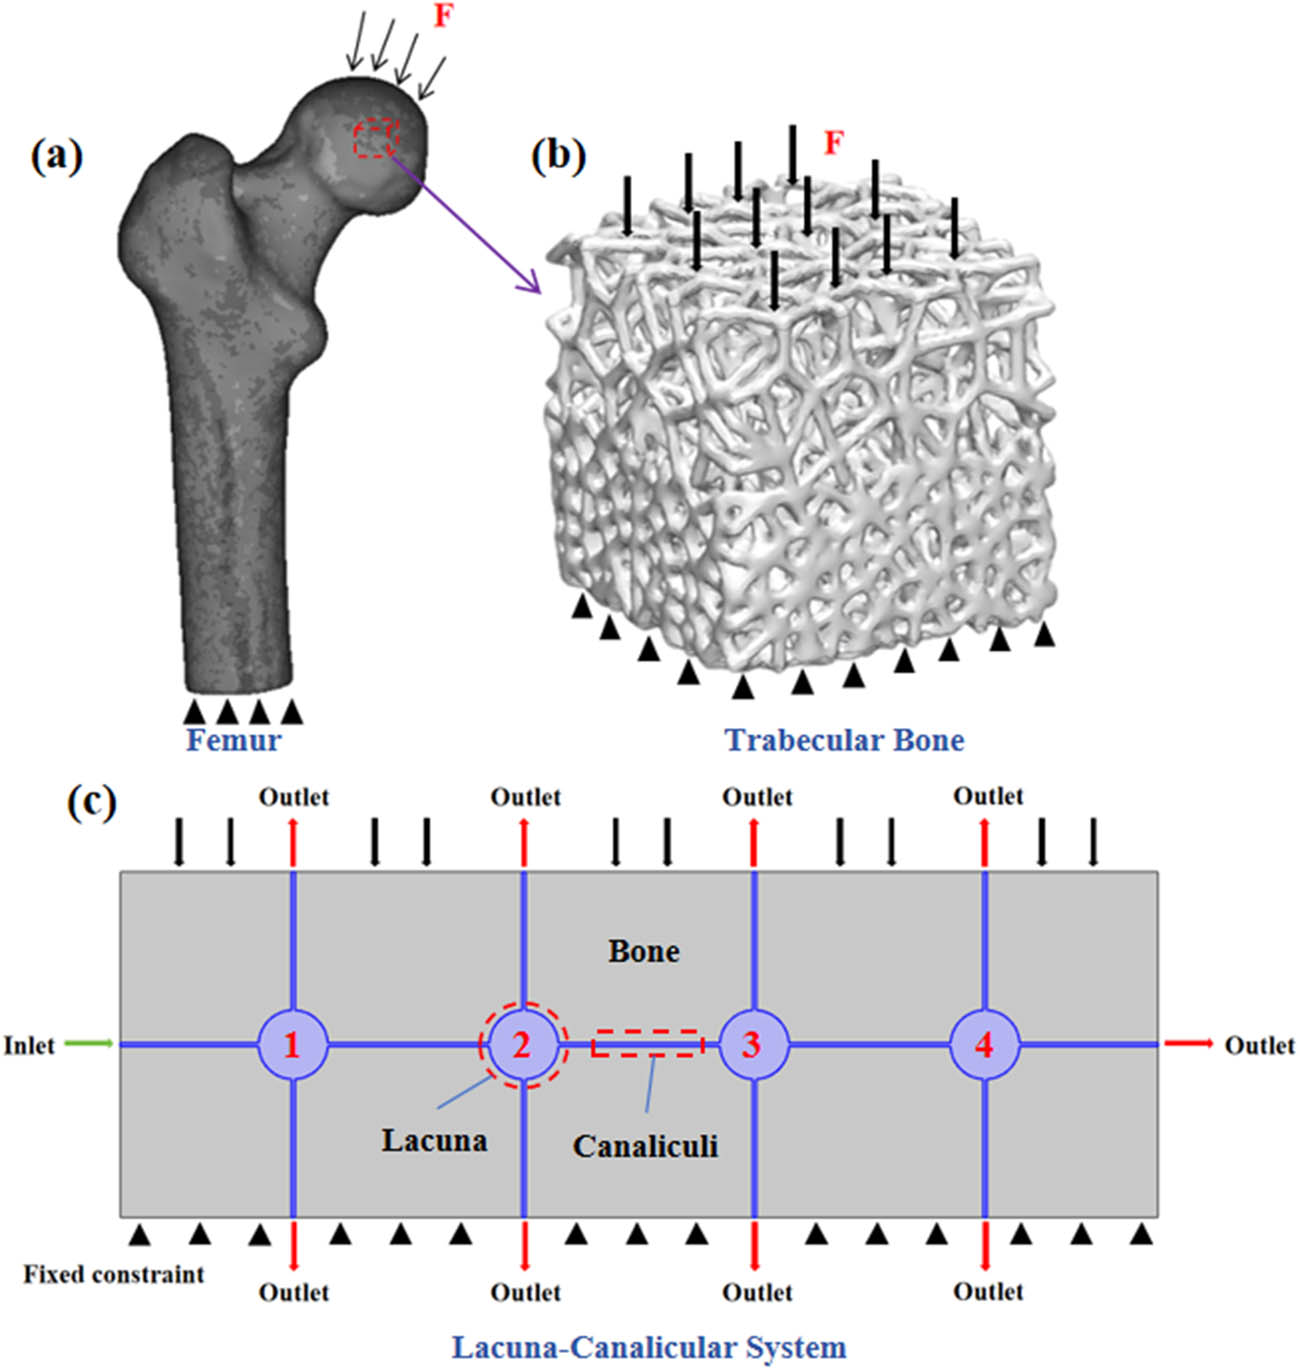
Figure 1
Model and boundary condition setting: (a) femur model and boundary condition, (b) trabecular bone model and boundary condition, and (c) LCS model and boundary condition.
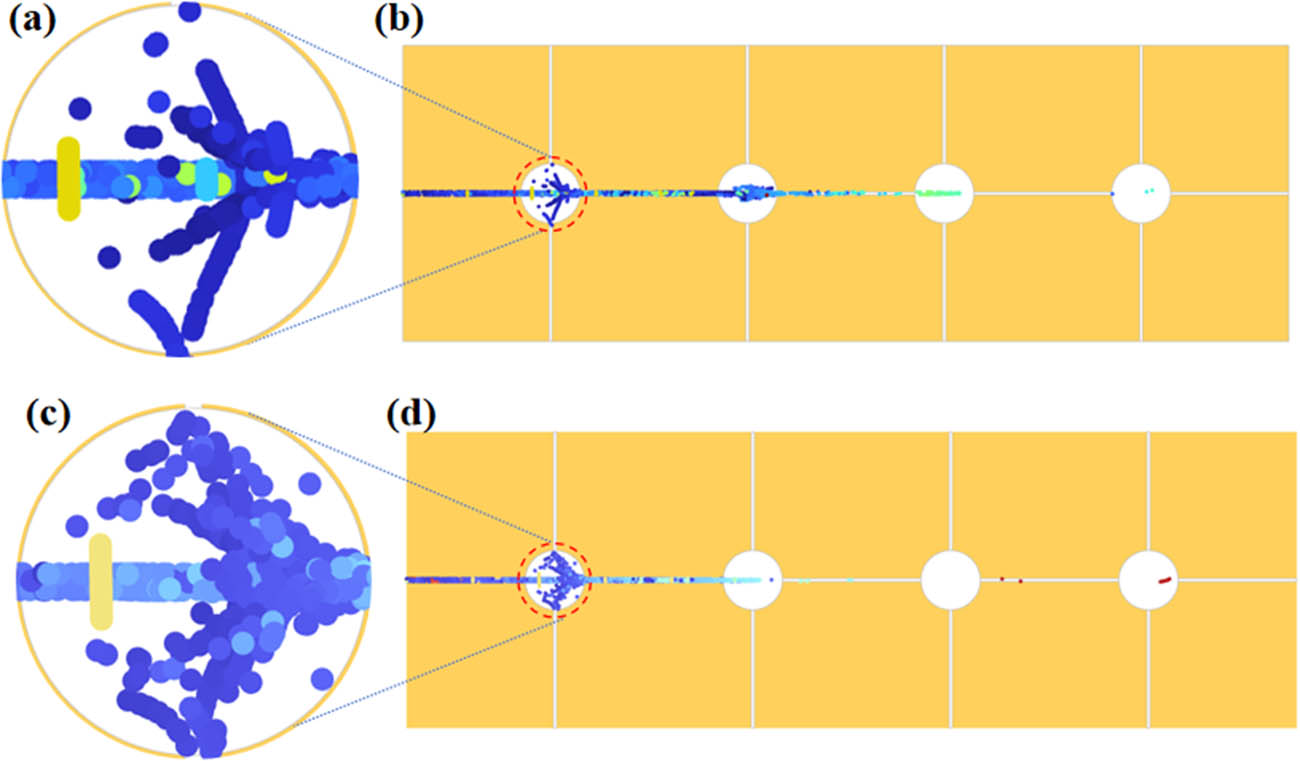
Figure 2
Comparison of substance transport rates in the LCS between firefighters and civilians under the same time condition: (a–b) firefighters, and (c–d) civilians.
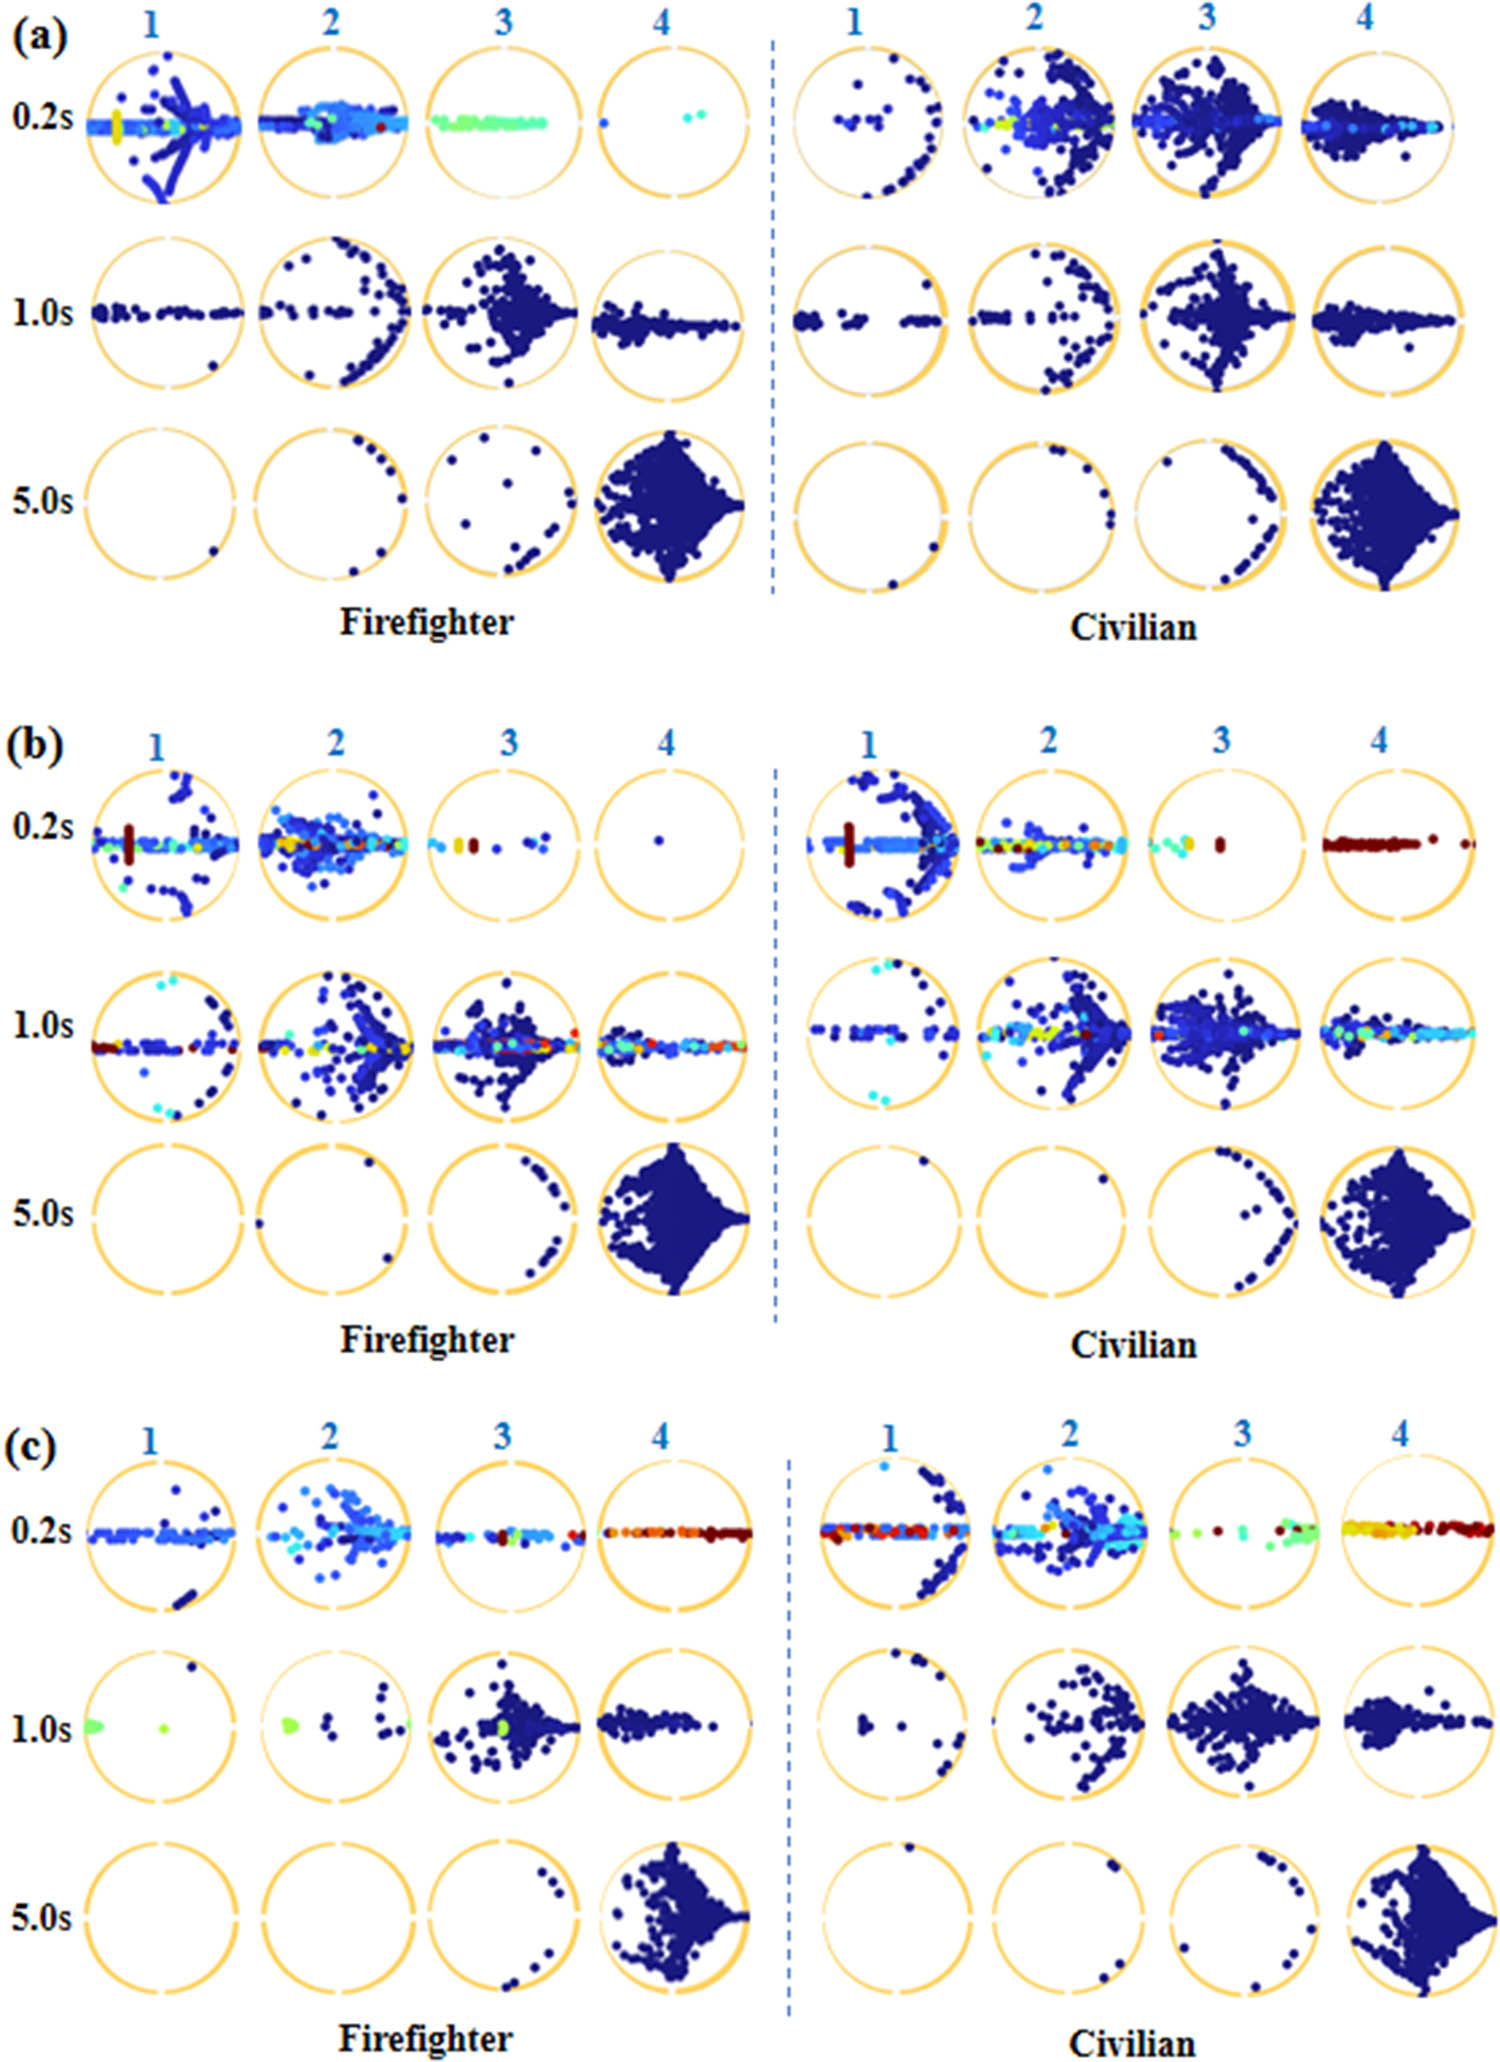
Figure 3
Solute transport patterns in the LCS for firefighters and civilians at different loading frequencies and time points: (a) 0.5 Hz, (b) 1 Hz, and (c) 2 Hz.
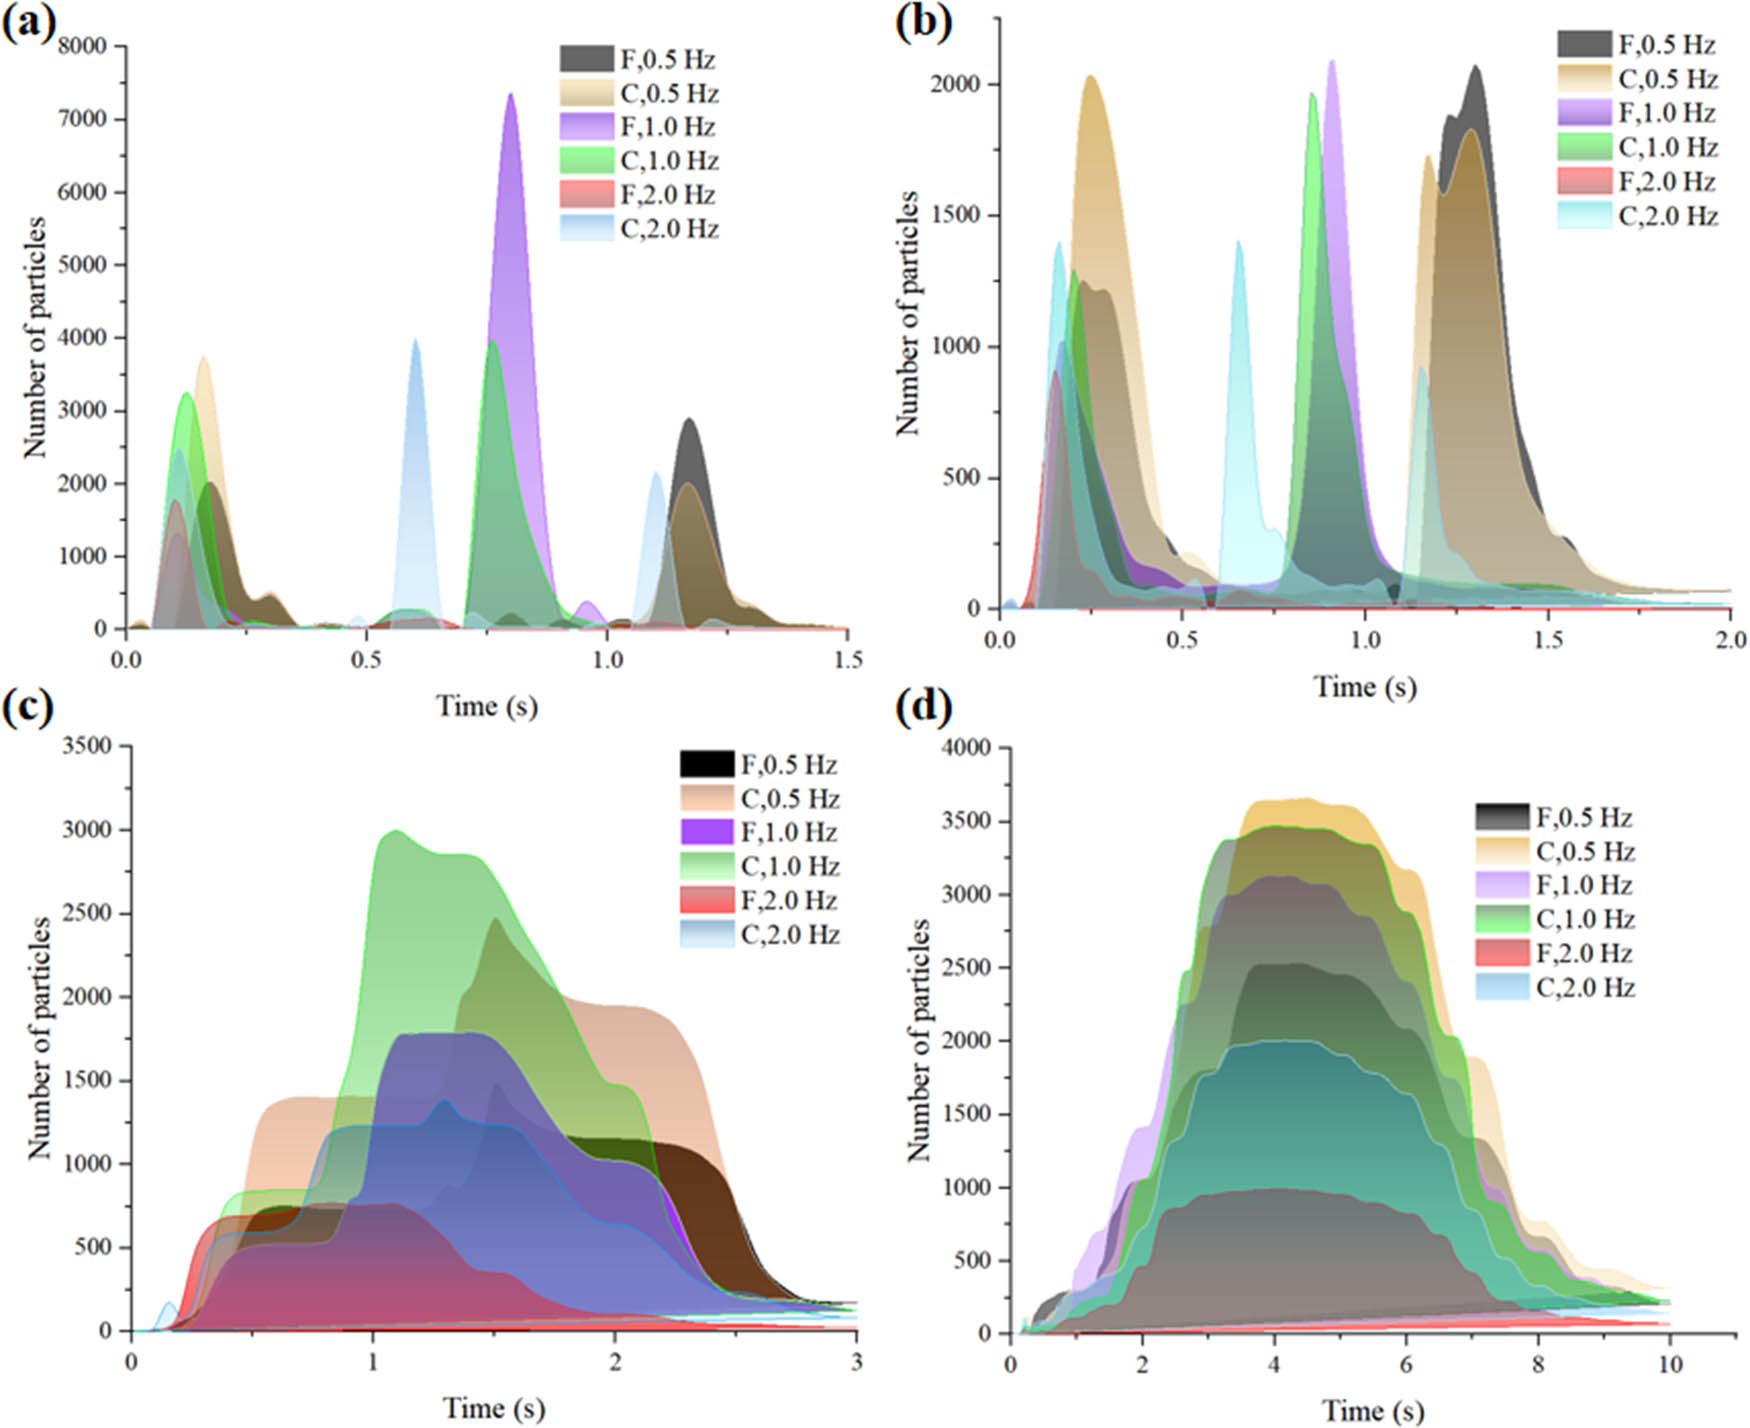
Figure 4
Quantity of substance particles in the LCS of firefighters and civilians under different loading frequencies: (a–d) correspond to lacunae 1–4, respectively.
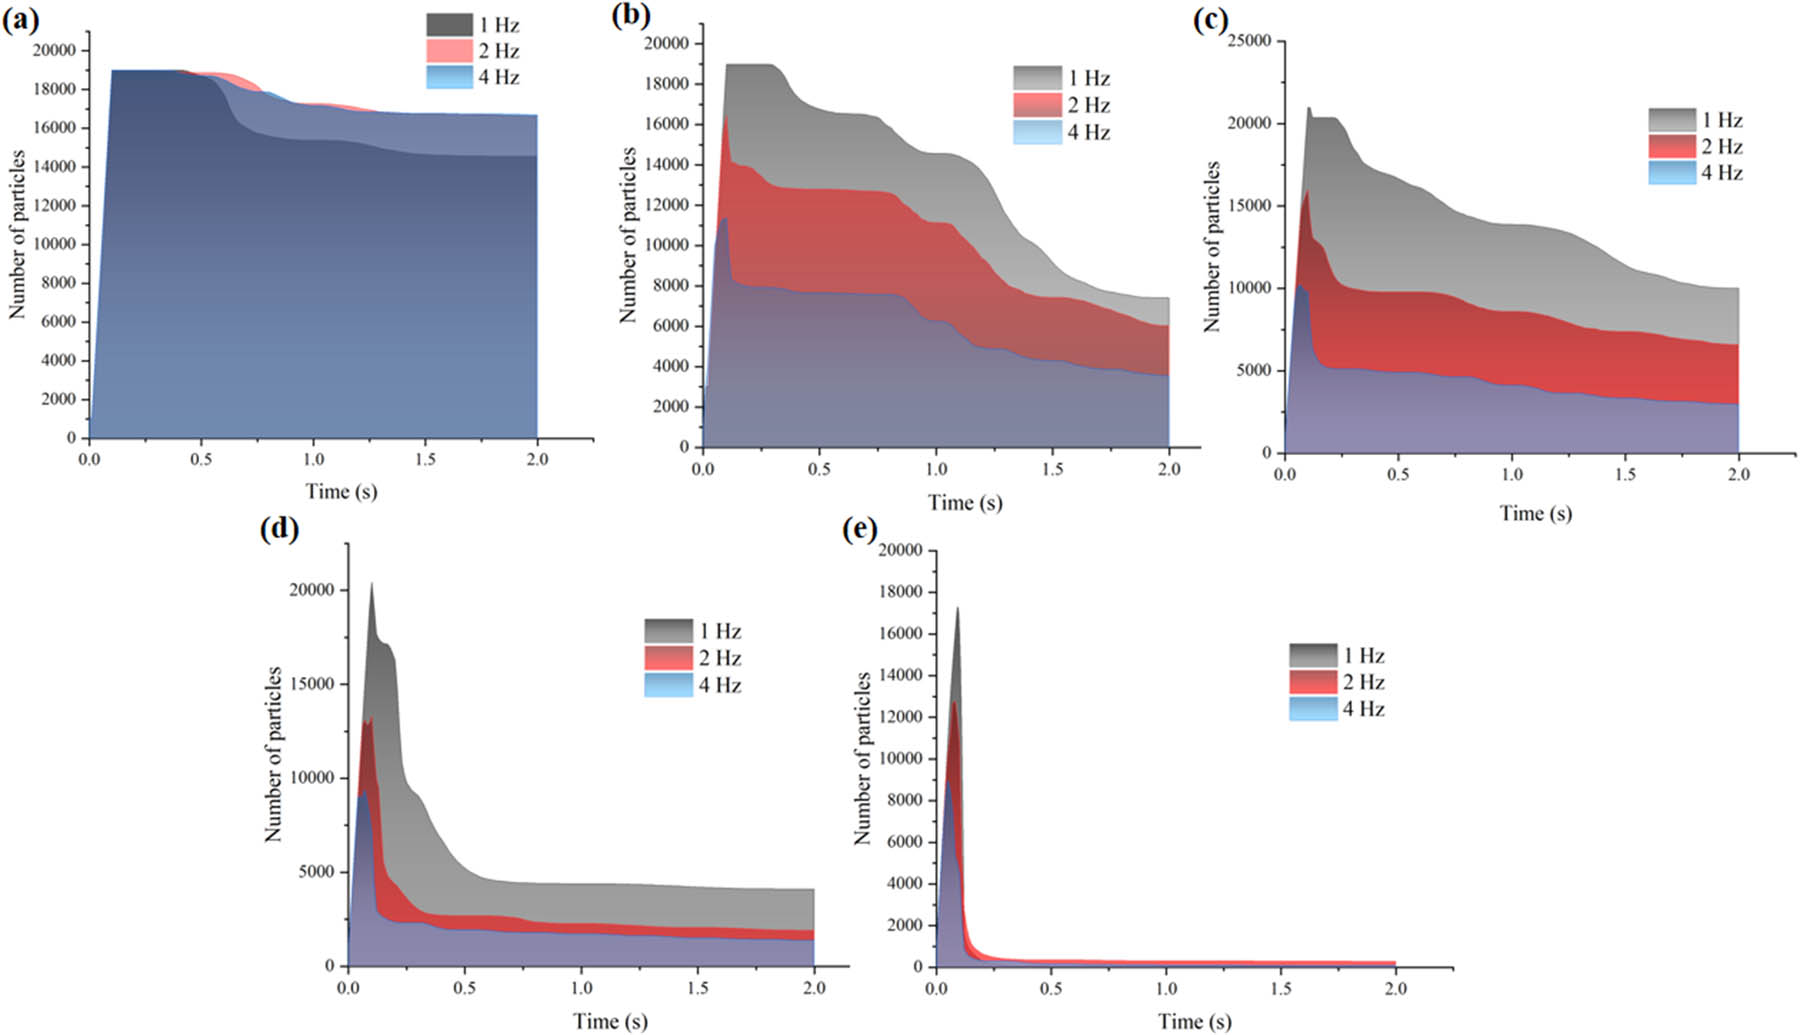
Figure 5
Statistics of particle transport quantity in the LCS under different cases: (a–e) the number of particles remaining in the LCS at different time points (with porosities of 0.012, 0.032, 0.06, 0.14, and 0.32, respectively).