
Table 1
Exercise program aimed at increasing joint angular velocity during uppercut execution in boxers

|
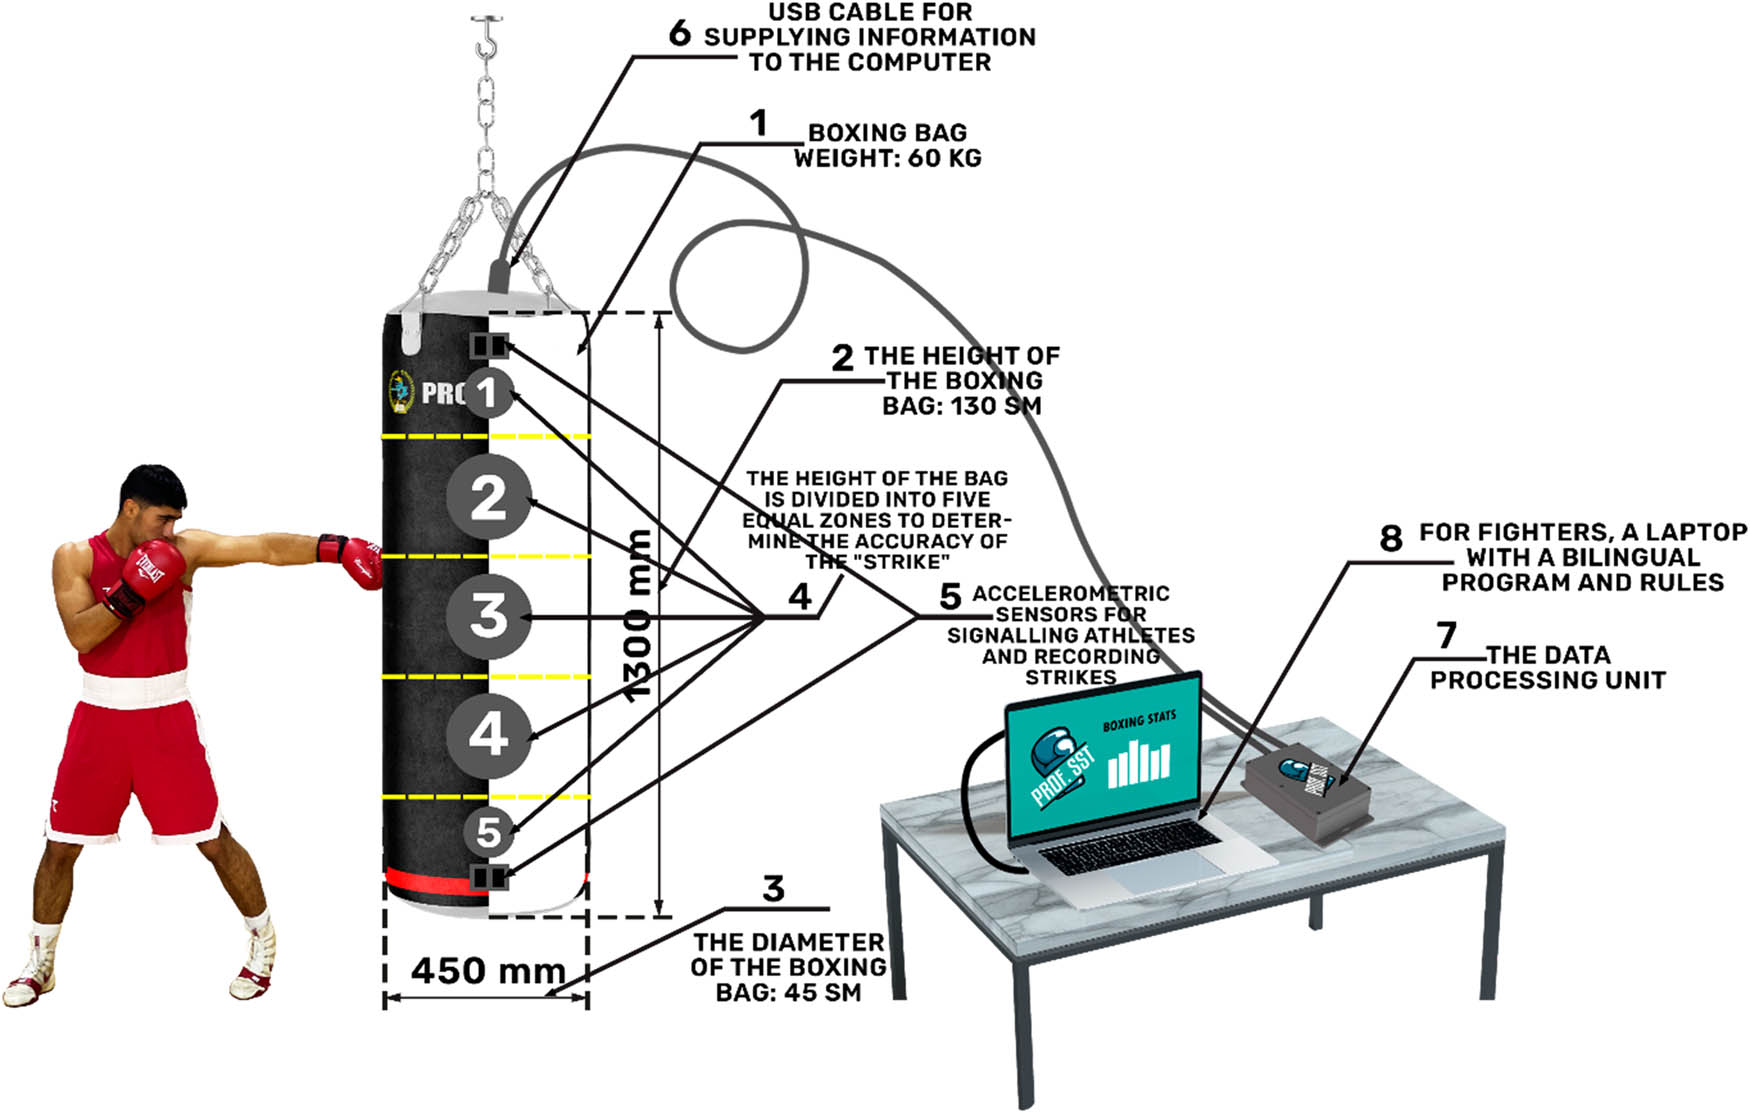
Figure 1
Hardware and software system for measuring punching performance in combat sports [24].
Source: Tajibaev et al. [24].
Table 2
Maximum joint angular velocity (°·s−1) during right-hand uppercut execution in EG and CG before (BE) and after (AE) the 8-week intervention (n = 24)
| Parameters | Stages | CG (M ± SD) | CV (%) | EG (M ± SD) | CV (%) | t | P | Cohen’s d |
|---|---|---|---|---|---|---|---|---|
| Shoulders | ||||||||
| Right shoulder flex/ext | BE AE | 685.28 ± 40.43 | 5.90% | 681.12 ± 38.15 | 5.67% | 0.62 | >0.05 | 0.11 |
| 691.50 ± 28.21 | 4.87% | 702 ± 42.26 | 6.02% | 2.21 | <0.05 | 0.29 | ||
| Left shoulder flex/ext | BE AE | 79.83 ± 4.36 | 5.47% | 75.84 ± 4.12 | 5.43% | 1.23 | >0.05 | 0.94 |
| 82 ± 4.46 | 5.43% | 88 ± 4.78 | 5.43% | 2.64 | <0.05 | 1.30 | ||
| Right shoulder flex/ext with vertical component | BE AE | 606.81 ± 30.72 | 5.06% | 598.45 ± 29.03 | 4.85% | 0.78 | >0.05 | 0.28 |
| 615 ± 30.50 | 4.96% | 650 ± 32.50 | 5% | 4.31 | <0.01 | 1.12 | ||
| Left shoulder flex/ext with vertical component | BE AE | 181.52 ± 10.69 | 5.95% | 176.39 ± 10.15 | 5.75% | 1.23 | >0.05 | 0.49 |
| 187 ± 10.95 | 5.85% | 194 ± 11.70 | 5.85% | 2.25 | <0.05 | 0.62 | ||
| Elbows | ||||||||
| Right elbow flex/ext | BE AE | 364.76 ± 28.90 | 7.92% | 356.52 ± 21.45 | 6% | 1.32 | >0.05 | 0.33 |
| 370 ± 29.30 | 7.92% | 394.01 ± 26.68 | 6.77% | 3.41 | <0.01 | 0.86 | ||
| Left elbow flex/ext | BE AE | 29.88 ± 4.85 | 16.23% | 28.39 ± 3 | 10.56% | 1.23 | >0.05 | 0.36 |
| 31 ± 5.03 | 16.23% | 35 ± 4 | 11.43% | 2.67 | <0.05 | 0.87 | ||
| Pelvis | ||||||||
| Pelvis rotation | BE AE | 321.12 ± 20.23 | 5.93% | 314.06 ± 4.22 | 5% | 0.87 | >0.05 | 0.40 |
| 350 ± 20.76 | 5.93% | 367 ± 17.52 | 4.93% | 4.31 | <0.01 | 0.88 | ||
| Pelvis Rotation (right segment) | BE AE | 357.93 ± 31.49 | 8.45% | 354.28 ± 22.92 | 6.47% | 0.63 | >0.05 | 0.13 |
| 385 ± 32.53 | 8.45% | 402 ± 27.49 | 6.84% | 2.29 | <0.05 | 0.56 | ||
| Pelvis rotation (left segment) | BE AE | 322.49 ± 17.23 | 5.18% | 315.87 ± 12.36 | 4% | 0.51 | >0.05 | 0.44 |
| 344 ± 17.61 | 5.18% | 351 ± 14.17 | 4.04% | 4.67 | <0.01 | 0.43 | ||
| Hips | ||||||||
| Right hip flex/ext | BE AE | 84.28 ± 9.42 | 11.17% | 80.07 ± 7 | 8.74% | 0.32 | >0.05 | 0.50 |
| 87 ± 9.72 | 11.18% | 95 ± 9 | 9.48% | 2.61 | <0.05 | 0.85 | ||
| Left hip flex/ext | BE AE | 101.76 ± 9.14 | 8.98% | 96.67 ± 5 | 5.27% | 2.12 | <0.05 | 0.68 |
| 105 ± 9.43 | 8.98% | 114 ± 9 | 7.89% | 4.21 | <0.01 | 0.98 | ||
| Right hip abd/add | BE AE | 59.71 ± 4.99 | 8.37% | 56.72 ± 4.74 | 8.35% | 1.33 | >0.05 | 0.61 |
| 62 ± 5.18 | 8.35% | 68 ± 5 | 7.35% | 3.23 | <0.01 | 1.17 | ||
| Left hip abd/add | BE AE | 62.27 ± 7.44 | 11.94% | 59.16 ± 4.11 | 7% | 1.65 | >0.05 | 0.52 |
| 65 ± 7.77 | 11.95% | 72 ± 6 | 8.33% | 3.64 | <0.05 | 1.01 | ||
| Knees | ||||||||
| Right knee flex/ext | BE AE | 86.24 ± 9.27 | 10.75% | 81.93 ± 6 | 7.32% | 2.62 | <0.05 | 0.55 |
| 90 ± 9.66 | 10.75% | 102 ± 7 | 6.86% | 5.21 | <0.01 | 1.42 | ||
| Left knee flex/ext | BE AE | 122.96 ± 11.33 | 8.79% | 128.51 ± 8 | 6.22% | 1.16 | >0.05 | 0.56 |
| 132 ± 11.60 | 8.79% | 141 ± 9 | 6.38% | 6.67 | <0.01 | 0.86 | ||
| Ankles | ||||||||
| Right ankle flex/ext | BE AE | 93.92 ± 7.38 | 7.86% | 89.22 ± 6.45 | 7.22% | 0.77 | >0.05 | 0.67 |
| 96 ± 7.55 | 7.86% | 105 ± 7 | 6.67% | 4.34 | <0.01 | 1.23 | ||
| Left ankle flex/ext | BE AE | 50.90 ± 5.38 | 10.56% | 48.36 ± 3 | 6.20% | 0.87 | >0.05 | 0.57 |
| 53 ± 5.60 | 10.57% | 59 ± 5 | 8.48% | 4.31 | <0.01 | 1.13 | ||
Note: BE – before experiment; AE – after experiment; CG – control group; EG – experimental group. All angular velocity values are expressed in degrees per second (°·s−1). Data are presented as mean value ± standard deviation (M + SD). CV (%) – coefficient of variation. t – Student’s t-test value; p – level of statistical significance. Cohen’s d represents the between-group standardized effect size (EG vs CG). The SEM for angular velocity ranged between 5 and 12°·s−1 depending on the joint. The CV ranged from 3% to 10%, indicating acceptable reliability of kinematic measurements. Intra-session reliability was high (ICC = 0.91–0.96).
Table 3
Analysis of uppercut punch force and accuracy in control and EG boxers (n = 24)
| Punch type | Stages | CG (Mean ± SD) | CV% | Accuracy | EG (Mean ± SD) | CV% | Accuracy | Cohen’s d |
|---|---|---|---|---|---|---|---|---|
| Uppercut punch (right-handed) | BE | 163.67 ± 14.32 | 8.74% | 70% | 161.67 ± 14.01 | 8.67% | 66% | −0.14 |
| AE | 174 ± 11 | 6.32% | 79% | 182.33 ± 12.74 | 6.98% | 84% | 0.70 |
Note: BE – before experiment; AE – after experiment; CG – control group; EG – experimental group. Data are presented as mean ± standard deviation (SD). CV% – coefficient of variation. Accuracy is expressed as the percentage of successful strikes delivered to the intended target. Cohen’s d represents the between-group standardized effect size (EG vs. CG), calculated separately for BE and AE. Effect sizes were interpreted as small (d ≈ 0.20), moderate (d ≈ 0.50), and large (d ≥ 0.80).