
Table 1
Volunteer information
| Information | Max. | Min. | X ± SD |
|---|---|---|---|
| Age (year) | 35 | 20 | 26 ± 3.2 |
| Height (cm) | 161 | 184 | 169.24 ± 6.41 |
| Weight (kg) | 49 | 82 | 66.43 ± 8.23 |
Table 2
ROM of joints
| Rehabilitation movement | Shoulder coronal plane ROM | Shoulder sagittal plane ROM | Shoulder transverse plane ROM | Elbow coronal plane ROM | Elbow sagittal plane ROM | Elbow transverse plane ROM |
|---|---|---|---|---|---|---|
| Elbow flexion | 0° | 0° | 0° | 0° | 0–91.5° | 0° |
| Horizontal adduction/abduction | 0° | 0° | 0–91.3° | 0° | 0° | 0–93.5° |
| Vertical abduction/adduction | 0° | −30.6–89.1° | 0° | 0° | 0° | 0° |
| Flexion/extension | 0–92.1° | 0° | 0° | 0° | 0° | 0° |
| Shoulder internal/external rotation | 0° | 0° | 0° | 0–62.4° | 0° | 0° |
| Elbow internal/external rotation | 0° | 0° | 0° | 0–29.5° | 0° | 0° |
Table 3
Summary of the DAS3 model
| Category | Item | Description |
|---|---|---|
| General information | Model name | DAS3 |
| Original source | DAS project | |
| Primary references | Chadwick et al., 2014 | |
| Skeletal structure | Segments | Thorax, clavicle, scapula, humerus, ulna, radius |
| Joint definition | Shoulder complex | Multi–joint system (SC, AC, GH joints) |
| Elbow joint | 1 degrees of freedom (DOF) (flexion/extension) | |
| Forearm joint | 1 DOF (pronation/supination) | |
| Musculotendon units | Muscle type | Hill–type muscle model |
| Applications | Biomechanics | Muscle force estimation, joint load analysis |
| Clinical | Rehabilitation assessment | |
| Engineering | Exoskeleton and prosthesis design |
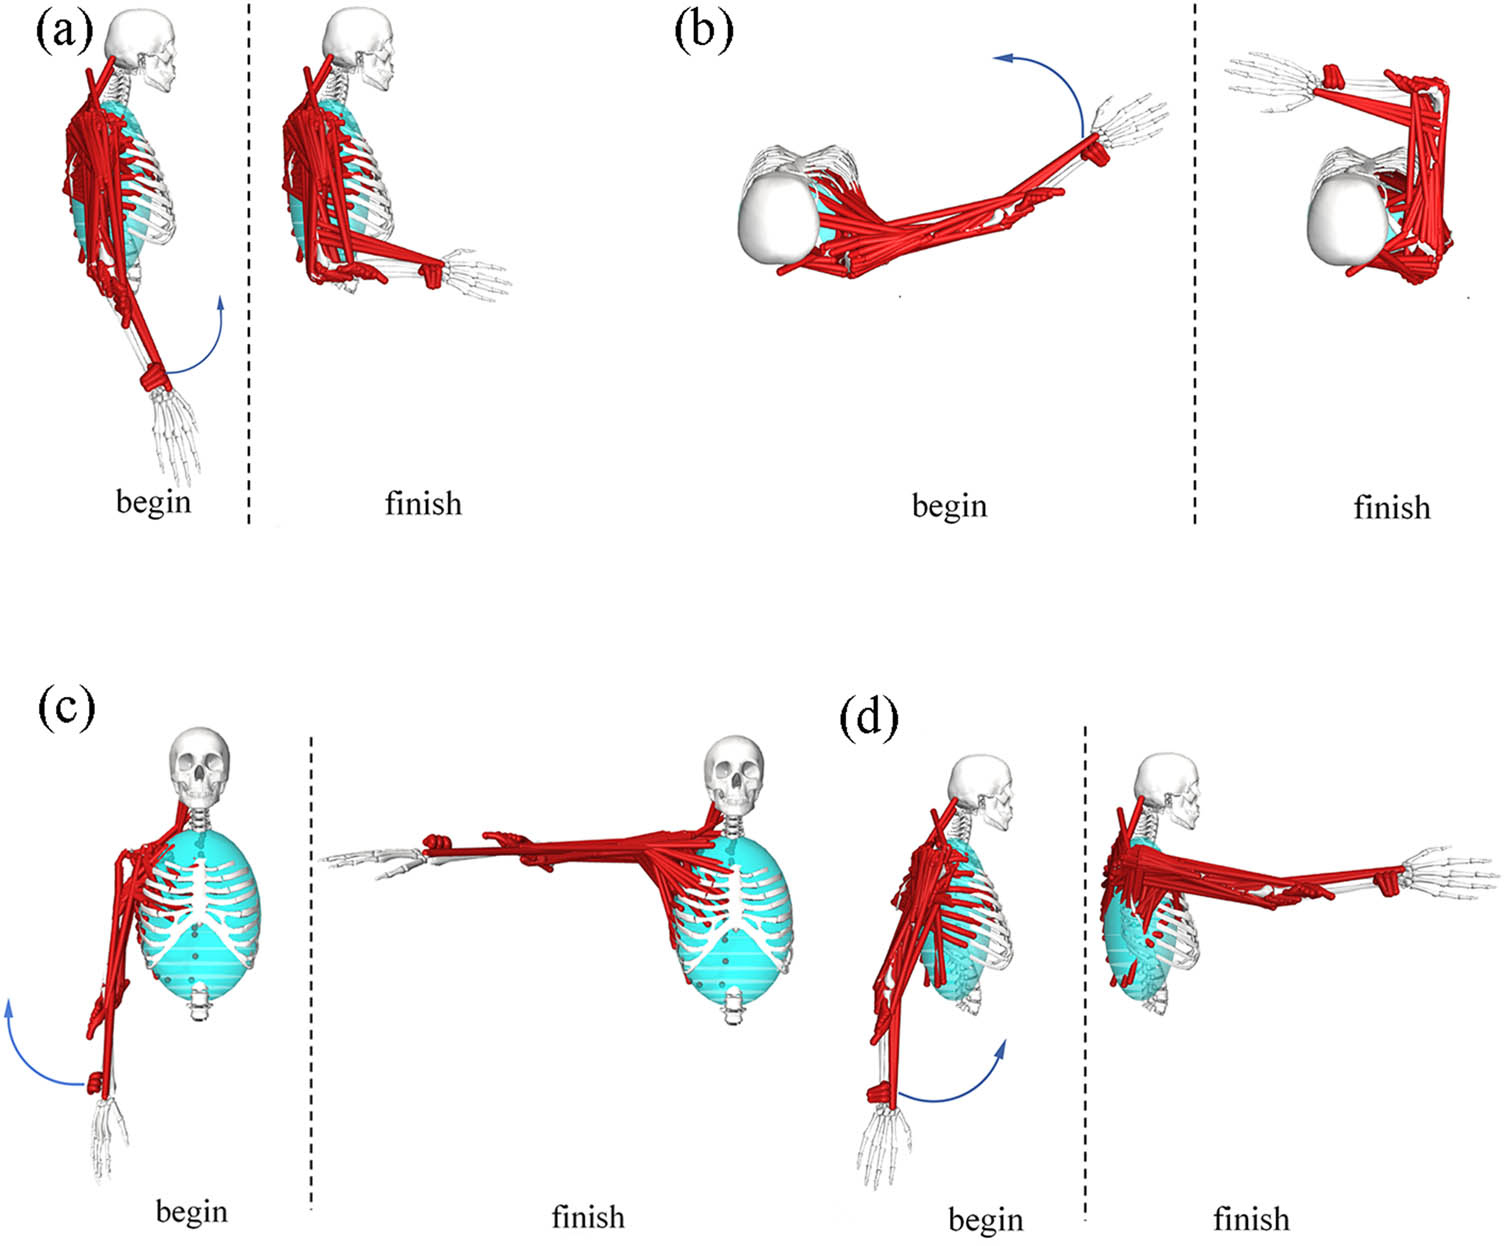
Figure 1
Simulation analysis of movement process: (a) elbow flexion, (b) horizontal adduction/abduction, (c) vertical abduction/adduction, and (d) flexion/extension.
Table 4
Shoulder joint IK
| Shoulder joint IK | Elbow flexion movement | Horizontal adduction/abduction movement | vertical abduction/adduction movement | Flexion/extension movement |
|---|---|---|---|---|
| 0–1 | 0°–0° | 0°–18.26° | −30.6°–6.66° | 0°–18.42° |
| 1–3 | 0°–0° | 18.26°–54.78° | 6.66°–41.22° | 18.42°–55.26° |
| 3–5 | 0°–0° | 54.78°–91.3° | 41.22°–89.1° | 55.26°–92.1° |
Table 5
Elbow joint IK
| Elbow joint IK | Elbow flexion movement | Horizontal adduction/abduction movement | vertical abduction/adduction movement | Flexion/extension movement |
|---|---|---|---|---|
| 0–1 | 0°–18.3° | 0°–18.7° | 0°–0° | 0°–0° |
| 1–3 | 18.3°–54.9° | 18.7°–56.1° | 0°–0° | 0°–0° |
| 3–5 | 54.9°–91.5° | 56.1°–93.5° | 0°–0° | 0°–0° |
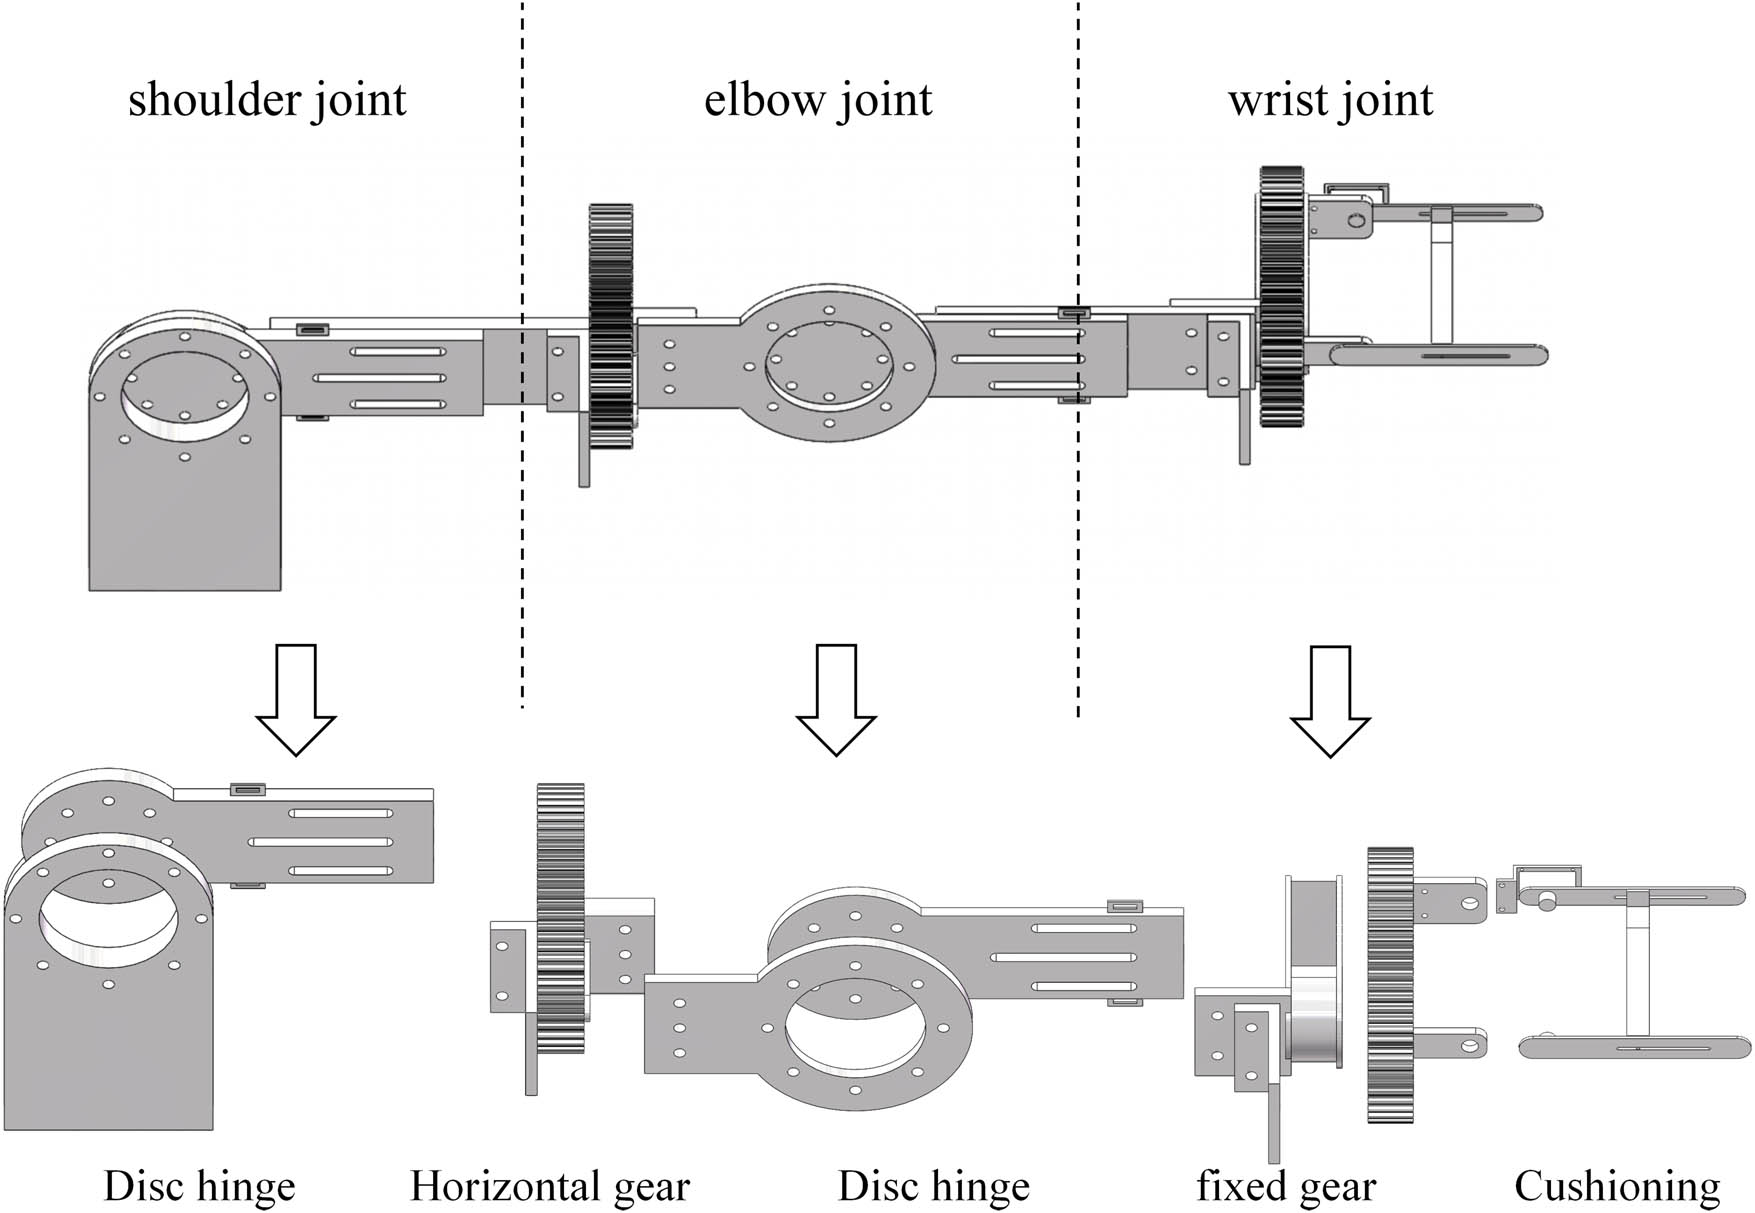
Figure 2
Exoskeleton mechanism.
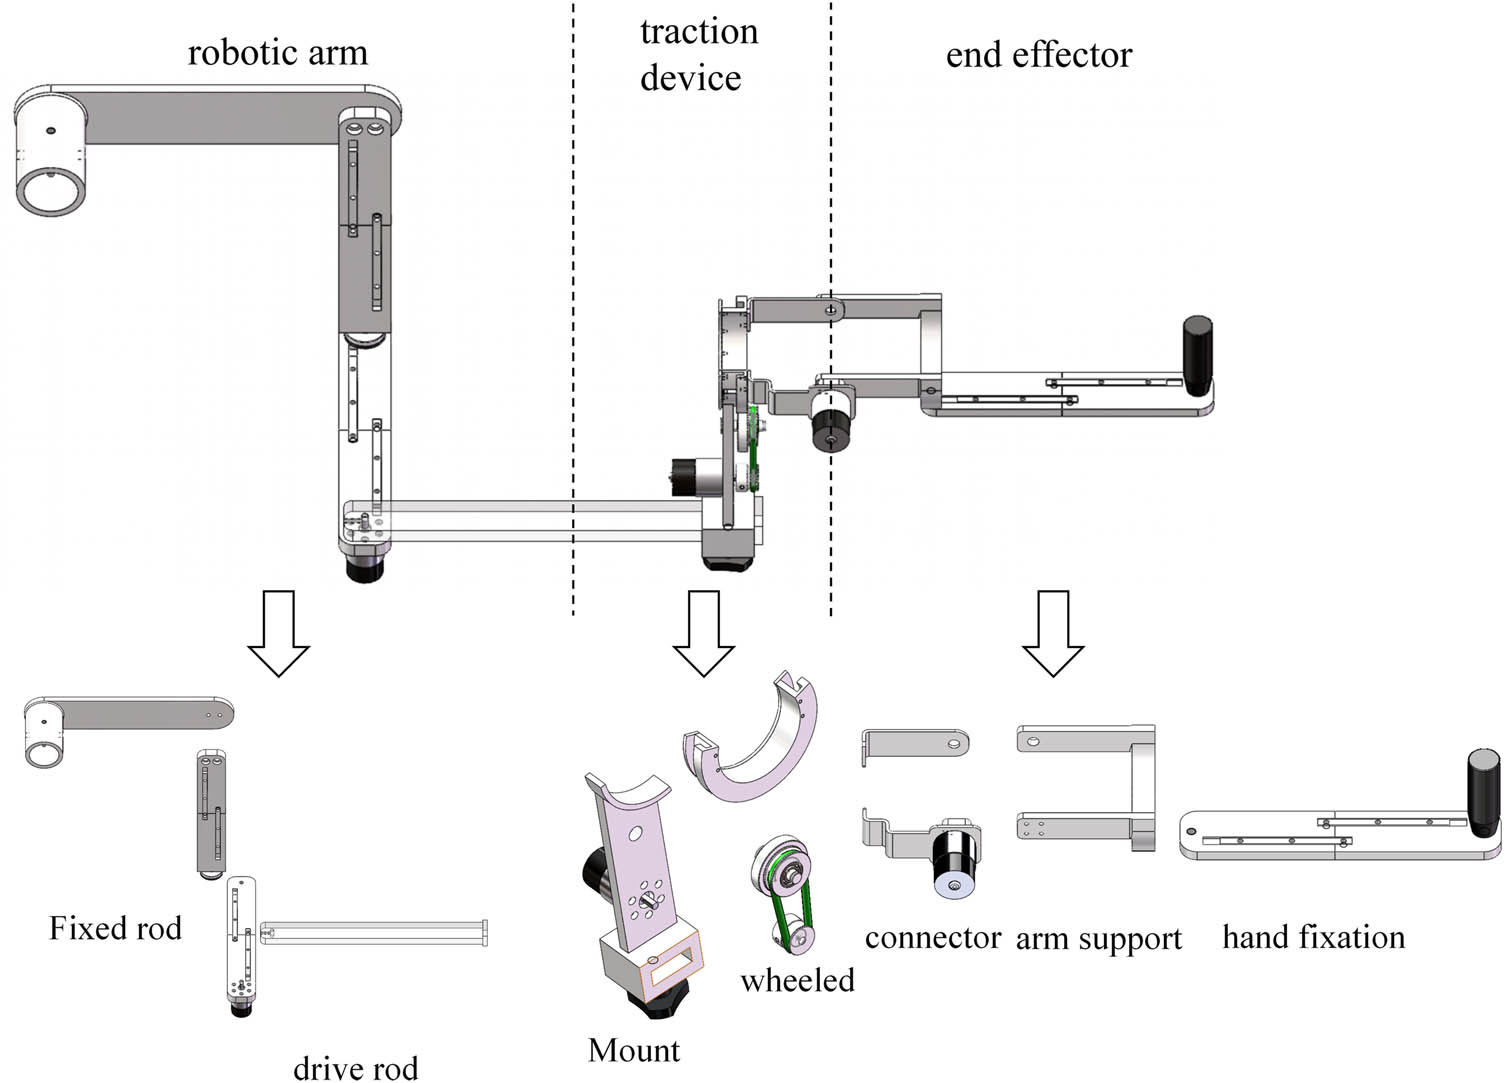
Figure 3
End–effector mechanism.
Table 6
Horizontal adduction/abduction trajectory data
| Time | Human X | Human Y | Exo X | Exo Y | End X | End Y |
|---|---|---|---|---|---|---|
| 0 | 0.5500 | 0.0000 | 0.5497 | 0.0174 | 0.5470 | −0.0519 |
| 0.25 | 0.5499 | 0.0088 | 0.5493 | 0.0267 | 0.5487 | −0.0335 |
| 0.5 | 0.5488 | 0.0348 | 0.5479 | 0.0459 | 0.5499 | 0.0073 |
| 0.75 | 0.5439 | 0.0771 | 0.5438 | 0.0778 | 0.5459 | 0.0650 |
| 1 | 0.5315 | 0.1335 | 0.5343 | 0.1231 | 0.5338 | 0.1267 |
| 1.25 | 0.5070 | 0.2006 | 0.5133 | 0.1861 | 0.5112 | 0.1928 |
| 1.5 | 0.4669 | 0.2728 | 0.4739 | 0.2620 | 0.4785 | 0.2564 |
| 1.75 | 0.4089 | 0.3431 | 0.4099 | 0.3422 | 0.4324 | 0.3197 |
| 2 | 0.3341 | 0.4042 | 0.3229 | 0.4113 | 0.3639 | 0.3848 |
| 2.25 | 0.2462 | 0.4492 | 0.2220 | 0.4578 | 0.2684 | 0.4421 |
| 2.5 | 0.1516 | 0.4740 | 0.1184 | 0.4777 | 0.1482 | 0.4769 |
| 2.75 | 0.0580 | 0.4776 | 0.0240 | 0.4739 | 0.0212 | 0.4763 |
| 3 | −0.0275 | 0.4625 | −0.0528 | 0.4544 | −0.0844 | 0.4450 |
| 3.25 | −0.0999 | 0.4337 | −0.1105 | 0.4280 | −0.1563 | 0.4026 |
| 3.5 | −0.1569 | 0.3975 | −0.1546 | 0.3992 | −0.1974 | 0.3668 |
| 3.75 | −0.1984 | 0.3602 | −0.1905 | 0.3682 | −0.2185 | 0.3434 |
| 4 | −0.2265 | 0.3268 | −0.2183 | 0.3373 | −0.2321 | 0.3256 |
| 4.25 | −0.2439 | 0.3008 | −0.2373 | 0.3111 | −0.2404 | 0.3133 |
| 4.5 | −0.2531 | 0.2845 | −0.2484 | 0.2930 | −0.2435 | 0.3085 |
| 4.75 | −0.2559 | 0.2790 | −0.2527 | 0.2851 | −0.2409 | 0.3124 |
| 5 | −0.2600 | 0.2751 | −0.2517 | 0.2844 | −0.2379 | 0.3129 |
Table 7
Flexion/extension trajectory data
| Time | Human X | Human Y | Exo X | Exo Y | End X | End Y |
|---|---|---|---|---|---|---|
| 0 | −0.2800 | −0.4734 | −0.2648 | −0.4820 | −0.3173 | −0.4490 |
| 0.25 | −0.2732 | −0.4773 | −0.2574 | −0.4860 | −0.3027 | −0.4590 |
| 0.5 | −0.2527 | −0.4885 | −0.2428 | −0.4935 | −0.2703 | −0.4789 |
| 0.75 | −0.2183 | −0.5048 | −0.2176 | −0.5051 | −0.2226 | −0.5029 |
| 1 | −0.1698 | −0.5231 | −0.1801 | −0.5197 | −0.1696 | −0.5232 |
| 1.25 | −0.1076 | −0.5394 | −0.1232 | −0.5360 | −0.1090 | −0.5391 |
| 1.5 | −0.0334 | −0.5490 | −0.0465 | −0.5480 | −0.0462 | −0.5480 |
| 1.75 | 0.0499 | −0.5477 | 0.0485 | −0.5479 | 0.0235 | −0.5494 |
| 2 | 0.1382 | −0.5323 | 0.1517 | −0.5287 | 0.1096 | −0.5389 |
| 2.25 | 0.2264 | −0.5012 | 0.2512 | −0.4892 | 0.2107 | −0.5080 |
| 2.5 | 0.3091 | −0.4549 | 0.3388 | −0.4330 | 0.3189 | −0.4481 |
| 2.75 | 0.3817 | −0.3960 | 0.4087 | −0.3678 | 0.4157 | −0.3597 |
| 3 | 0.4409 | −0.3288 | 0.4589 | −0.3031 | 0.4827 | −0.2623 |
| 3.25 | 0.4856 | −0.2583 | 0.4922 | −0.2453 | 0.5196 | −0.1777 |
| 3.5 | 0.5161 | −0.1900 | 0.5149 | −0.1933 | 0.5363 | −0.1195 |
| 3.75 | 0.5348 | −0.1286 | 0.5311 | −0.1428 | 0.5429 | −0.0866 |
| 4 | 0.5445 | −0.0776 | 0.5417 | −0.0953 | 0.5463 | −0.0633 |
| 4.25 | 0.5486 | −0.0397 | 0.5471 | −0.0564 | 0.5479 | −0.0479 |
| 4.5 | 0.5498 | −0.0165 | 0.5492 | −0.0300 | 0.5483 | −0.0428 |
| 4.75 | 0.5499 | −0.0086 | 0.5497 | −0.0184 | 0.5475 | −0.0501 |
| 5 | 0.5501 | −0.0089 | 0.5504 | −0.0094 | 0.5575 | −0.0511 |
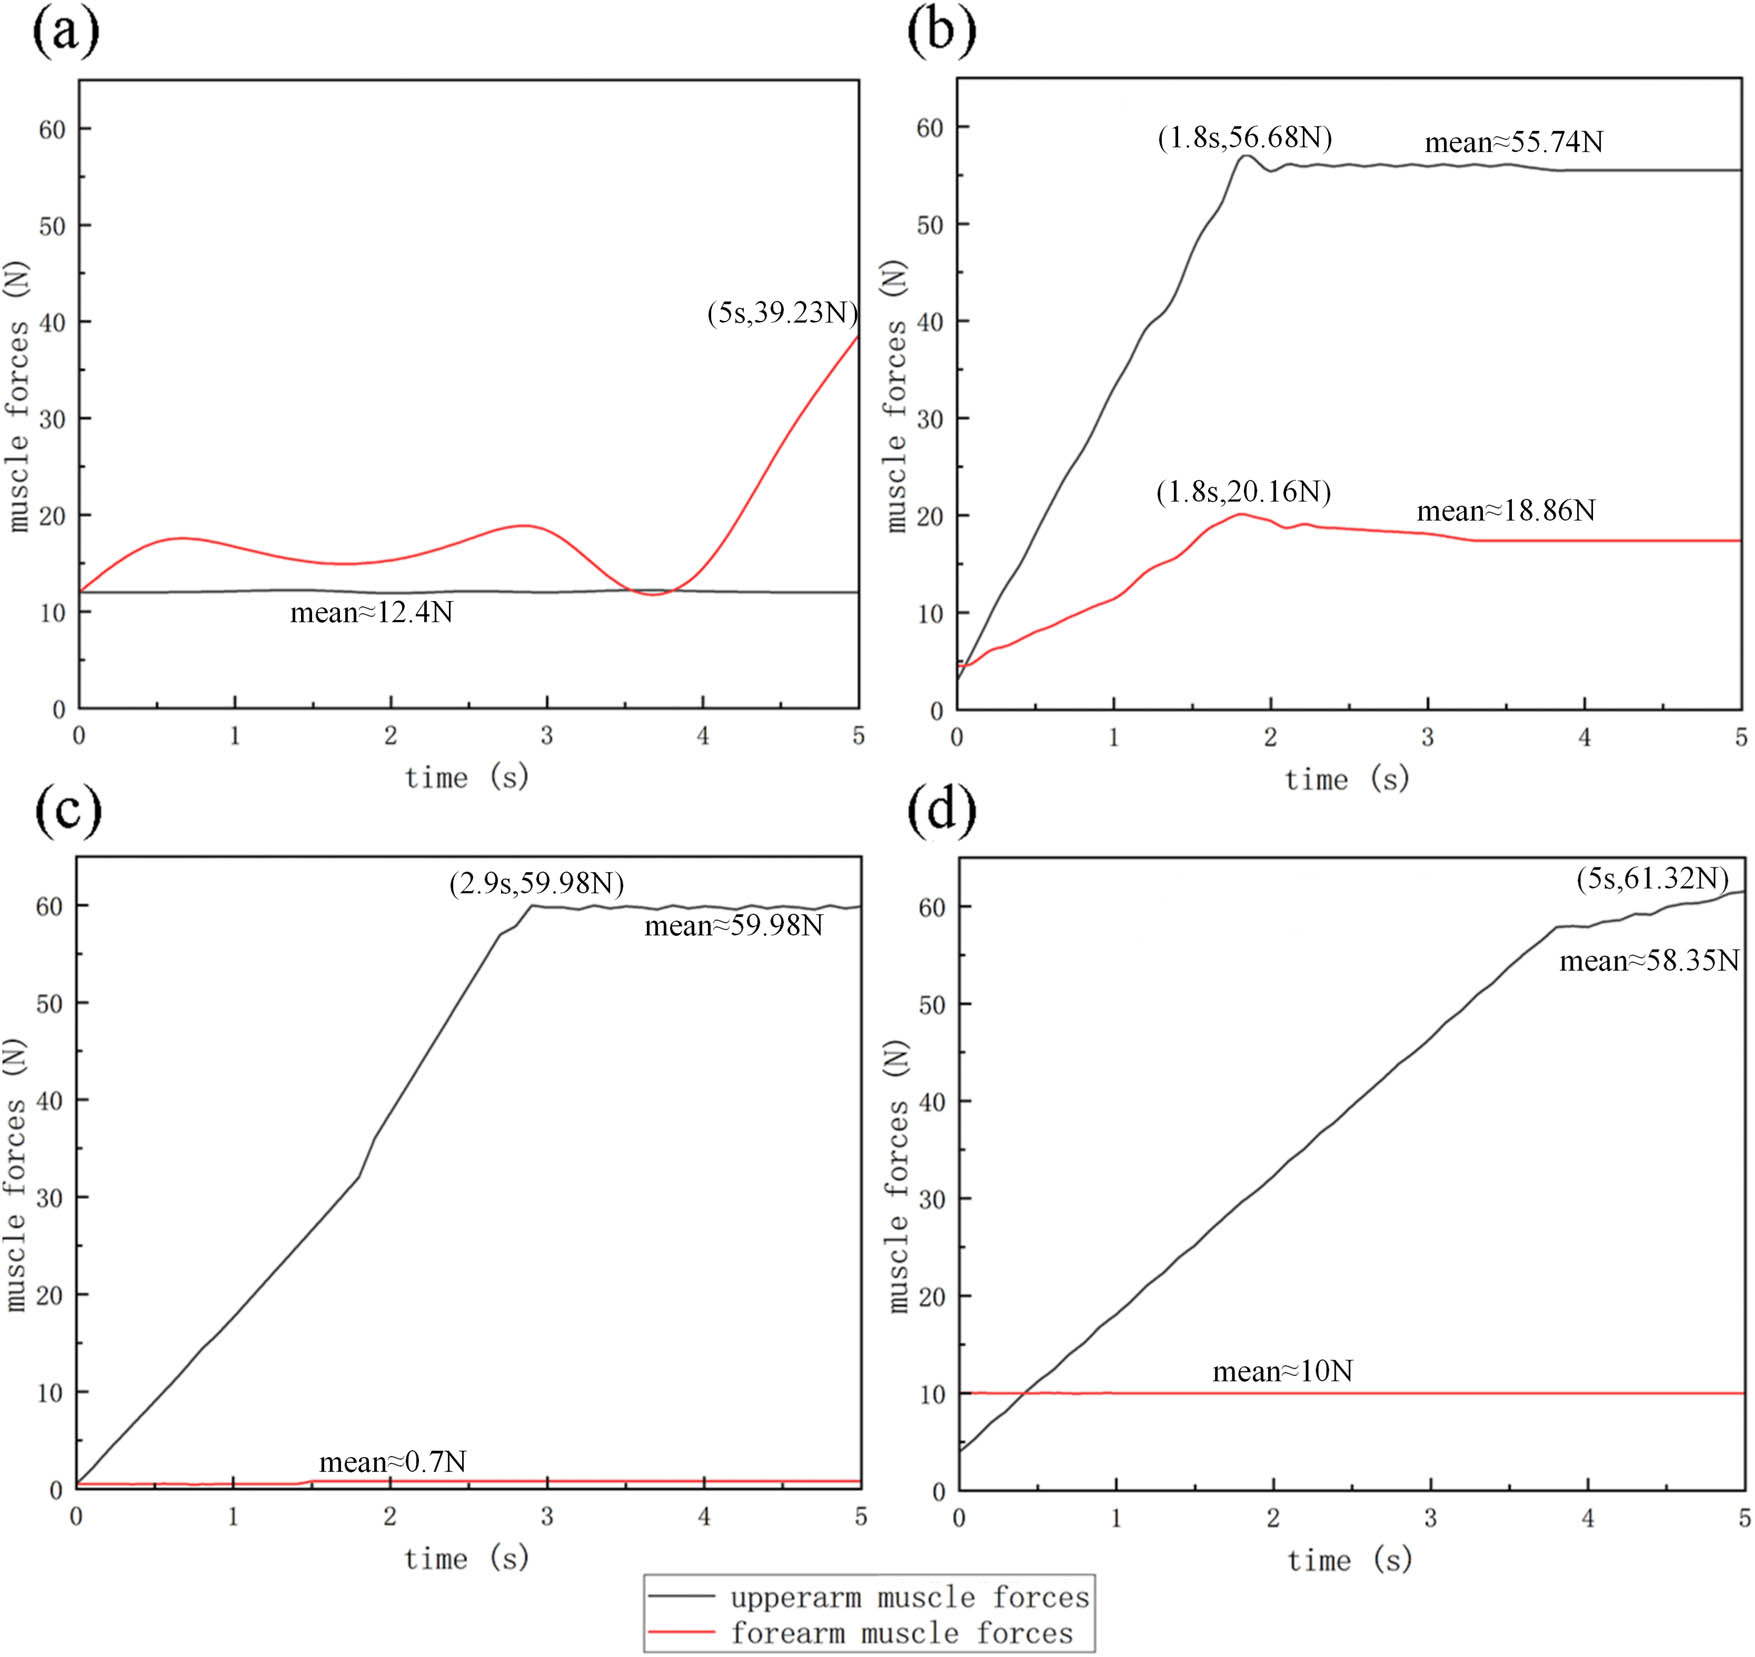
Figure 4
Changes in upper limb muscle force: (a) elbow flexion, (b) horizontal adduction/abduction, (c) vertical abduction/adduction, and (d) flexion/extension.
Table 8
Muscle strength RMS data
| Time (s) | Elbow flexion | Horizontal adduction/abduction | Vertical abduction/adduction | Flexion/extension | ||||
|---|---|---|---|---|---|---|---|---|
| Upper (N) | Fount (N) | Upper (N) | Fount (N) | Upper (N) | Fount (N) | Upper (N) | Fount (N) | |
| 0 | 12.40 | 12.40 | 4.26 | 4.13 | 6.00 | 0.49 | 7.00 | 10.00 |
| 0.25 | 12.45 | 13.50 | 11.18 | 6.27 | 6.00 | 0.65 | 7.00 | 10.05 |
| 0.5 | 12.35 | 16.80 | 18.10 | 8.41 | 8.50 | 0.75 | 9.50 | 9.95 |
| 0.75 | 12.48 | 16.70 | 25.02 | 10.55 | 12.50 | 0.68 | 13.20 | 10.08 |
| 1 | 12.32 | 15.70 | 31.94 | 12.69 | 17.50 | 0.72 | 18.50 | 9.92 |
| 1.25 | 12.43 | 15.11 | 38.86 | 14.83 | 18.50 | 0.63 | 19.20 | 10.03 |
| 1.5 | 12.37 | 14.50 | 45.78 | 16.97 | 27.40 | 0.75 | 28.50 | 9.97 |
| 1.75 | 12.41 | 13.40 | 55.20 | 19.80 | 28.50 | 0.69 | 29.80 | 10.01 |
| 2 | 12.39 | 14.41 | 55.74 | 18.80 | 37.50 | 0.71 | 39.80 | 9.99 |
| 2.25 | 12.46 | 16.19 | 55.76 | 18.61 | 39.20 | 0.66 | 41.50 | 10.06 |
| 2.5 | 12.34 | 18.53 | 55.73 | 18.34 | 47.80 | 0.74 | 50.80 | 9.94 |
| 2.75 | 12.44 | 20.21 | 55.74 | 18.20 | 53.10 | 0.67 | 52.60 | 10.02 |
| 3 | 12.36 | 18.50 | 55.75 | 18.20 | 59.40 | 0.73 | 54.40 | 9.98 |
| 3.25 | 12.42 | 16.80 | 55.77 | 18.17 | 59.30 | 0.64 | 56.20 | 10.04 |
| 3.5 | 12.38 | 15.10 | 55.74 | 18.15 | 59.50 | 0.76 | 58.00 | 9.96 |
| 3.75 | 12.40 | 12.60 | 55.73 | 18.14 | 59.60 | 0.70 | 58.40 | 10.07 |
| 4 | 12.41 | 15.80 | 55.52 | 18.11 | 59.70 | 0.70 | 59.60 | 9.93 |
| 4.25 | 12.39 | 19.82 | 55.71 | 18.09 | 59.80 | 0.68 | 59.70 | 10.00 |
| 4.5 | 12.40 | 27.35 | 55.78 | 18.04 | 59.80 | 0.72 | 60.20 | 10.00 |
| 4.75 | 12.40 | 34.18 | 55.76 | 18.01 | 59.70 | 0.69 | 61.50 | 10.00 |
| 5 | 12.40 | 39.23 | 55.72 | 18.01 | 59.70 | 0.71 | 62.40 | 10.00 |
| RMS | 12.401 | 19.200 | 45.997 | 15.848 | 42.840 | 0.691 | 42.727 | 10.010 |
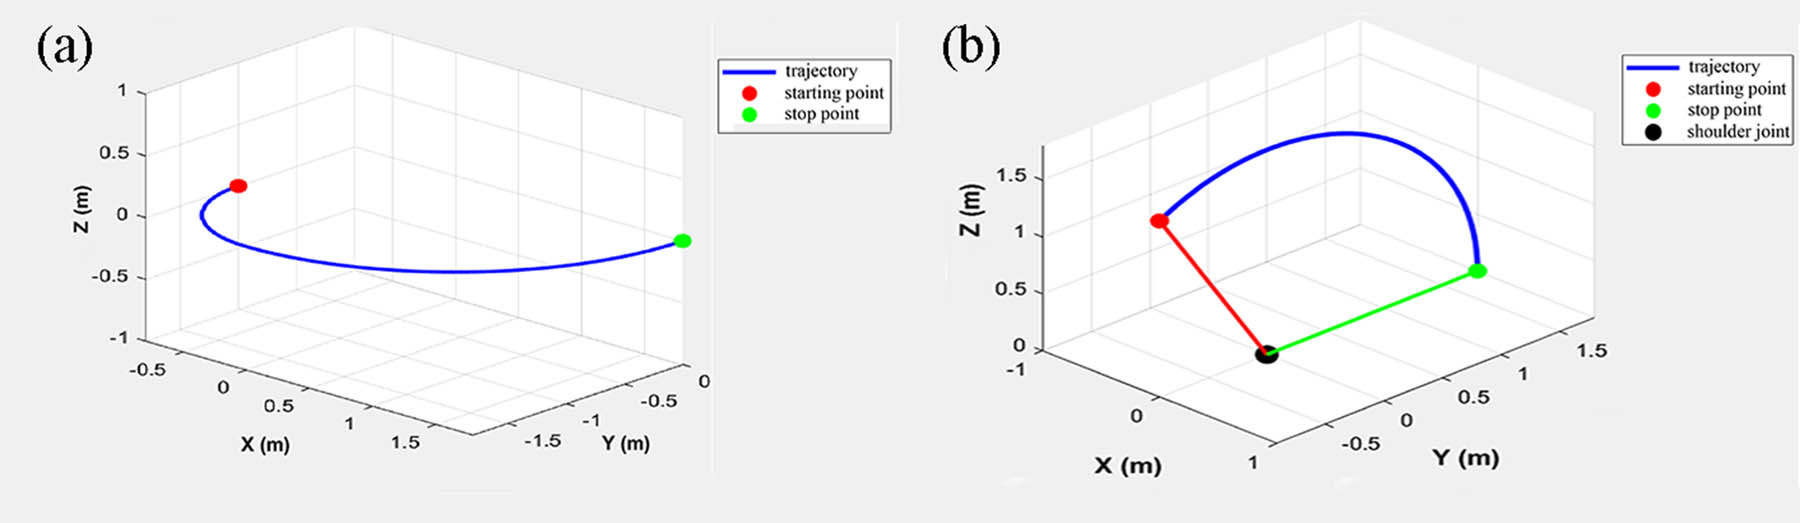
Figure 5
Upper limb model motion trajectory: (a) Horizontal Adduction/abduction trajectory and (b) flexion/extension trajectory.
Table 9
Number of mechanism components
| Mechanism type | Movable links in mechanism (n) | Lower pairs (PL) | Higher pairs (PH) | DOF (F) |
|---|---|---|---|---|
| Exoskeleton | 2 | 2 | 0 | 2 |
| End–effector | 3 | 2 | 2 | 2 |
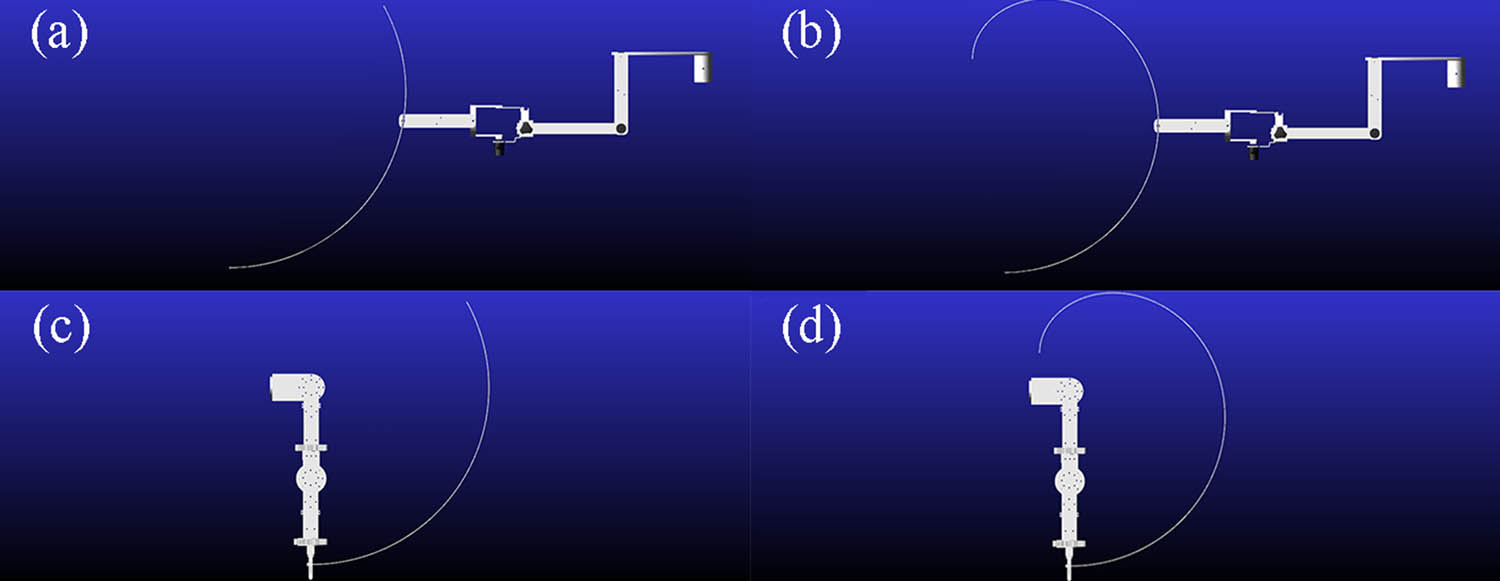
Figure 6
End of mechanism trajectories: (a) end–effector during flexion/extension, (b) end–effector trajectory during adduction/abduction, (c) exoskeleton–type during flexion/extension, and (d) exoskeleton during horizontal adduction/abduction.
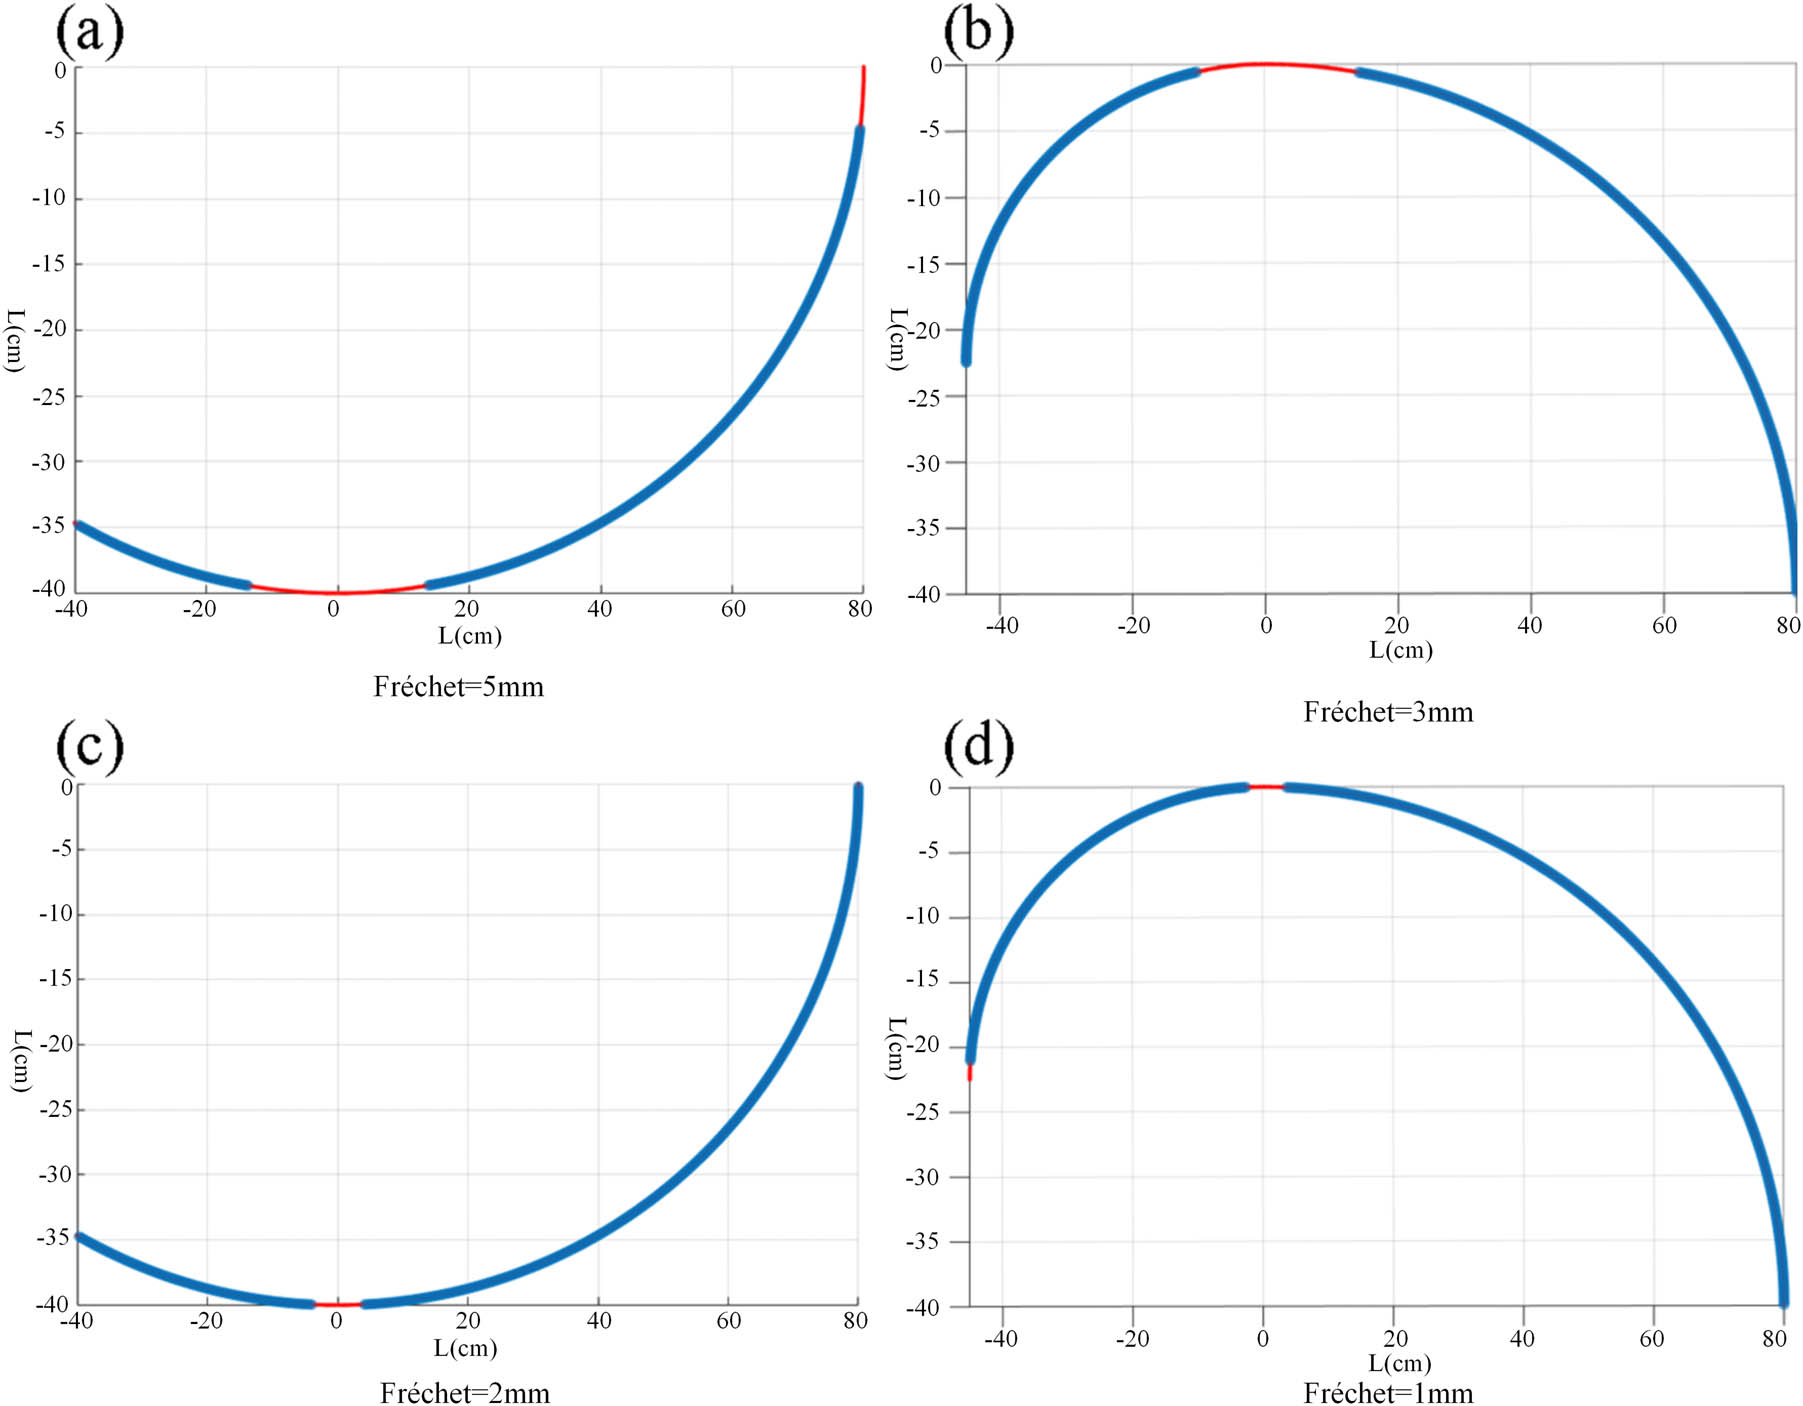
Figure 7
Trajectory fitting: (a) end–effector during flexion/extension, (b) end–effector during horizontal adduction/abduction, (c) exoskeleton during flexion/extension, and (d) exoskeleton during horizontal adduction/abduction.
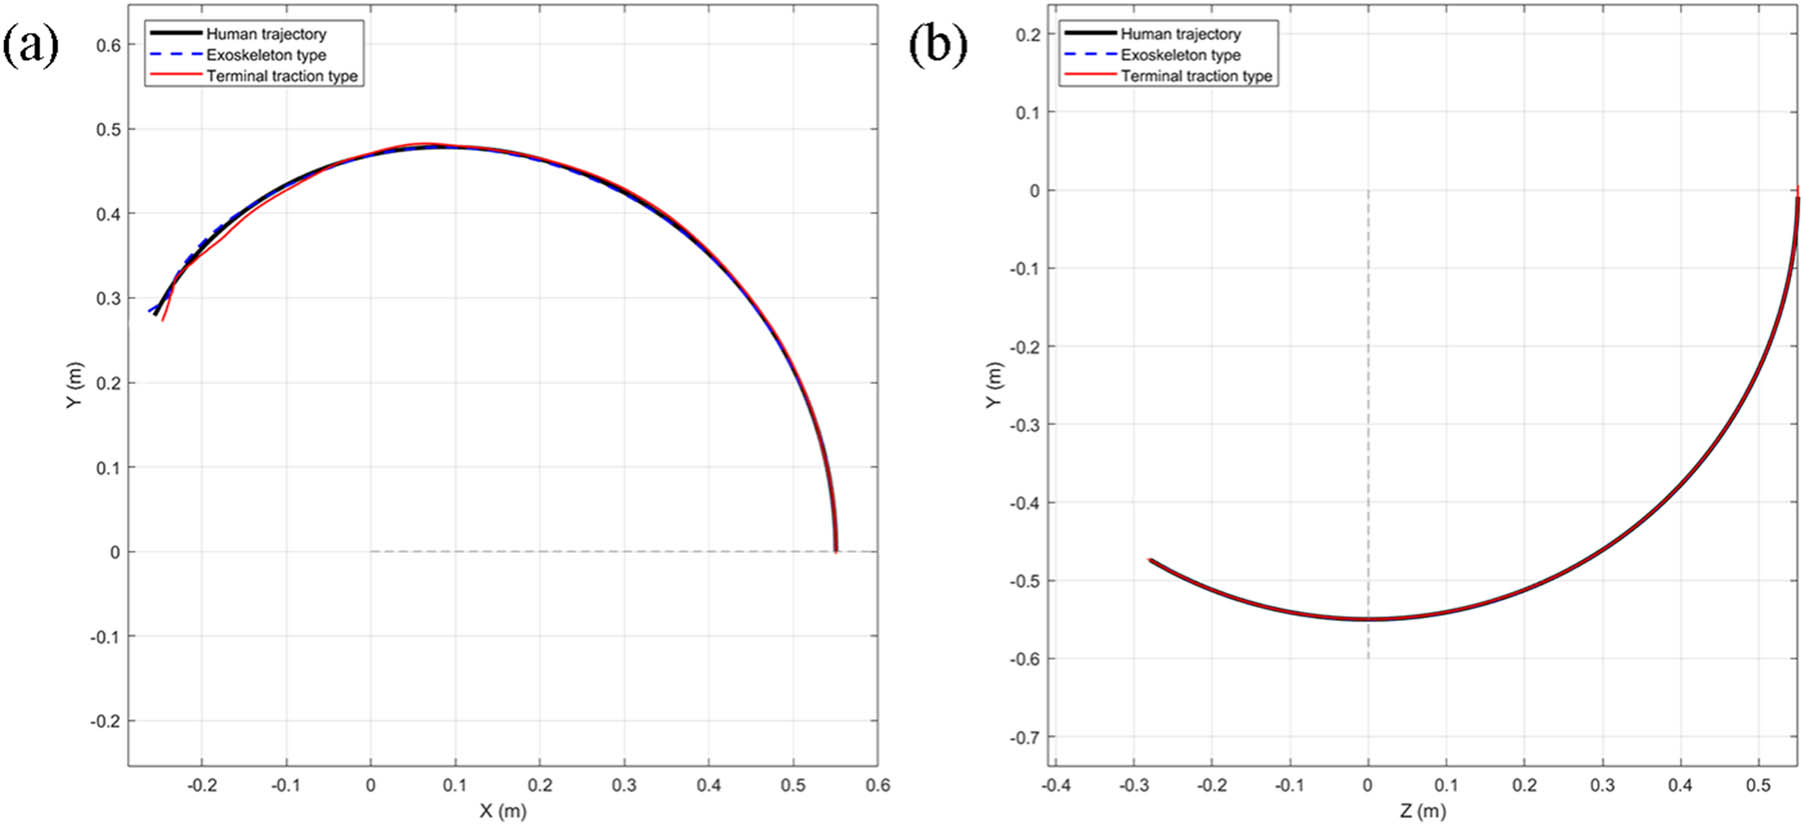
Figure 8
Comparison of R 2 data trajectories at the end of mechanisms: (a) horizontal adduction/abduction comparison and (b) flexion/extension comparison.
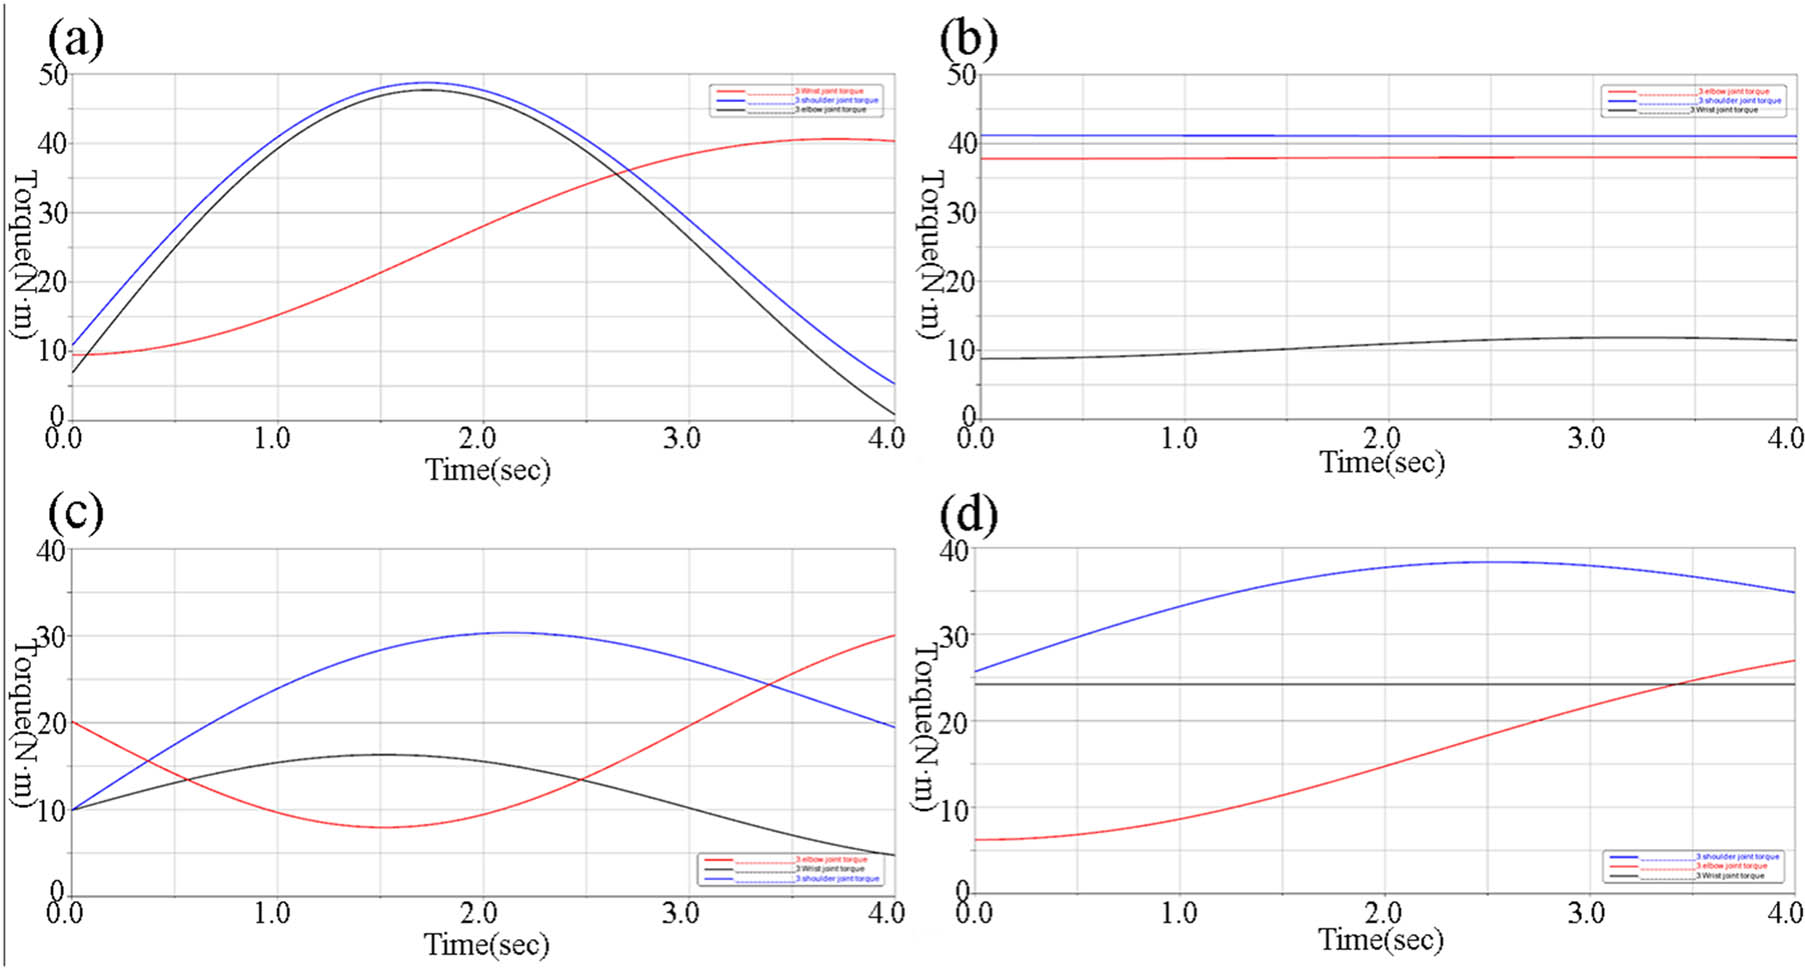
Figure 9
Variation in joint torque: (a) flexion/extension with end–effector mechanism, (b) horizontal adduction/abduction with end–effector mechanism, (c) flexion/extension with exoskeleton mechanisms, and (d) horizontal adduction/abduction with exoskeleton mechanisms.