
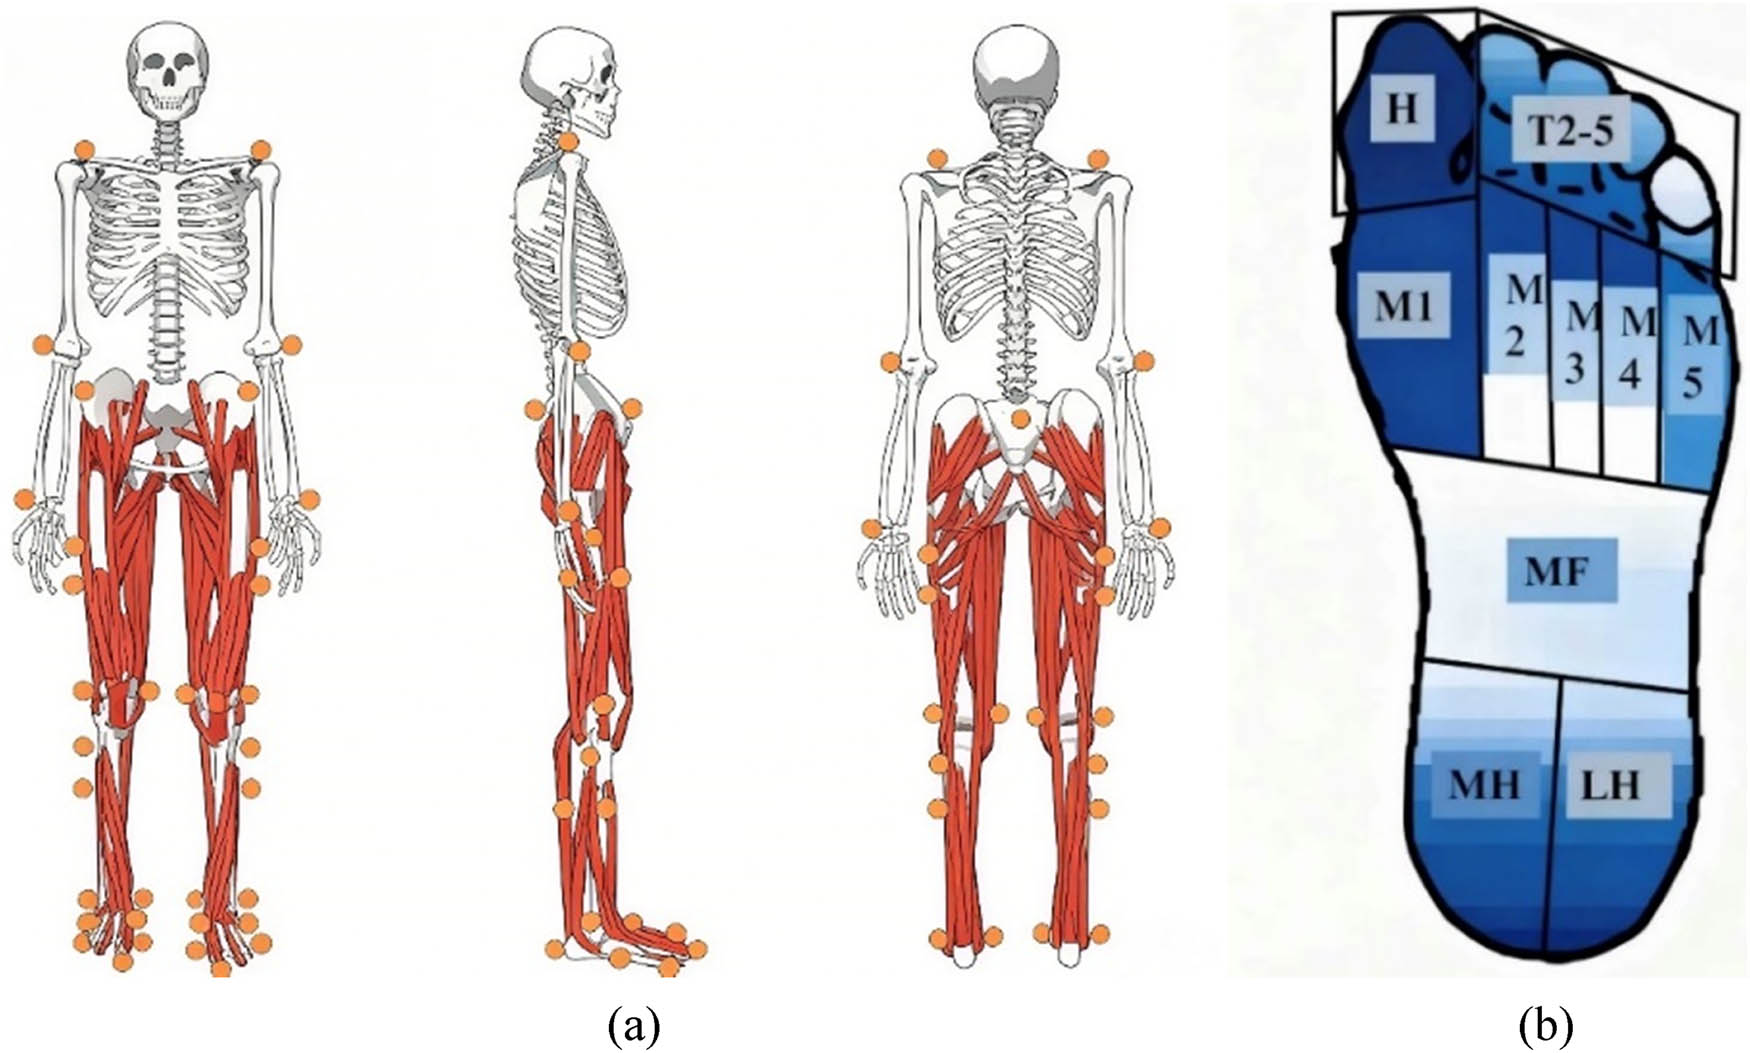
Figure 1
Illustration of marker-set model (a) and regions of the plantar surface (b).
Table 1
Comparison of lower limb ROM pre-10k and post-10k run in both limbs (Unit: °)
| Joint ROM | Left limb | Right limb | |||||
|---|---|---|---|---|---|---|---|
| Pre-10k | Post-10k | Significance | Pre-10k | Post-10k | Significance | ||
| Hip | Flexion (+)/extension (−) | 48.27 (4.86) | 48.66 (4.38) | 0.726 | 49.55 (7.30) | 59.74 (4.70) | 0.375 |
| Adduction (+)/abduction (−) | 17.26 (3.55) | 22.15 (4.24) | <0.001** | 17.45 (4.32) | 20.14 (6.25) | 0.044* | |
| Internal rotation (+)/external Rotation (−) | 11.53 (3.95) | 8.51 (2.66) | <0.001** | 10.17 (3.29) | 9.45 (4.19) | 0.307 | |
| Knee | Flexion (+)/extension (−) | 33.38 (3.40) | 32.92 (4.13) | 0.529 | 32.11 (4.38) | 32.10 (2.90) | 0.988 |
| Adduction (+)/abduction (−) | 5.39 (2.58) | 5.41 (3.48) | 0.024* | 5.08 (3.02) | 5.96 (2.11) | 0.038* | |
| Internal rotation (+)/external rotation (−) | 21.20 (7.72) | 28.51 (9.12) | <0.001** | 24.68 (8.21) | 23.32 (5.76) | 0.366 | |
| Ankle | Dorsiflexion (+)/plantarflexion (−) | 18.67 (2.72) | 17.83 (2.75) | 0.153 | 17.99 (2.31) | 17.42 (2.42) | 0.286 |
Note: “*” indicates p < 0.05 and “**” indicates p < 0.01.
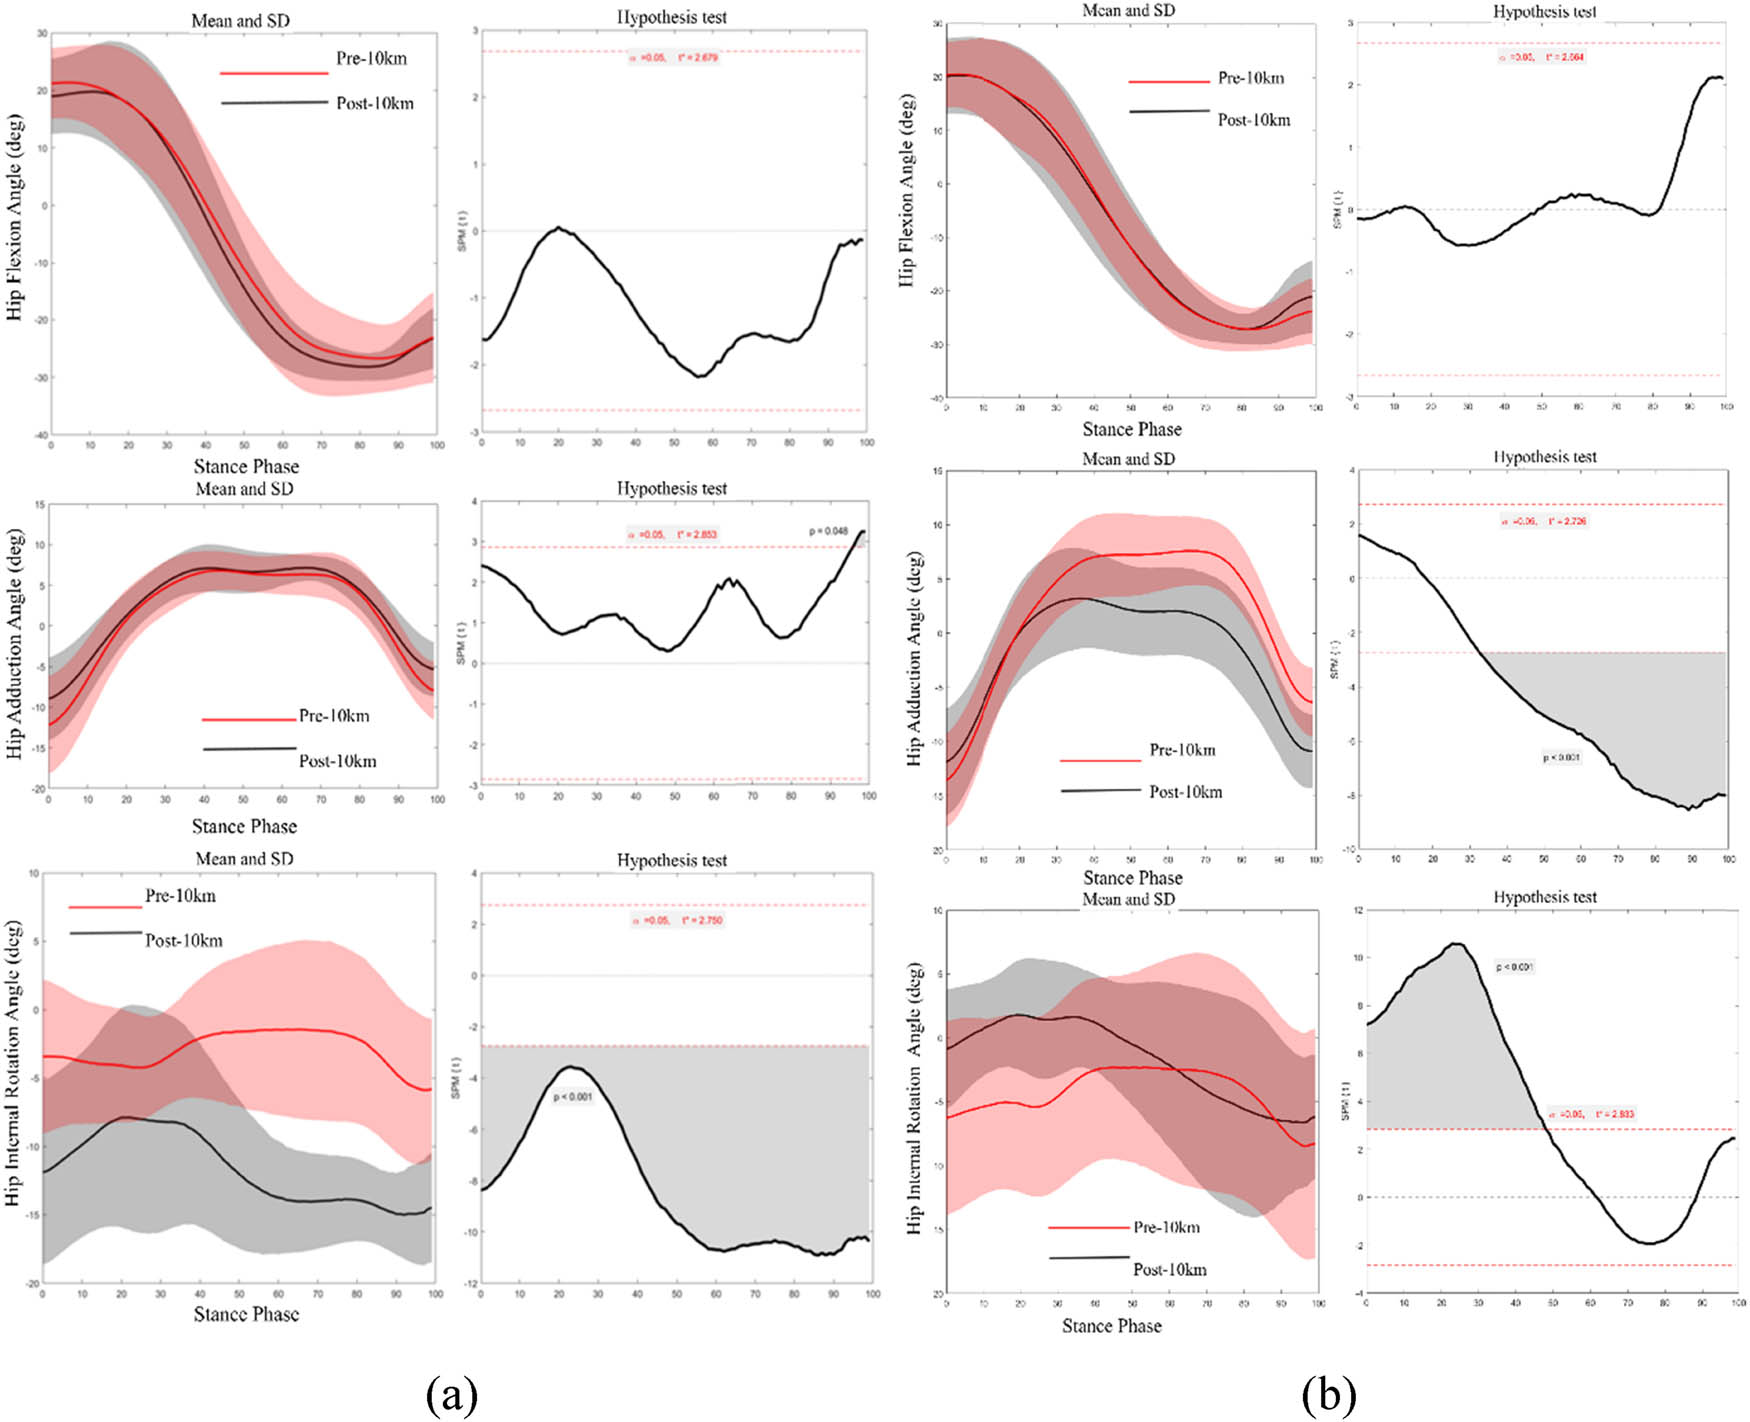
Figure 2
SPM1d statistics of the right (a) and left (b) hip angles pre-10k and post-10k run.
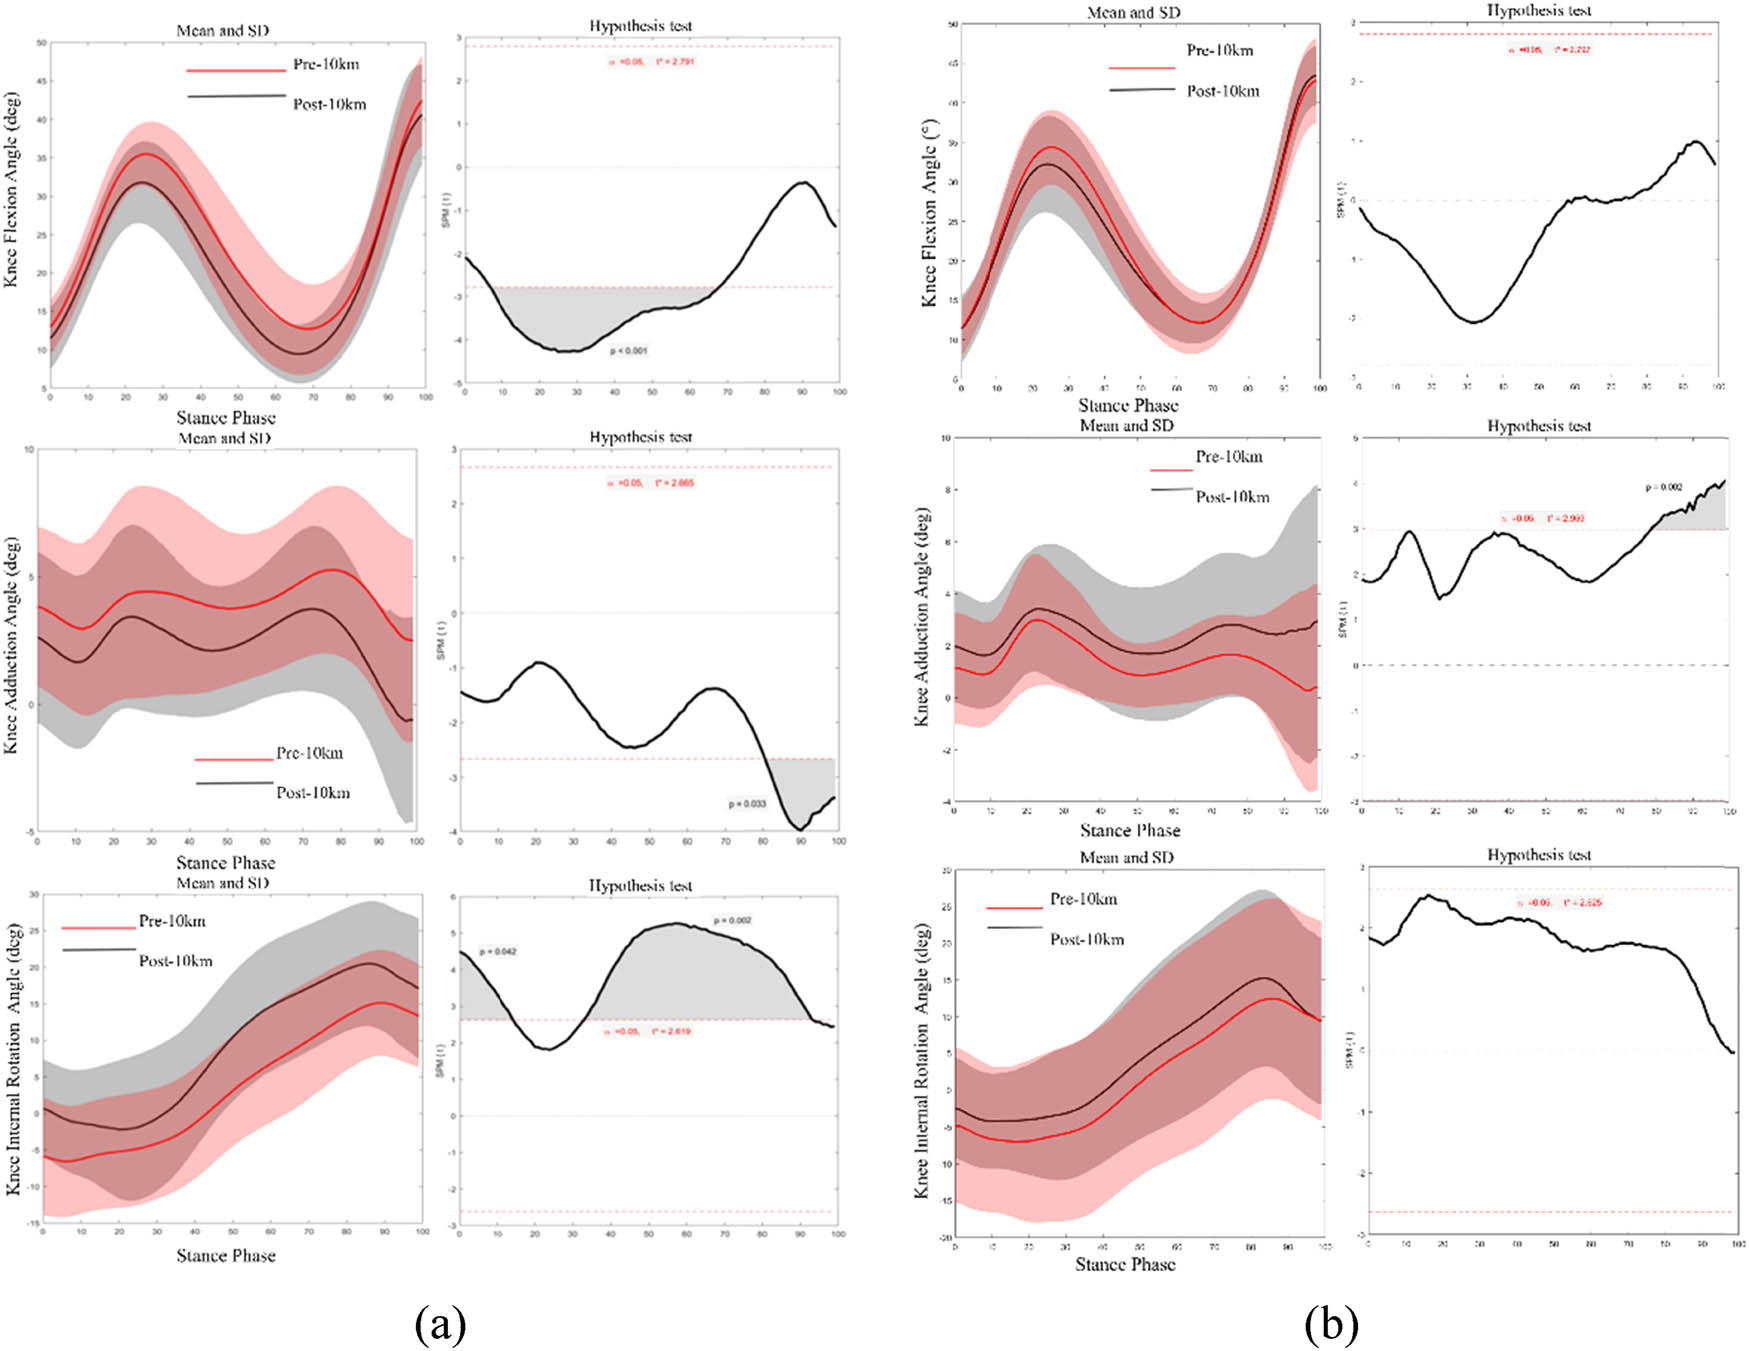
Figure 3
SPM1d statistics of the right (a) and left (b) knee angles pre-10k and post-10k run.
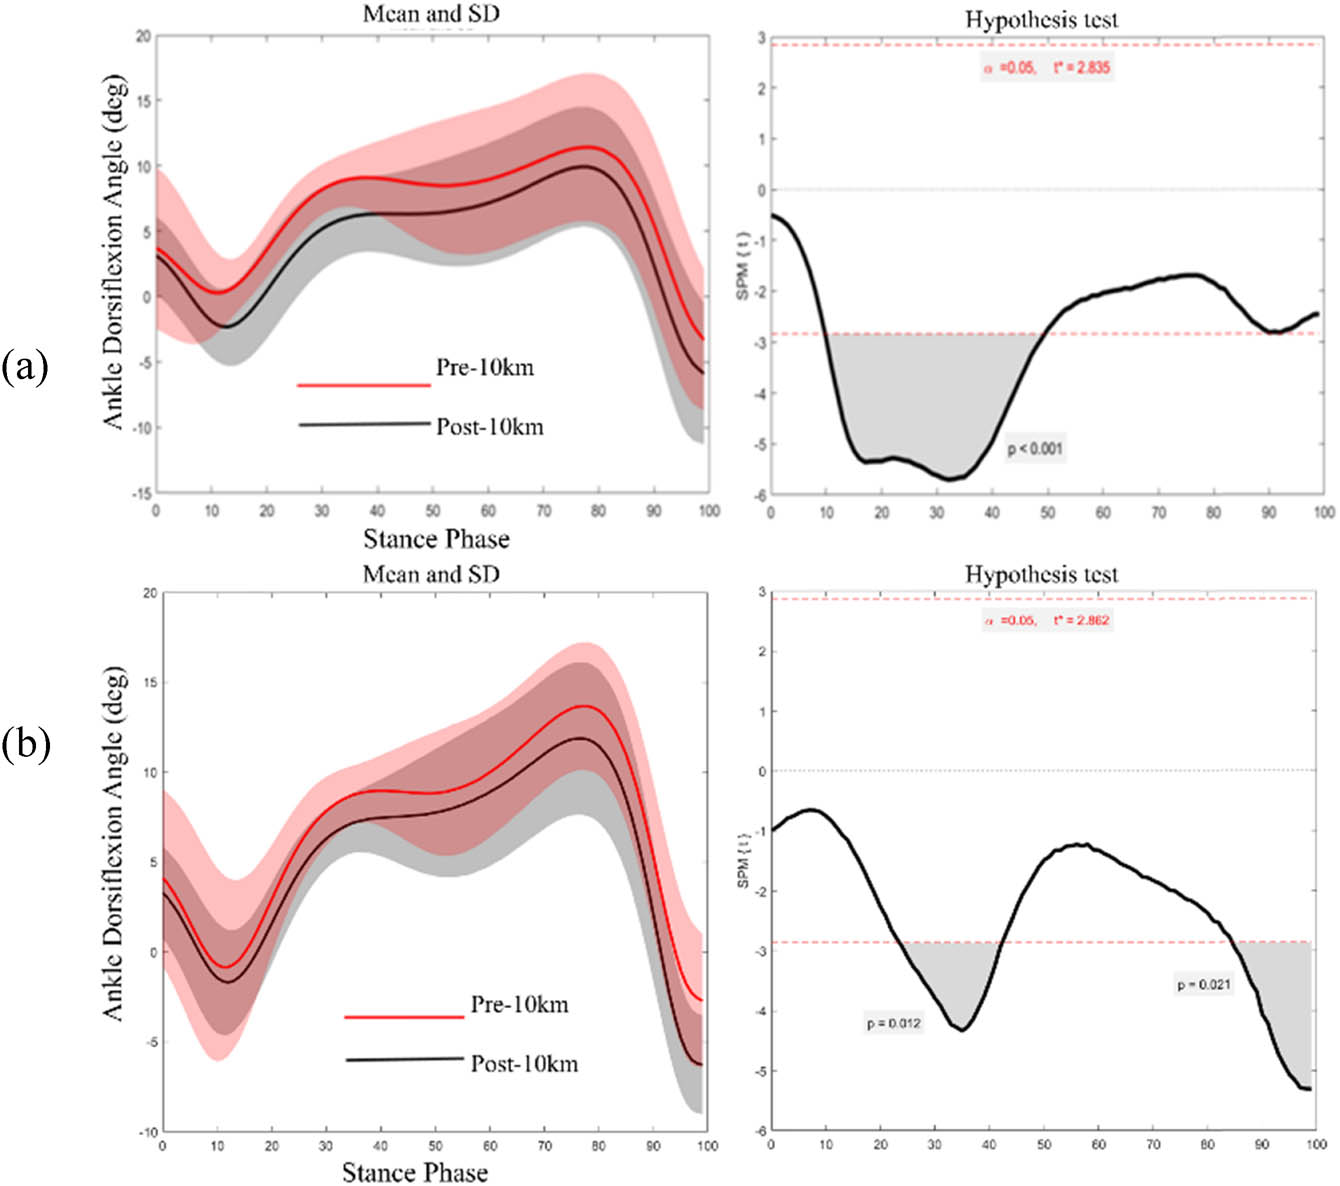
Figure 4
SPM1d statistics of the right (a) and left (b) ankle angles pre-10k and post-10k run.
Table 2
Comparison of hip Moments pre-10k and post-10k run in both limbs (Unit: Nm/kg)
| Joint moment | Pre-10k | Post-10k | Significance | |
|---|---|---|---|---|
| Right | Flexion (+)/ extension (−) | −0.60 (0.62) | −0.66 (0.01) | <0.001** |
| Adduction (+)/abduction (−) | −0.15 (0.20) | −0.21 (0.21) | <0.01** | |
| Internal rotation (+)/external rotation (−) | −0.01 (0.06) | 0.01 (0.07) | <0.001** | |
| Left | Flexion (+)/ extension (−) | −0.58 (0.67) | −0.61 (0.62) | <0.001** |
| Adduction (+)/abduction (−) | −0.49 (0.29) | −0.48 (0.33) | <0.001** | |
| Internal rotation (+)/external rotation (−) | 0.04 (0.11) | 0.03 (0.12) | <0.001** |
Note: “*” indicates p < 0.05 and “**” indicates p < 0.01.
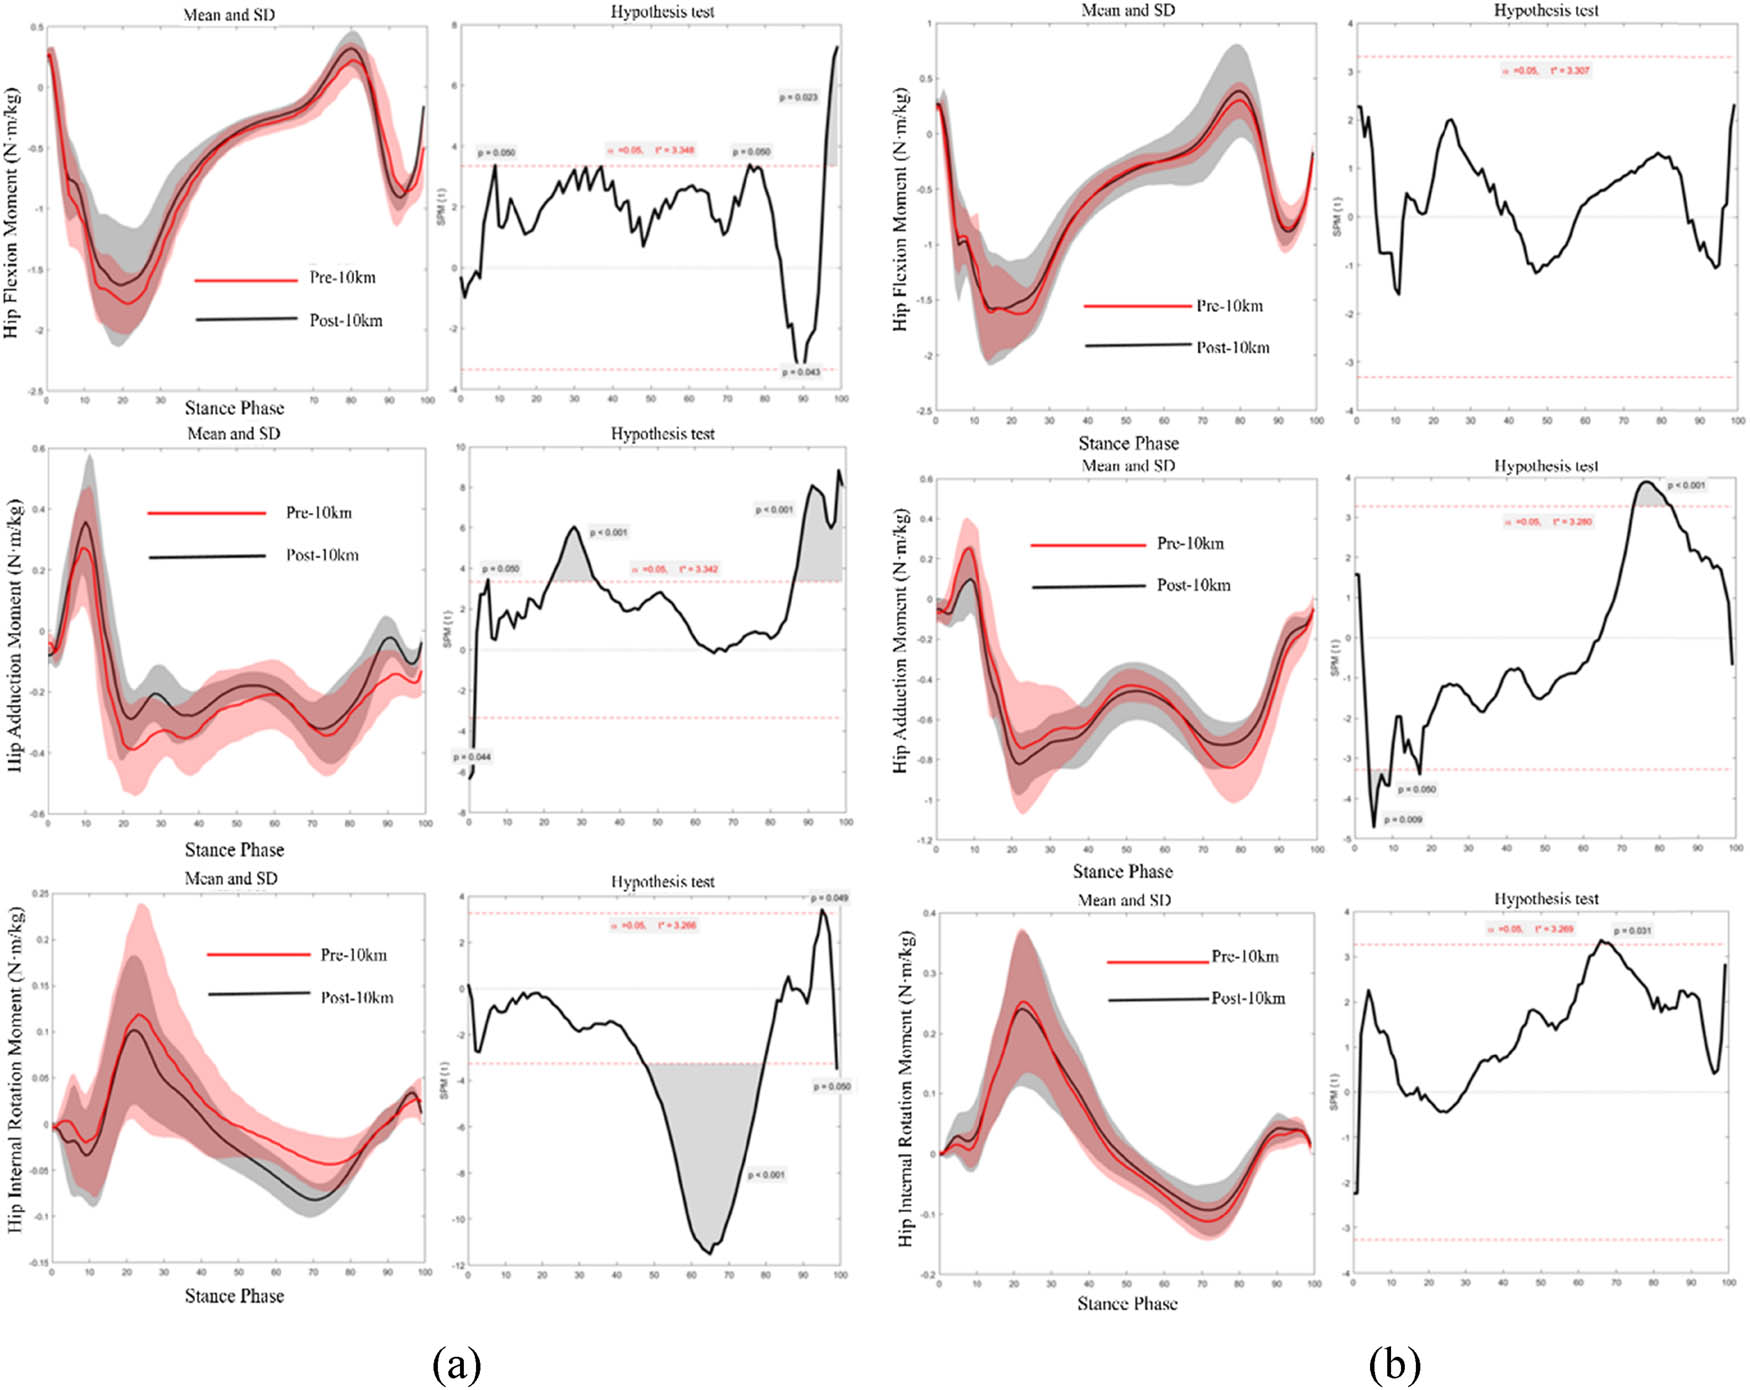
Figure 5
SPM1d statistics of the right (a) and left (b) hip moments pre-10k and post-10k run.
Table 3
Comparison of knee moments pre-10k and post-10k run in both limbs (Unit: Nm/kg)
| Joint moment | Pre-10k | Post-10k | Significance | |
|---|---|---|---|---|
| Right | Flexion (+)/ extension (−) | 0.24 (0.24) | 0.18 (0.25) | <0.001** |
| Adduction (+)/abduction (−) | −0.12 (0.17) | −0.13 (0.17) | <0.001** | |
| Internal rotation (+)/external rotation (−) | −0.03 (0.04) | −0.03 (0.05) | 0.816 | |
| Left | Flexion (+)/ extension (−) | 0.15 (0.34) | 0.16 (0.25) | 0.160 |
| Adduction (+)/abduction (−) | −0.32 (0.24) | −0.34 (0.22) | <0.001** | |
| Internal rotation (+)/external rotation (−) | −0.06 (0.07) | −0.06 (0.07) | 0.667 |
Note: “*” indicates p < 0.05 and “**” indicates p < 0.01.
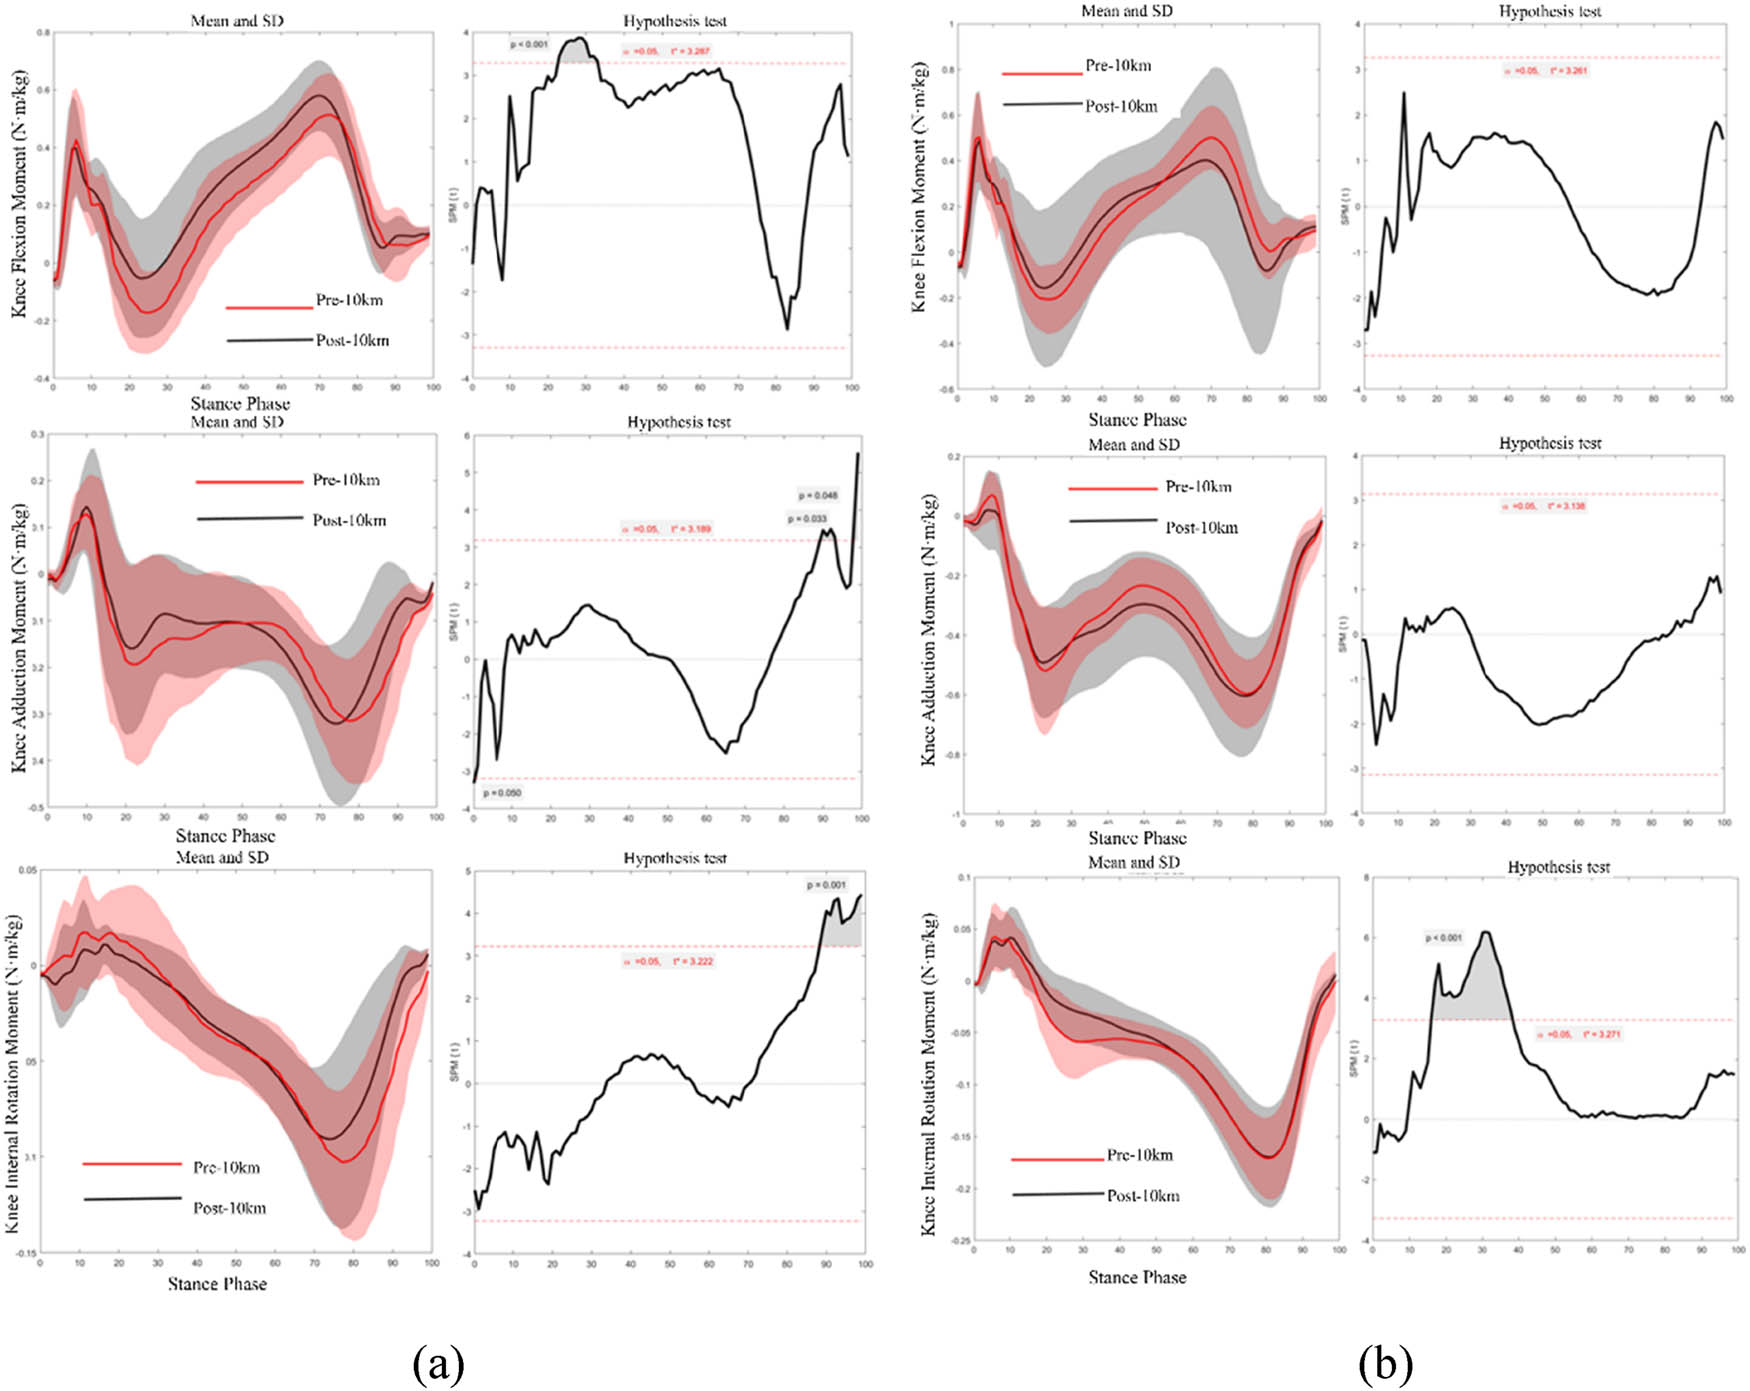
Figure 6
SPM1d statistics of the right (a) and left (b) knee moments pre-10k and post-10k run.
Table 4
Comparison of ankle moments pre-10k and post-10k run in both limbs (Unit: Nm/kg)
| Joint moment | Pre-10k | Post-10k | Significance | |
|---|---|---|---|---|
| Right | Dorsiflexion (+)/plantarflexion (−) | −0.90 (0.55) | −0.95 (0.52) | <0.001** |
| Left | Dorsiflexion (+)/plantarflexion (−) | −0.86 (0.56) | −0.87 (0.53) | 0.060 |
Note: “*” indicates p < 0.05 and “**” indicates p < 0.01.
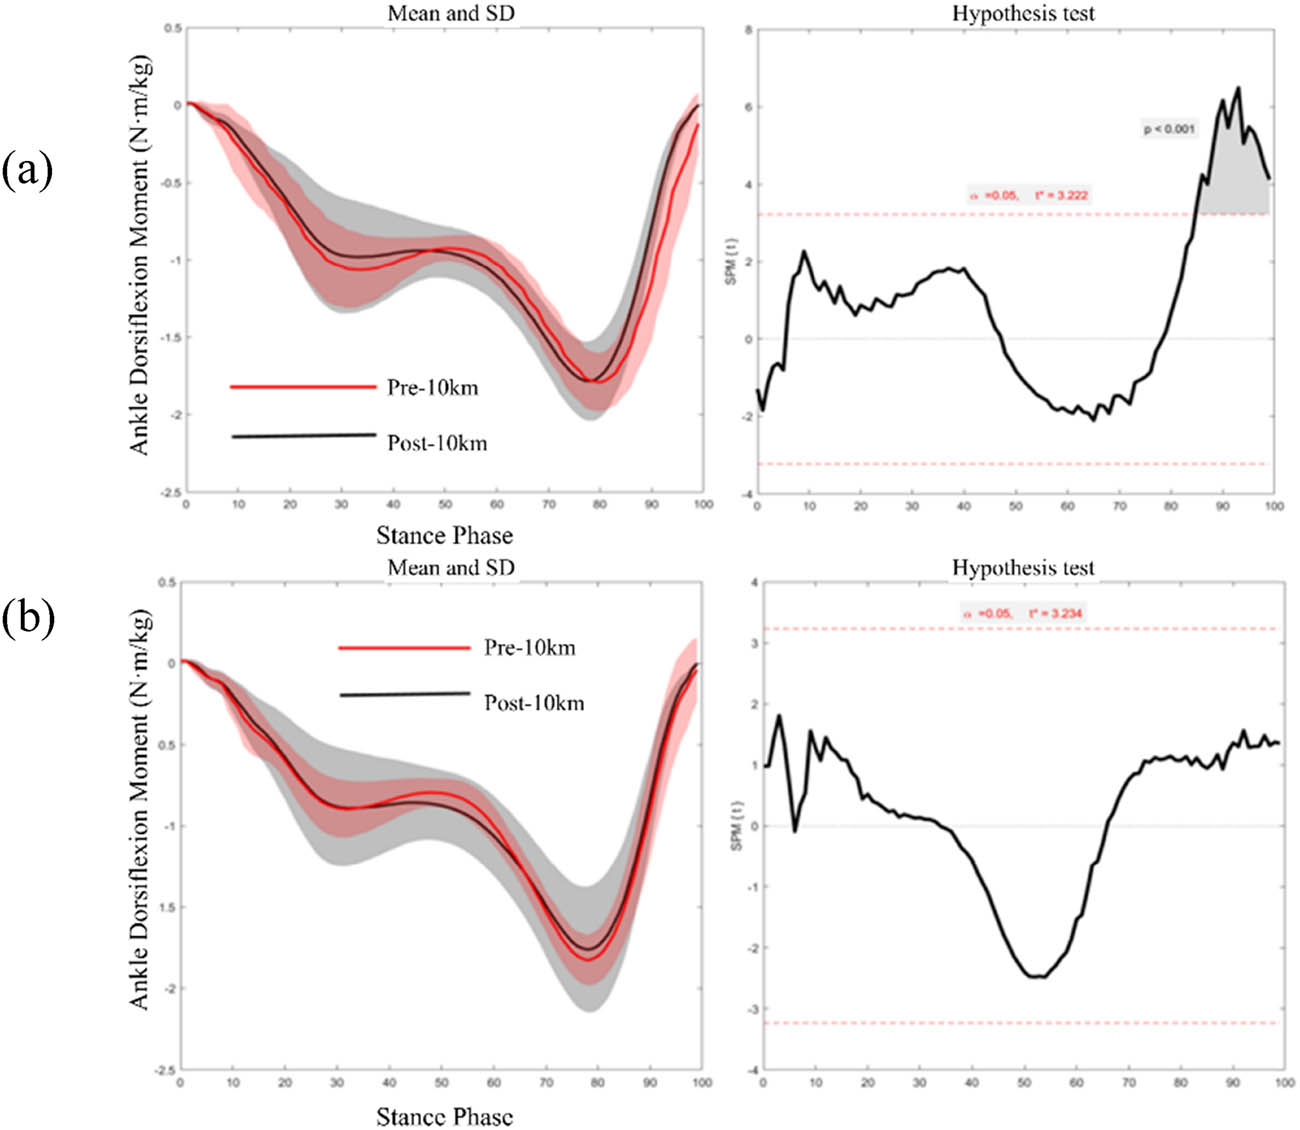
Figure 7
SPM1d statistics of the right (a) and left (b) ankle moment pre-10k and post-10k run.
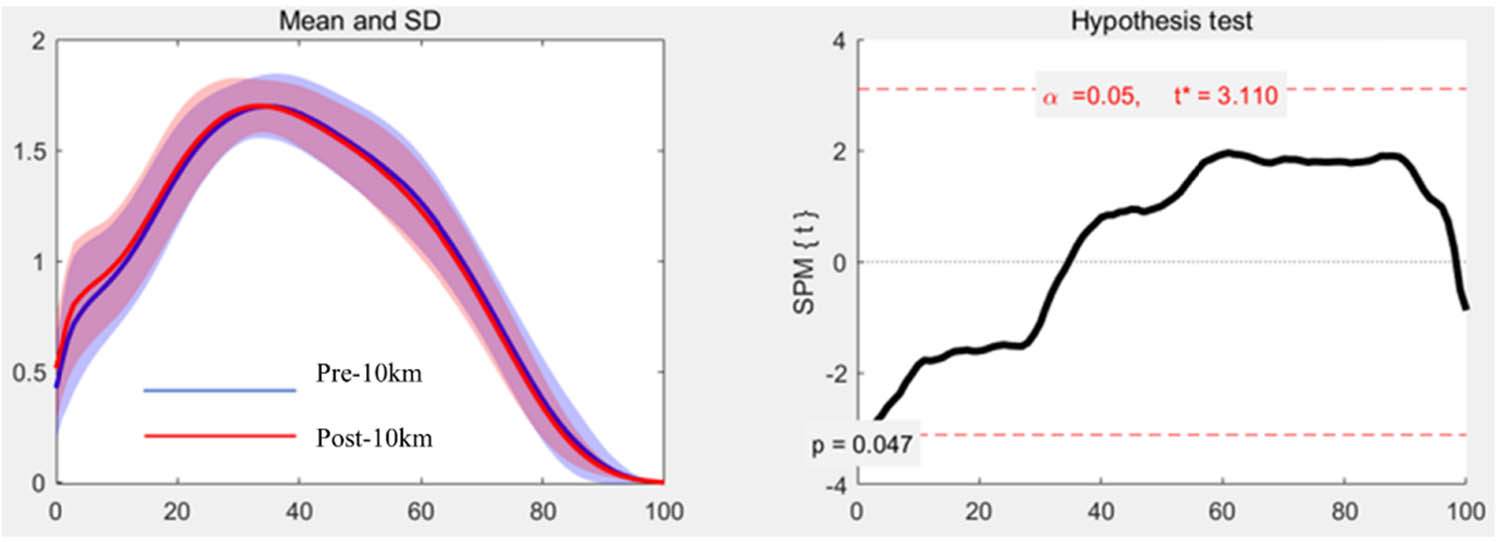
Figure 8
SPM1d statistics of the total plantar pressure pre-10k and post-10k run.
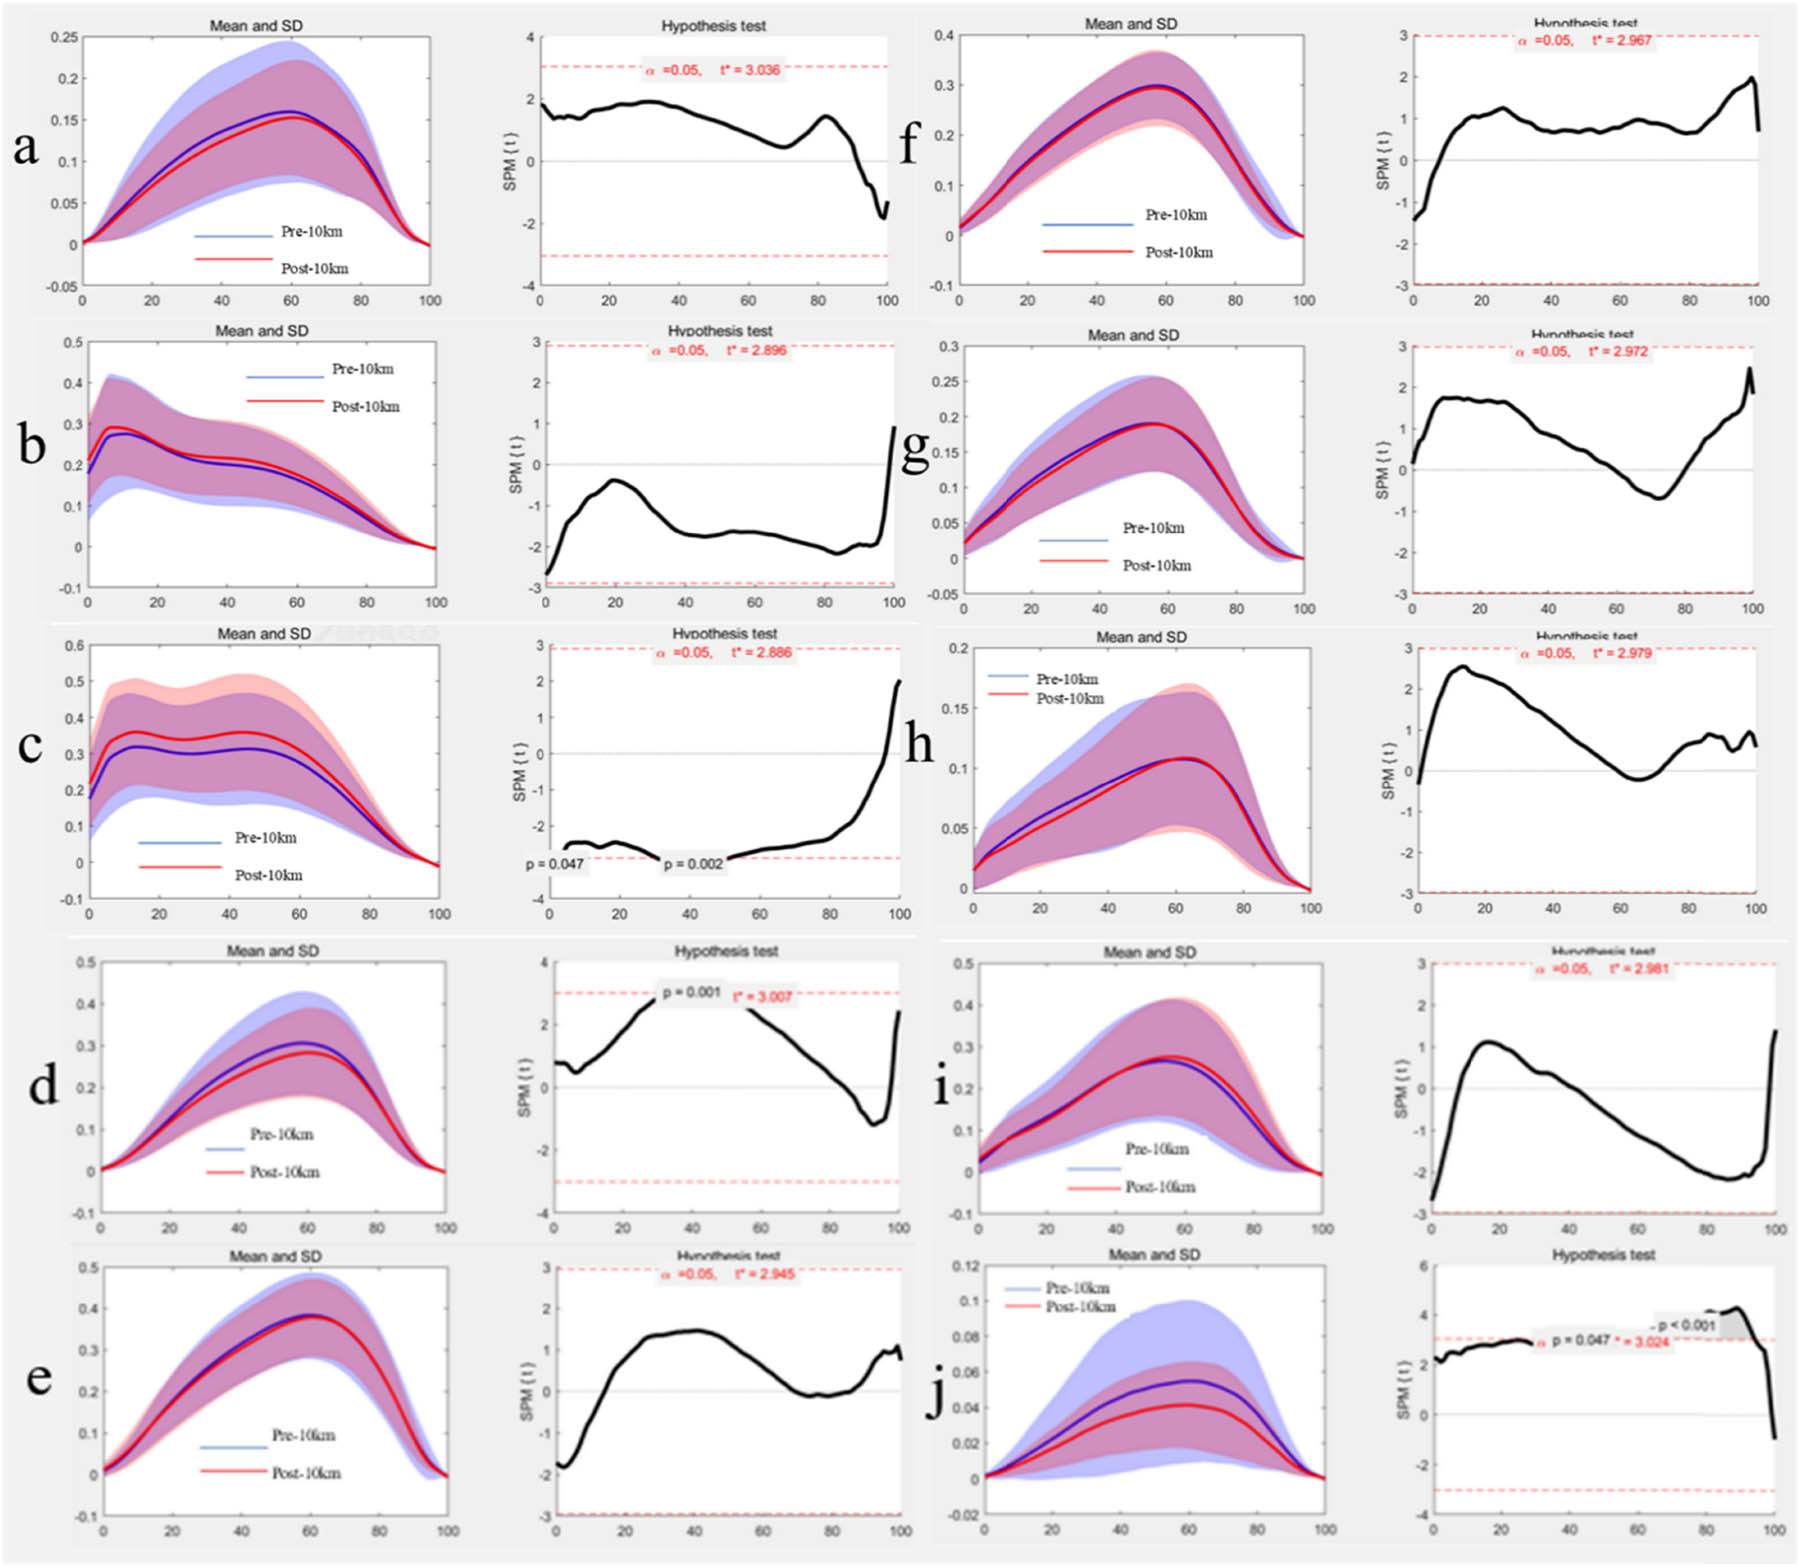
Figure 9
SPM1d statistics of plantar pressure in ten regions during the pre-10k and post-10k run. Note: (a) bunion region, (b) lateral heel region, (c) MH, (d) metatarsophalangeal joint I region, (e) metatarsophalangeal joint II region, (f) metatarsophalangeal joint III region, (g) metatarsophalangeal joint IV region, (h) metatarsophalangeal joint region, (i) MF region, and (j) OT region.