
1. Introduction
In recent decades, the popularity of long-distance running has surged globally, with both recreational and professional runner communities expanding simultaneously. This trend is particularly evident in the rapid growth of marathon events. As the flagship large-scale event in long-distance running, marathons have seen a continuous increase in frequency across major cities in recent years, becoming the core driver behind rising participation rates in long-distance running. Data released by the Chinese Athletics Association indicate that over 300 registered marathon events were held domestically in the first half of 2025, fully confirming the robust development. Based on distance, marathons are categorized into full, half, and quarter marathons. Among these, the half marathon, with its approximately 21 km course, strikes a balance between challenge and feasibility, which not only becomes the most widely participated event type but also the preferred distance for elite athletes during training [1,2]. While, the 10k race, serving as a fundamental unit for long-distance training, is frequently used for marathon pace testing and interval training, acting as a crucial bridge between daily foundational workouts and formal competitive events [3,4].
Long-distance running exerts positive effects on human physiological functions across multiple dimensions [5]. From physiological perspectives, a regular participation in long-distance running would systematically optimize the functions of the muscular, respiratory, cardiovascular, and nervous systems [6,7]. However, long-distance running also brings about significant injury risks that cannot be ignored [8]. The repetitive nature of the activity results in cumulative impact, subjecting lower-body joints to ground reaction forces of over twice the body weight, which not only increases the risk of immediate injuries but may also trigger delayed injuries, such as tibial stress reactions during recovery periods [9]. A study indicates that prolonged running induces plantar muscle fatigue, which restricts lower limb muscle function and reduces running power by 30–40% [10]. Biomechanical abnormalities triggered by exercise fatigue are a significant contributing factor to long-distance running injuries [11]. Previous data indicate that lower limb injury rates after long-distance running reach as high as 79.3%, closely linked to the high loads borne by the knee joint during running; impact forces on the knee during the gait cycle could reach 3–5 times the body weight [12]. Common injury types include tibial stress syndrome, patellofemoral syndrome, and iliotibial band friction syndrome [13]. Potential factors may stem from incorrect running form disrupting the mechanical balance of lower-body muscles, thus leading to inflammation of muscles and tendons as well as skeletal damage [14]. Further, the reduced muscle load-bearing capacity and technical movement deterioration during fatigue further exacerbate the risk of bone, joint, and soft tissue injuries [15]. Thus, biomechanical indicators, such as lower limb joint angles and plantar pressure, may undergo changes during exercise fatigue, contributing the understanding of injuries from distance running.
Current biomechanical studies on running fatigue primarily focuses on changes in running gait, jumping movements, and risk of lower limb injuries following the long-distance running [16,17]. However, relatively little attention was paid to the walking gait following running fatigue, as walking served as the primary form of post-distance-running recovery activity and represented the core movement pattern for runners transitioning back to daily life [18]. Changes in gait biomechanics and plantar loading resulting from decreased physical capacity following a 10k run may be related with the risk of lower-limb disorders. However, the absence of study on this critical aspect limits the ability from existing findings to comprehensively support the practical injury prevention following long-distance running.
Therefore, the aim of this study is to investigate the effects of a 10k run on lower limb biomechanics and plantar pressure in male recreational runners, with a specific focus on bilateral asymmetry and joint stability. By quantifying the biomechanical changes induced by running fatigue, this study addresses a critical gap in the current literature and provides evidence-based scientific guidance for the design of post-distance running recovery activities, the adjustment of walking gait, and the development of targeted injury prevention strategies. It was hypothesized that following a 10k run, the gait biomechanics would show significant changes, primarily as marked biomechanical differences between the dominant and non-dominant lower limbs at the hip, knee, and ankle joints. Increased adduction-abduction range of motion (ROM) in the hip and knee joints, along with increased joint loadings, particularly the abduction moment. Simultaneously, changes in plantar pressure distribution would be observed with significantly elevated pressure loads in certain areas following a 10k run.
2. Methods and materials
2.1. Participants
In the G*Power3.1 software, the statistical power was set to 0.80 for the calculation of the sample size, resulting in a minimum sample size of 13 for this study [19,20]. To improve the experiment accuracy and reduce the individual variability, 20 healthy male recreational runners (age: 24.27 ± 1.36 years; height: 177.00 ± 4.33 cm; weight: 69.80 ± 8.46 kg; and BMI 22.20 ± 1.7 kg/m2) were recruited from Ningbo University Athletic Association to participate in the experiment. All participants met the following inclusion criteria: (1) running with heel-strike technique; (2) running frequency of at least 2–3 times per week, with a duration of ≤45 min or a distance of ≤10 km; (3) no lower limb or generalized deformities; and (4) right leg as dominant limb. The protocol of this study was approved by the Ethics Committee of Ningbo University (No. RAGH202304127005.8).
2.2. Study protocol
Participants were instructed to perform biomechanical test in a motion capture lab, facilitated with an eight-camera Vicon infrared 3D motion capture system (Vicon Metrics Ltd, Oxford, UK), a Kistler 3D force platform (Kistler, Switzerland), and a Footscan plantar pressure plate (Footscan1.0, RSscan, Belgium).
Within 24 h prior to the experiment, the participants were required to avoid strenuous exercise to ensure good physical condition. This experiment utilized the OpenSim (Stanford University, Stanford, CA, USA)2392 model. Prior to testing, 38 reflective markers were attached onto the anatomical structures of the hip, knee, and ankle joints following a previous established marker-set model (Figure 1). During testing, participants wore uniform tights and shoes.
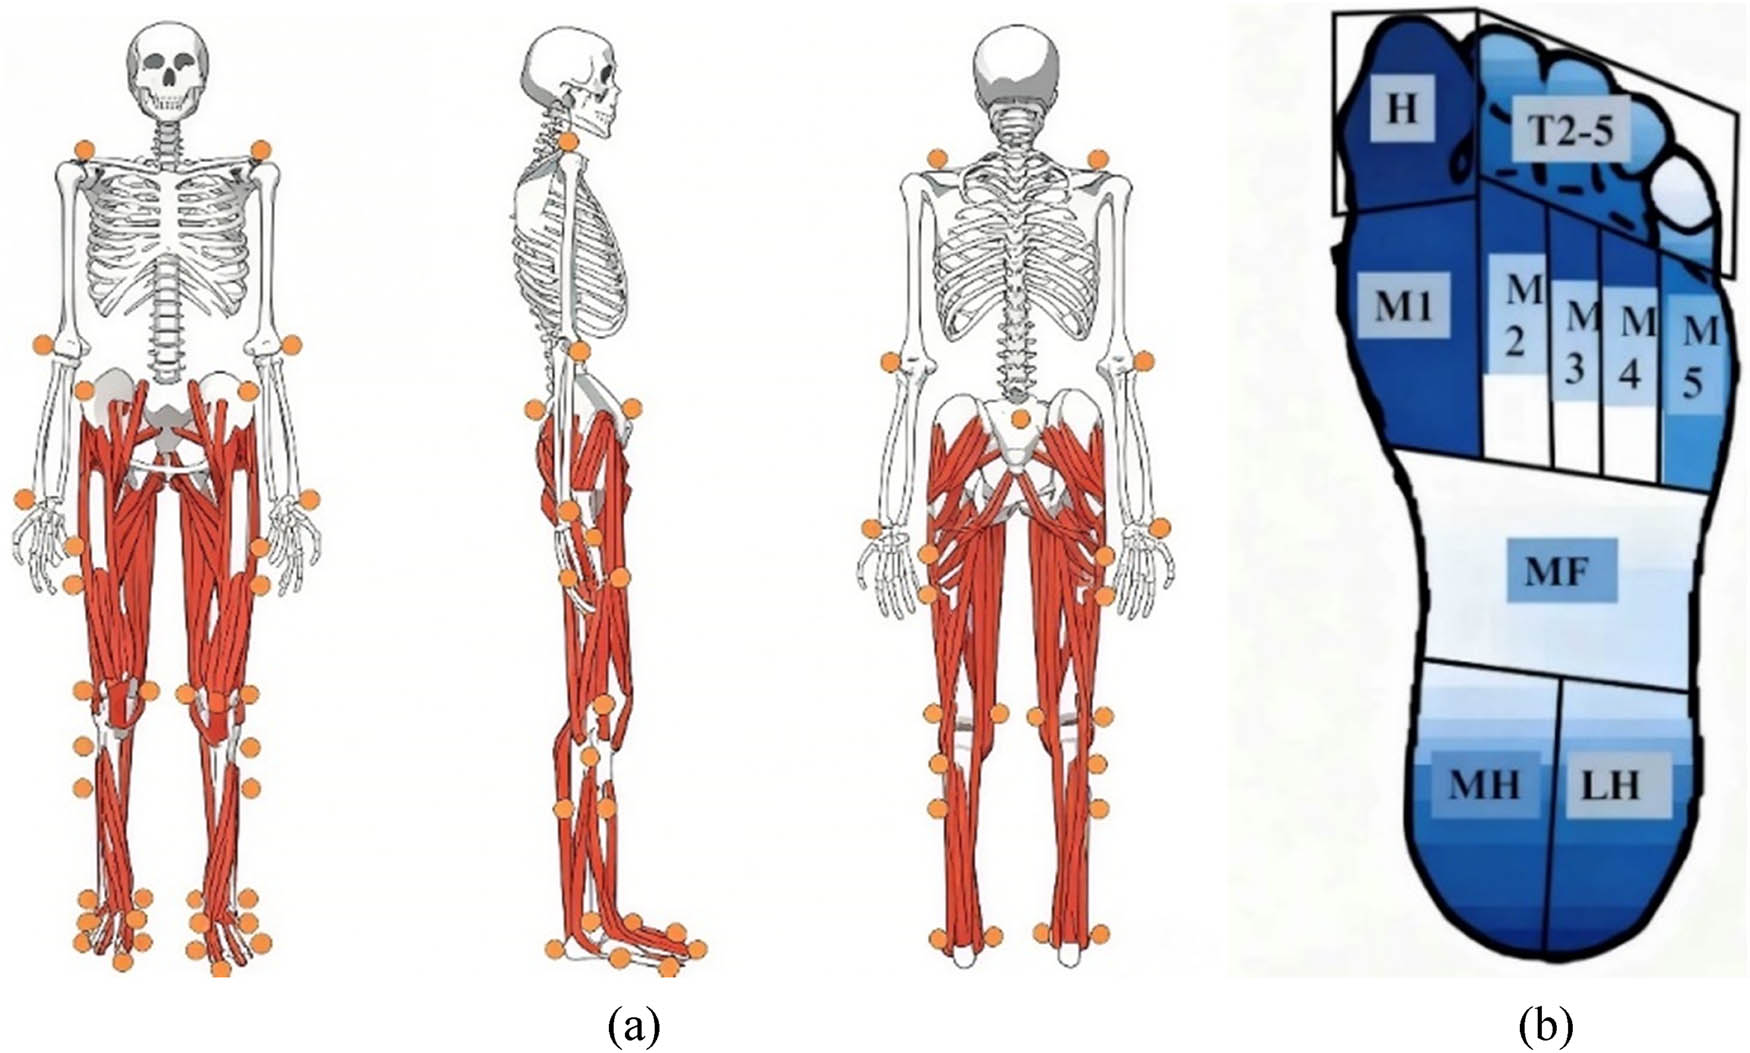
Figure 1
Illustration of marker-set model (a) and regions of the plantar surface (b).
While collecting static data, participants were required to hold both arms sideway with the right foot standing on the platform and both feet shoulder-width apart. The pressure plate was used to collect the plantar pressure data. Before the formal collection of plantar pressure data, static data were collected while participant stood barefoot in the center of the plate in an anatomically neutral position with eyes looking forward. Prior to the gait test, the participants practiced 3–5 times to ensure the consistency and accuracy of the gait. For dynamic data collection, the participants were required to complete five walking trials at a natural speed with the right foot stepping on the force platform, and then repeating with the left foot for five walking trials, to ensure the collection of a minimal of four valid trials for each limb, which was regarded as a successful pre-10k run gait test. Dynamic pressure data collection required the participant to step onto the data collection area with either foot at a self-selected speed, and repeat five times to ensure four trials of valid data for both feet.
Prior to the 10 km run, participants performed a standardized warm-up on a treadmill (Saturn h/p/cosmos, Nussdorf-Traunstein) starting at 6 km/h and increasing by 1 km/h every 2 min, for a total duration not exceeding 10 minutes. After the warm-up, participants completed a 10 km running test at a pace of 12 km/h [21–23]. To ensure natural movement without interference, all reflective markers were removed during the run. Within 10 minutes after completing the 10 km run, the testing personnel repeated the data collection process again.
2.3. Data processing
Motion capture data, including marker trajectories and ground reaction force, were labelled and extracted as C3D files using Vicon Nexus 2.8.2 software (Vicon Metrics Ltd, Oxford, UK), with the stance phase defined using a 20 N vertical ground reaction force threshold [24]. The C3D data were then processed in OpenSim (Stanford University, Stanford, CA, USA), where static marker positions and anthropometric data were used to scale personalized models from a generic template; custom Matlab scripts unified the coordinate system (x: forward, y: vertical upward, z: rightward) and converted data into .trc and .mot formats. Raw data were filtered using a bidirectional second-order low-pass Butterworth filter at 6 Hz [25], followed by inverse kinematics and inverse dynamics in OpenSim to compute joint angles and moments, with moment data normalized by body mass. For each participant and condition (pre- and post-10k run), three valid consecutive walking trials were selected – excluding those with incomplete gait cycles, marker tracking errors, or excessive noise – and averaged to generate a representative dataset, which was normalized to 101 data points to represent the stance phase; outliers were removed using a criterion of ±2 standard deviations from the condition-specific mean value prior to statistical analysis.
Using the RsScan software, the plantar surface was divided into ten anatomical regions (including the big toe, other toes (OT), metatarsophalangeal joints I-V, midfoot (MF), medial heel (MH) and lateral heel, as shown in Figure 1). Foot pressure parameters were analyzed using Footscan Software 7.0 and linear interpolation was applied to uniformly normalize the time-series foot pressure data from each region to 101 data points to represent 100% of the stance phase. The Z- avg index was introduced to standardize foot pressure parameters, thereby mitigating the influence of individual variations [26]. For each participant under both pre- and post-run conditions, three valid consecutive walking trials were selected excluding those with incomplete gait cycles or excessive noise and averaged to generate a representative plantar pressure dataset for subsequent statistical analysis.
2.4. Variables
Kinematic metrics in this study included joint angles and ROM at the bilateral hip, knee, and ankle joints in the sagittal, coronal, and horizontal planes. Kinetic parameters comprised joint moments at the bilateral hip, knee, and ankle joints across the three planes. Plantar pressure metrics encompassed the total plantar pressure and peak pressures across ten plantar zones. Lower limb joint angles in the sagittal plane were defined as hip flexion (+) and extension (−); knee flexion (−) and extension (+); and ankle dorsiflexion (+) and plantarflexion (−). The motion in the coronal plane was defined as hip and knee joints adduction (+), abduction (−); and ankle joint in inversion (+), eversion (−). The motion in the horizontal plane was defined as hip, knee, and ankle joints in internal rotation (+) and external rotation (−).
2.5. Statistical analysis
All data are expressed as mean value ± standard deviation (SD), rounded to two decimal places. First, the Shapiro-Wilks test was performed using SPSS software (Statistical Product and Service Solutions, Inc., USA) to assess normality of key indicators (joint angles, moments, ROM, etc.) pre- and post-10k run, ensuring the validity of subsequent statistical analyses. Subsequently, paired t-tests were conducted to analyze the significance of joint angles, joint moments in the sagittal, coronal, and horizontal planes, and ROM in the bilateral lower limbs between pre-10k and post-10k run, with the significance level set at p < 0.05. Given the one-dimensional time-varying characteristics of joint angles and moments, the one-dimensional Statistical Parametric Mapping (SPM1d) method based on random field theory was additionally applied to test for statistical differences in hip, knee, and ankle joint angles and moments across the three planes during the entire stance phase. These analyses were performed using MATLAB R2018a (The MathWorks, Inc., USA), with the significance level also set at p < 0.05, ensuring the rigor and scientific validity of the analytical results.
3. Result
3.1. Kinematics
The three-dimensional ROM of the hip, knee, and ankle joints pre-10k and post-10k run is shown in Table 1. During the post-10k run, the right hip adduction-abduction ROM (p = 0.044) and the left hip adduction-abduction ROM (p < 0.001) were significantly greater than pre-10k and post-10k values. Conversely, the left hip internal-external rotation ROM was less than pre-10k and post-10k levels (p < 0.001).
Table 1
Comparison of lower limb ROM pre-10k and post-10k run in both limbs (Unit: °)
| Joint ROM | Left limb | Right limb | |||||
|---|---|---|---|---|---|---|---|
| Pre-10k | Post-10k | Significance | Pre-10k | Post-10k | Significance | ||
| Hip | Flexion (+)/extension (−) | 48.27 (4.86) | 48.66 (4.38) | 0.726 | 49.55 (7.30) | 59.74 (4.70) | 0.375 |
| Adduction (+)/abduction (−) | 17.26 (3.55) | 22.15 (4.24) | <0.001** | 17.45 (4.32) | 20.14 (6.25) | 0.044* | |
| Internal rotation (+)/external Rotation (−) | 11.53 (3.95) | 8.51 (2.66) | <0.001** | 10.17 (3.29) | 9.45 (4.19) | 0.307 | |
| Knee | Flexion (+)/extension (−) | 33.38 (3.40) | 32.92 (4.13) | 0.529 | 32.11 (4.38) | 32.10 (2.90) | 0.988 |
| Adduction (+)/abduction (−) | 5.39 (2.58) | 5.41 (3.48) | 0.024* | 5.08 (3.02) | 5.96 (2.11) | 0.038* | |
| Internal rotation (+)/external rotation (−) | 21.20 (7.72) | 28.51 (9.12) | <0.001** | 24.68 (8.21) | 23.32 (5.76) | 0.366 | |
| Ankle | Dorsiflexion (+)/plantarflexion (−) | 18.67 (2.72) | 17.83 (2.75) | 0.153 | 17.99 (2.31) | 17.42 (2.42) | 0.286 |
Note: “*” indicates p < 0.05 and “**” indicates p < 0.01.
The SPM1d analysis indicates (Figure 2) that post-10k run, the right hip adduction angle during the 96–100% of the stance was smaller than pre-10k and post-10k levels (p = 0.048), while the hip internal rotation angle remained larger than pre-10k and post-10k levels throughout the stance (p < 0.001). The left hip adduction angle was smaller than pre-10k and post-10k values during the 35–100% of the stance (p < 0.001), while the hip internal rotation angle was smaller than pre-10k and post-10k values during the 0–48% of the stance (p < 0.001).
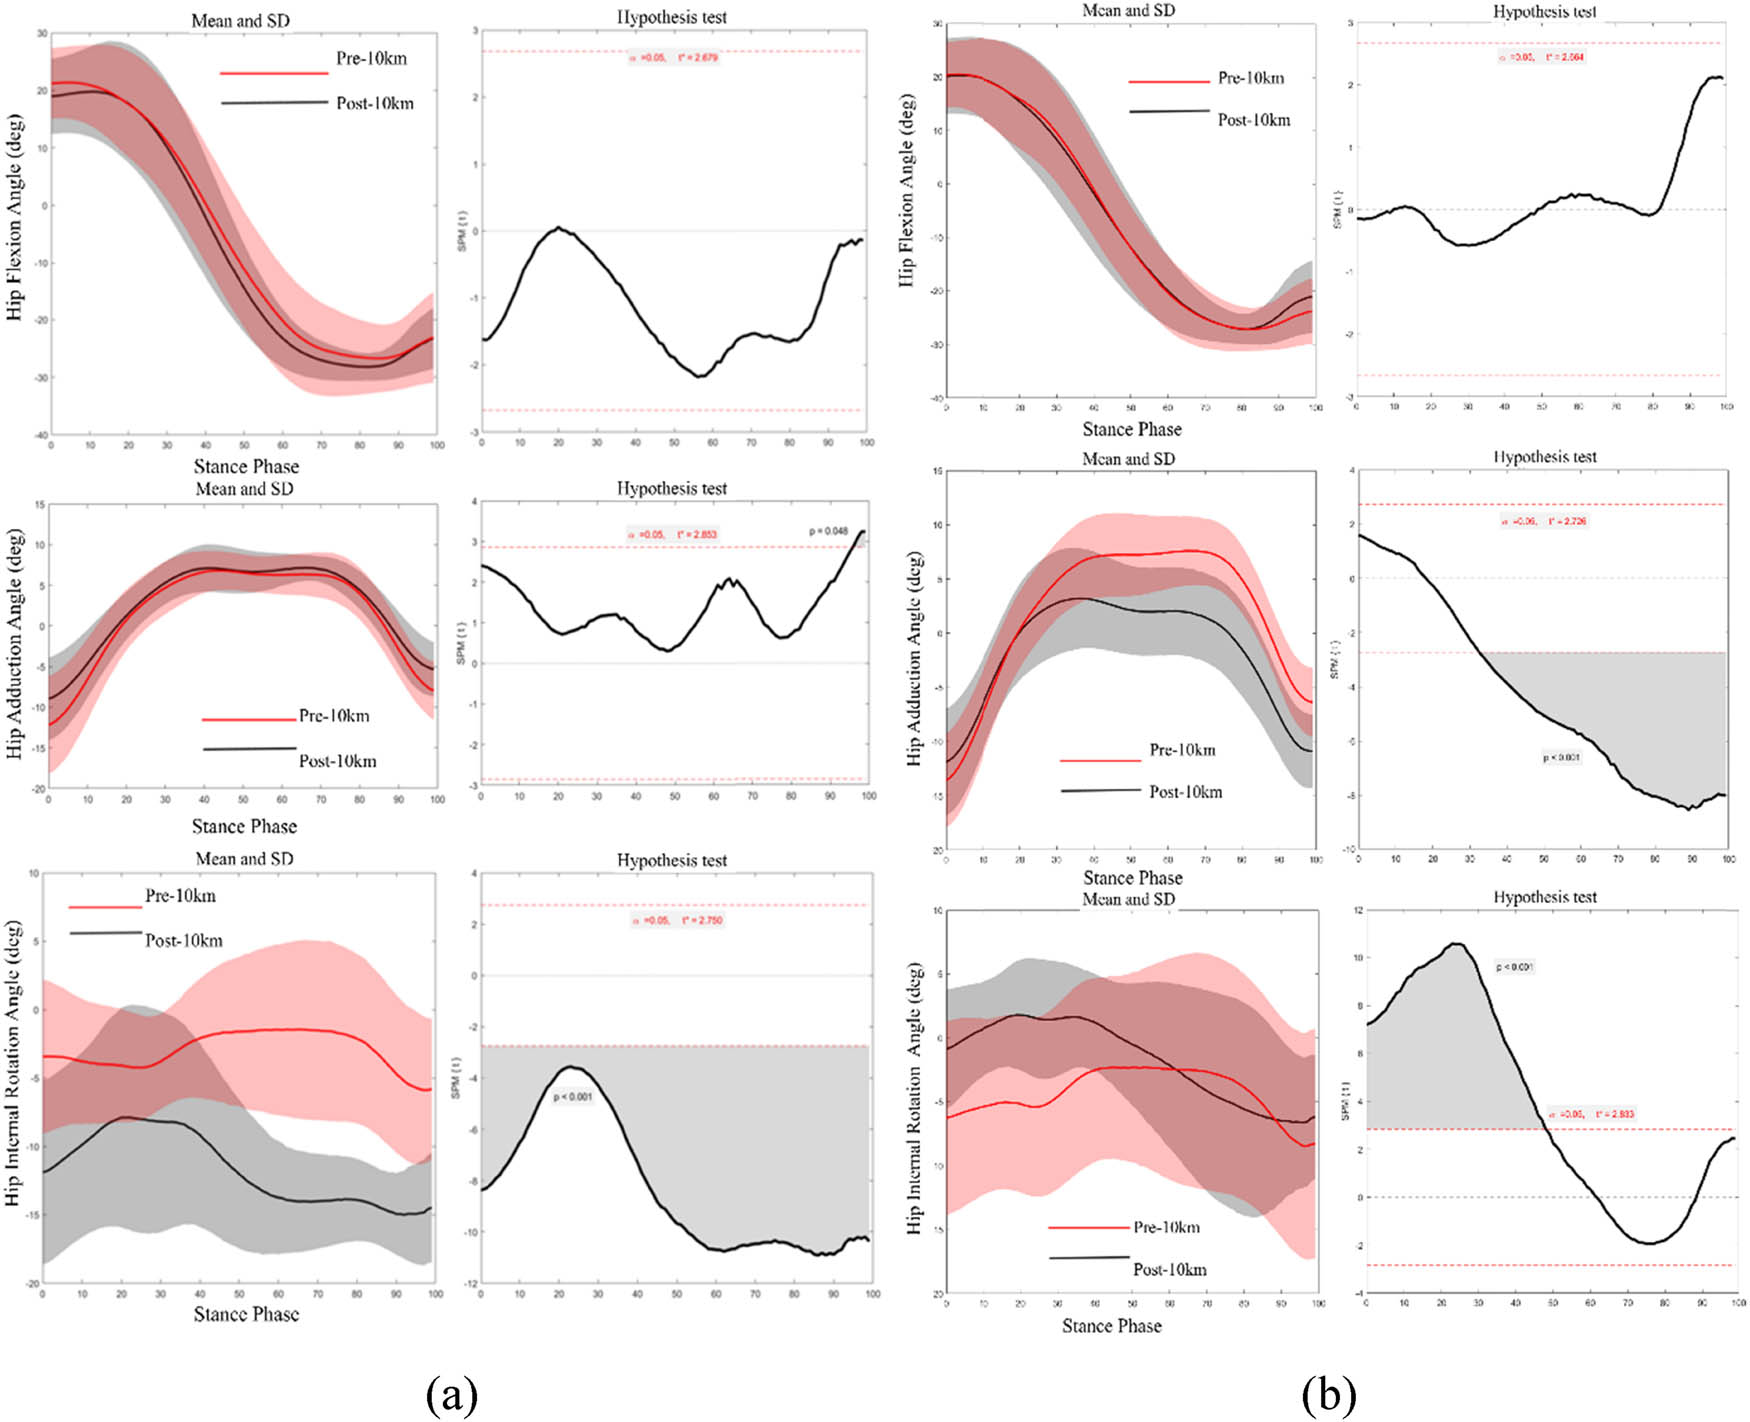
Figure 2
SPM1d statistics of the right (a) and left (b) hip angles pre-10k and post-10k run.
Post-10k run, the adduction-abduction ROM in both knees was greater than pre-10k run (right side p = 0.038; left side p = 0.024). Additionally, the internal-external rotation ROM in the left knee was greater than the pre-10k (p < 0.001).
The SPM1d results indicate (Figure 3) that post-10k run, the right knee flexion angle during the 10–70% of the stance was less than pre-10k and post-10k levels (p < 0.001), the knee adduction angle during the 80–100% of the stance was less than pre-10k and post-10k levels (p = 0.033), and the knee internal rotation angle was smaller than pre-10k and post-10k values during the 0–17% and 32–92% of the stance (p = 0.042; p = 0.002). Conversely, the left knee adduction angle was larger than pre-10k and post-10k values during the 75–100% of the stance (p = 0.002).
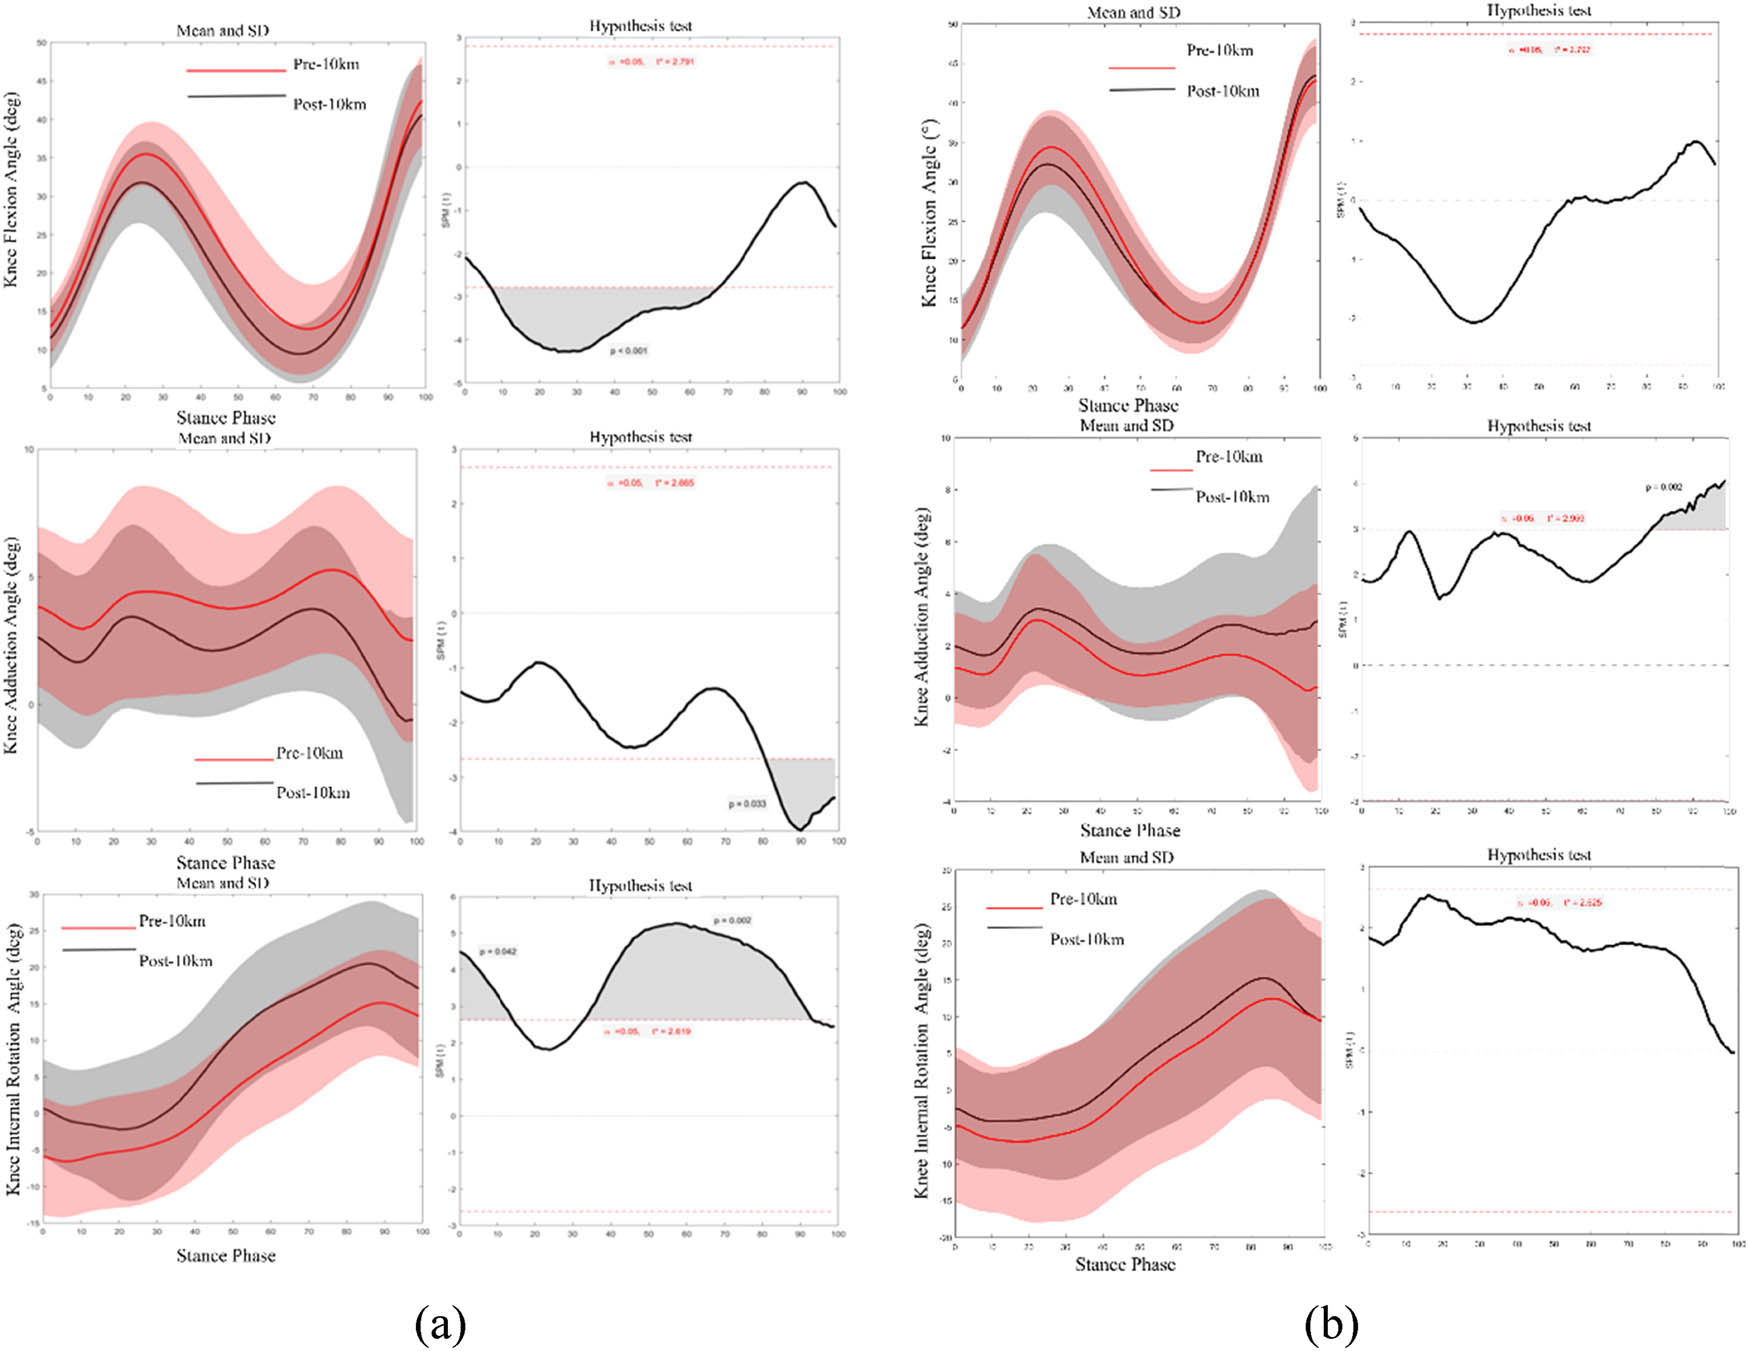
Figure 3
SPM1d statistics of the right (a) and left (b) knee angles pre-10k and post-10k run.
No significant differences in ankle joint ROM were observed on either side pre-10k and post-10k run. The SPM1d results (Figure 4) showed that post-10k run, the right ankle dorsiflexion angle was smaller than pre-10k run during the 10–50% of the stance; while the ankle dorsiflexion angle of the left ankle joint was reduced during the 23–43% (p = 0.012) and 84–100% (p = 0.021) of the stance compared to pre-10k and post-10k.
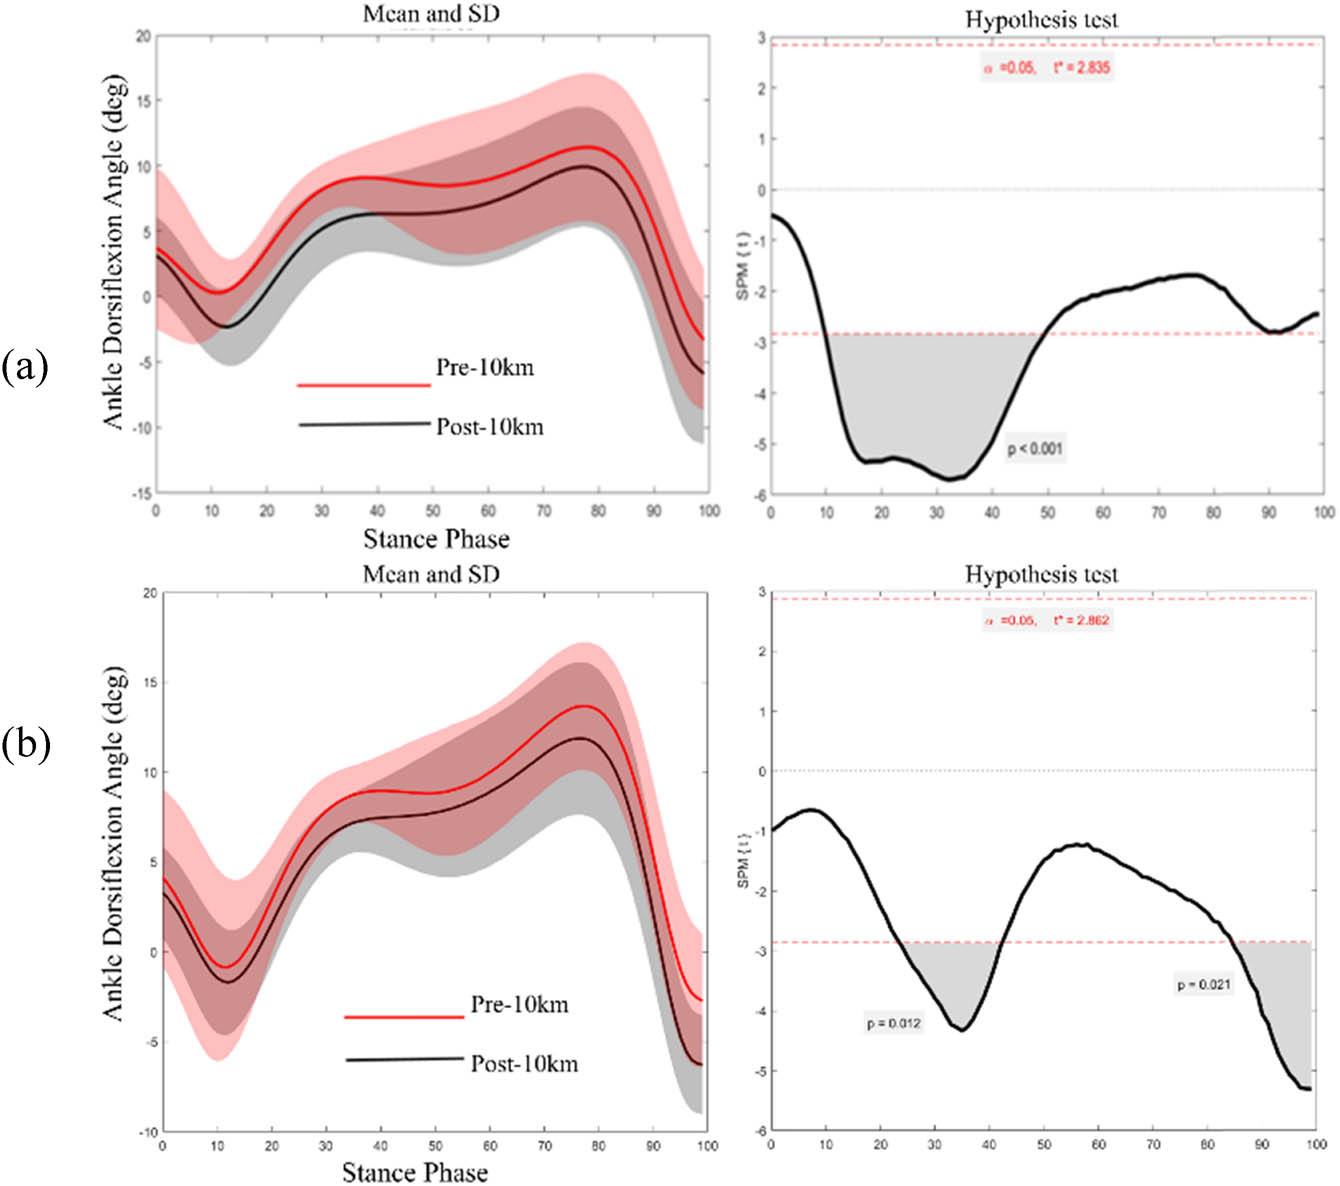
Figure 4
SPM1d statistics of the right (a) and left (b) ankle angles pre-10k and post-10k run.
3.2. Kinetics
Bilateral lower limb joint moments at the hip, knee, and ankle joints pre-10k and post-10k run are presented in Table 2. During the post-10k run, the right hip joint exhibited significantly greater extension, abduction, and internal rotation moments compared to the pre-10k levels (p < 0.001). The left hip joint showed a significantly higher extension moment than the pre-10k run (p < 0.001), while both abduction and internal rotation moments were lower than pre-10k and post-10 km values (p < 0.001).
Table 2
Comparison of hip Moments pre-10k and post-10k run in both limbs (Unit: Nm/kg)
| Joint moment | Pre-10k | Post-10k | Significance | |
|---|---|---|---|---|
| Right | Flexion (+)/ extension (−) | −0.60 (0.62) | −0.66 (0.01) | <0.001** |
| Adduction (+)/abduction (−) | −0.15 (0.20) | −0.21 (0.21) | <0.01** | |
| Internal rotation (+)/external rotation (−) | −0.01 (0.06) | 0.01 (0.07) | <0.001** | |
| Left | Flexion (+)/ extension (−) | −0.58 (0.67) | −0.61 (0.62) | <0.001** |
| Adduction (+)/abduction (−) | −0.49 (0.29) | −0.48 (0.33) | <0.001** | |
| Internal rotation (+)/external rotation (−) | 0.04 (0.11) | 0.03 (0.12) | <0.001** |
Note: “*” indicates p < 0.05 and “**” indicates p < 0.01.
SPM1d results indicate (Figure 5) that compared to the pre-10k run, post-10k run exhibited significantly greater right hip extension moments during the 10% (p = 0.050), 77% (p = 0.050), 88–91% (p = 0.043), and 96–100% (p = 0.023) of the stance. Right hip abduction moment was significantly greater than pre-10k levels during the 0–2% (p = 0.009), 8% (p = 0.050), 22–32% (p < 0.001), and 85–100% (p < 0.001) of the stance. Hip internal rotation moment was greater than the pre-10k run during the 48–78% of the stance (p < 0.001). Left hip flexion moment showed no significant difference between the pre-10k and post-10k run. However, the hip abduction moment was significantly lower than the pre-10k run during the 3–11% (p = 0.009), 18–19% (p = 0.050), and 72–82% (p < 0.001) of the stance. The hip internal rotation moment was lower than the pre-10k run during the 65–67% of the stance (p = 0.031).
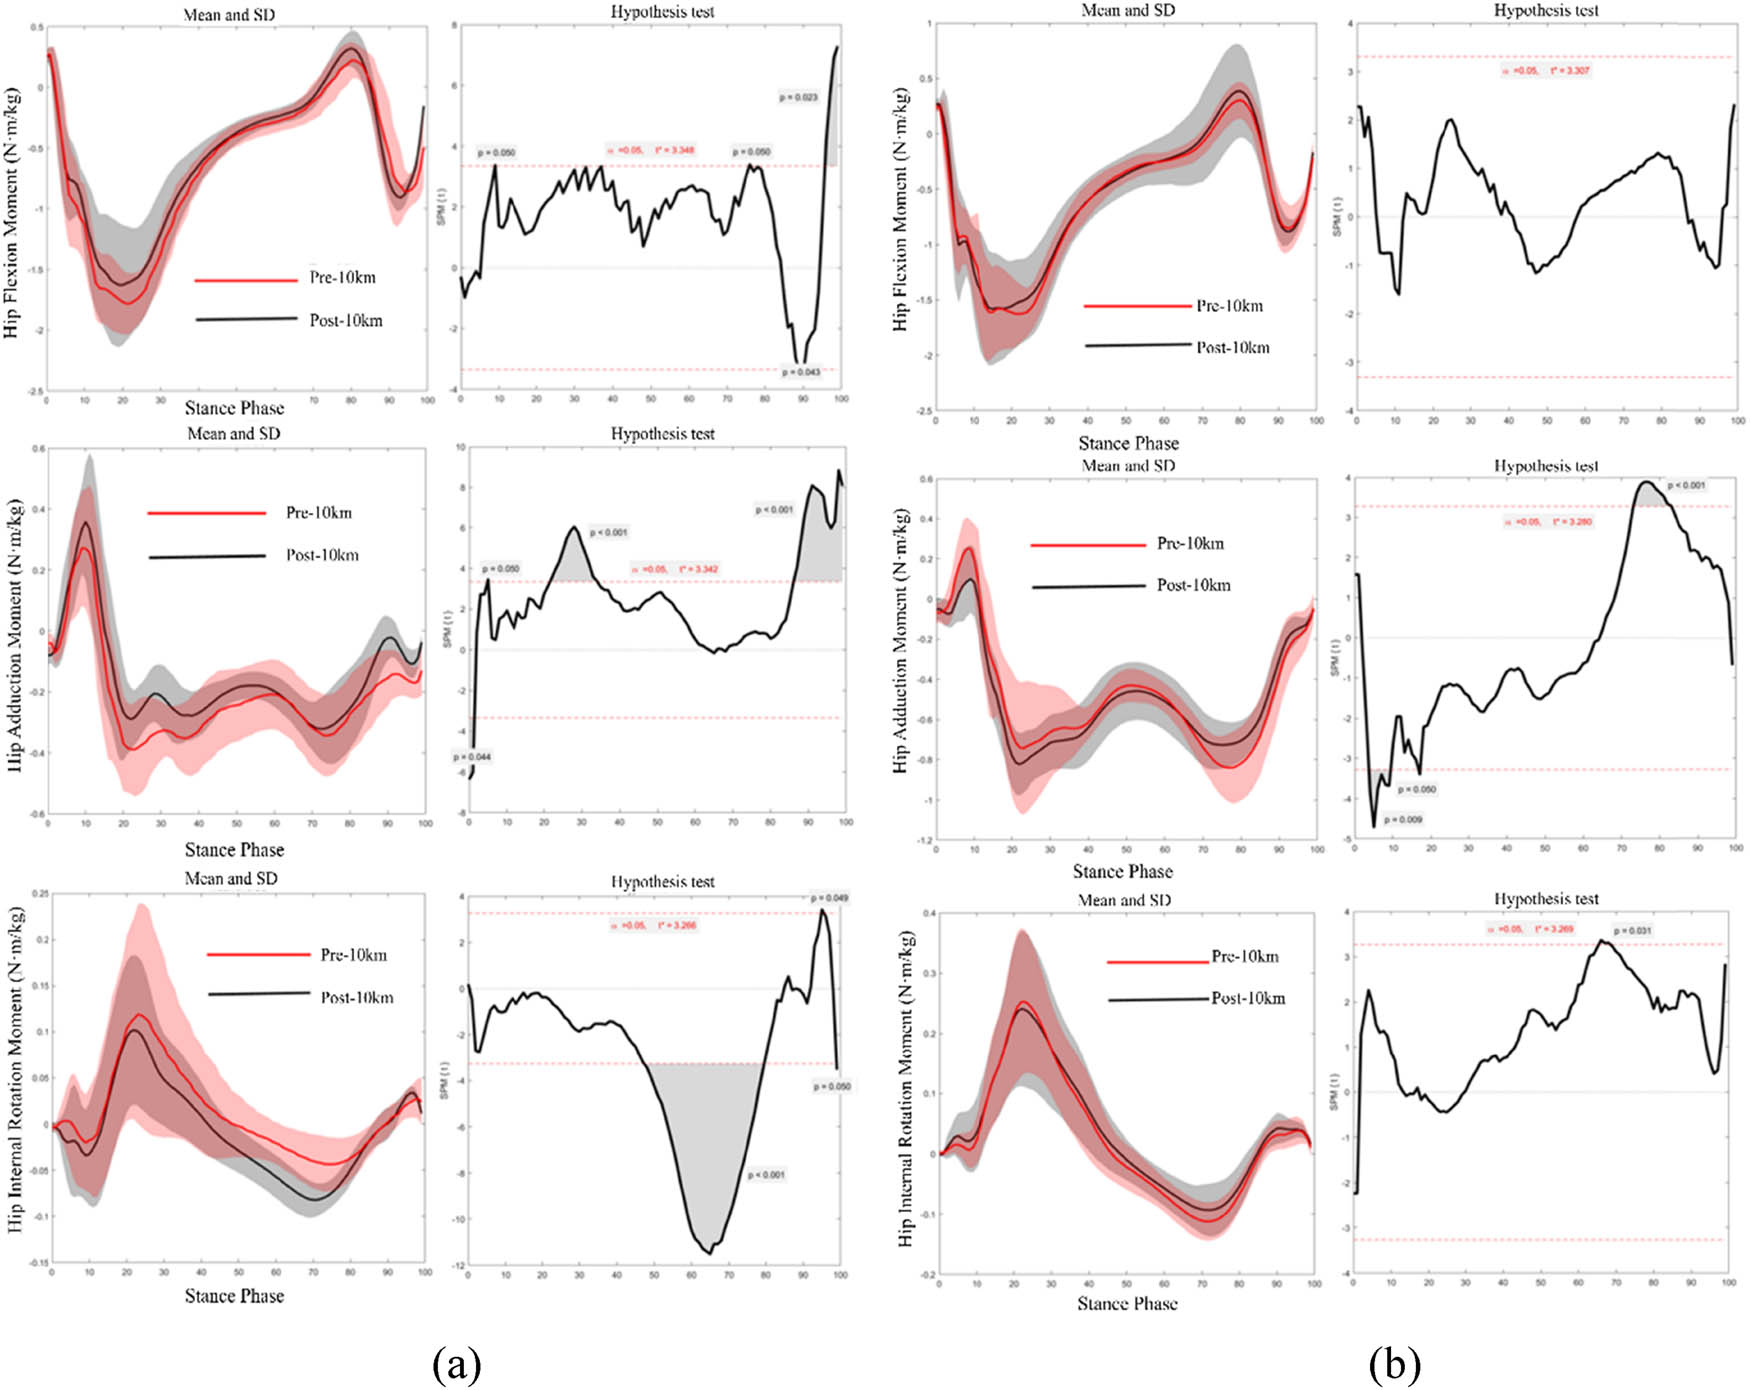
Figure 5
SPM1d statistics of the right (a) and left (b) hip moments pre-10k and post-10k run.
Bilateral knee joint moments during the pre-10k and post-10k run are shown in Table 3. Significant differences were observed that the right knee flexion moment of post-10k run was lower than the pre-10k (p < 0.001), while knee abduction moment was higher than the pre-10k (p < 0.001). No significant differences were observed in sagittal or horizontal plane joint moments of the left knee between the pre-10k and post-10k run. However, the left knee abduction moment of the post-10k run was significantly greater than the pre-10k run (p < 0.001).
Table 3
Comparison of knee moments pre-10k and post-10k run in both limbs (Unit: Nm/kg)
| Joint moment | Pre-10k | Post-10k | Significance | |
|---|---|---|---|---|
| Right | Flexion (+)/ extension (−) | 0.24 (0.24) | 0.18 (0.25) | <0.001** |
| Adduction (+)/abduction (−) | −0.12 (0.17) | −0.13 (0.17) | <0.001** | |
| Internal rotation (+)/external rotation (−) | −0.03 (0.04) | −0.03 (0.05) | 0.816 | |
| Left | Flexion (+)/ extension (−) | 0.15 (0.34) | 0.16 (0.25) | 0.160 |
| Adduction (+)/abduction (−) | −0.32 (0.24) | −0.34 (0.22) | <0.001** | |
| Internal rotation (+)/external rotation (−) | −0.06 (0.07) | −0.06 (0.07) | 0.667 |
Note: “*” indicates p < 0.05 and “**” indicates p < 0.01.
SPM1d results indicate (Figure 6) that the right knee flexion moment during the 23–32% of the stance was greater in the pre-10k run than the post-10k run (p < 0.001); the right knee abduction moment during the 0–2% (p = 0.050), 88–92%, and 97–100% (p = 0.048) of the stance (p = 0.050), while the knee internal rotation moment was lower than pre-10k during the 85–100% of stance (p = 0.001). No significant differences in left knee flexion or adduction moments were observed during the stance phase of pre-10k and post-10k run. However, during the post-10k run, the knee abduction moment was greater than the pre-10k run during the 18–42% of the stance (p < 0.001).
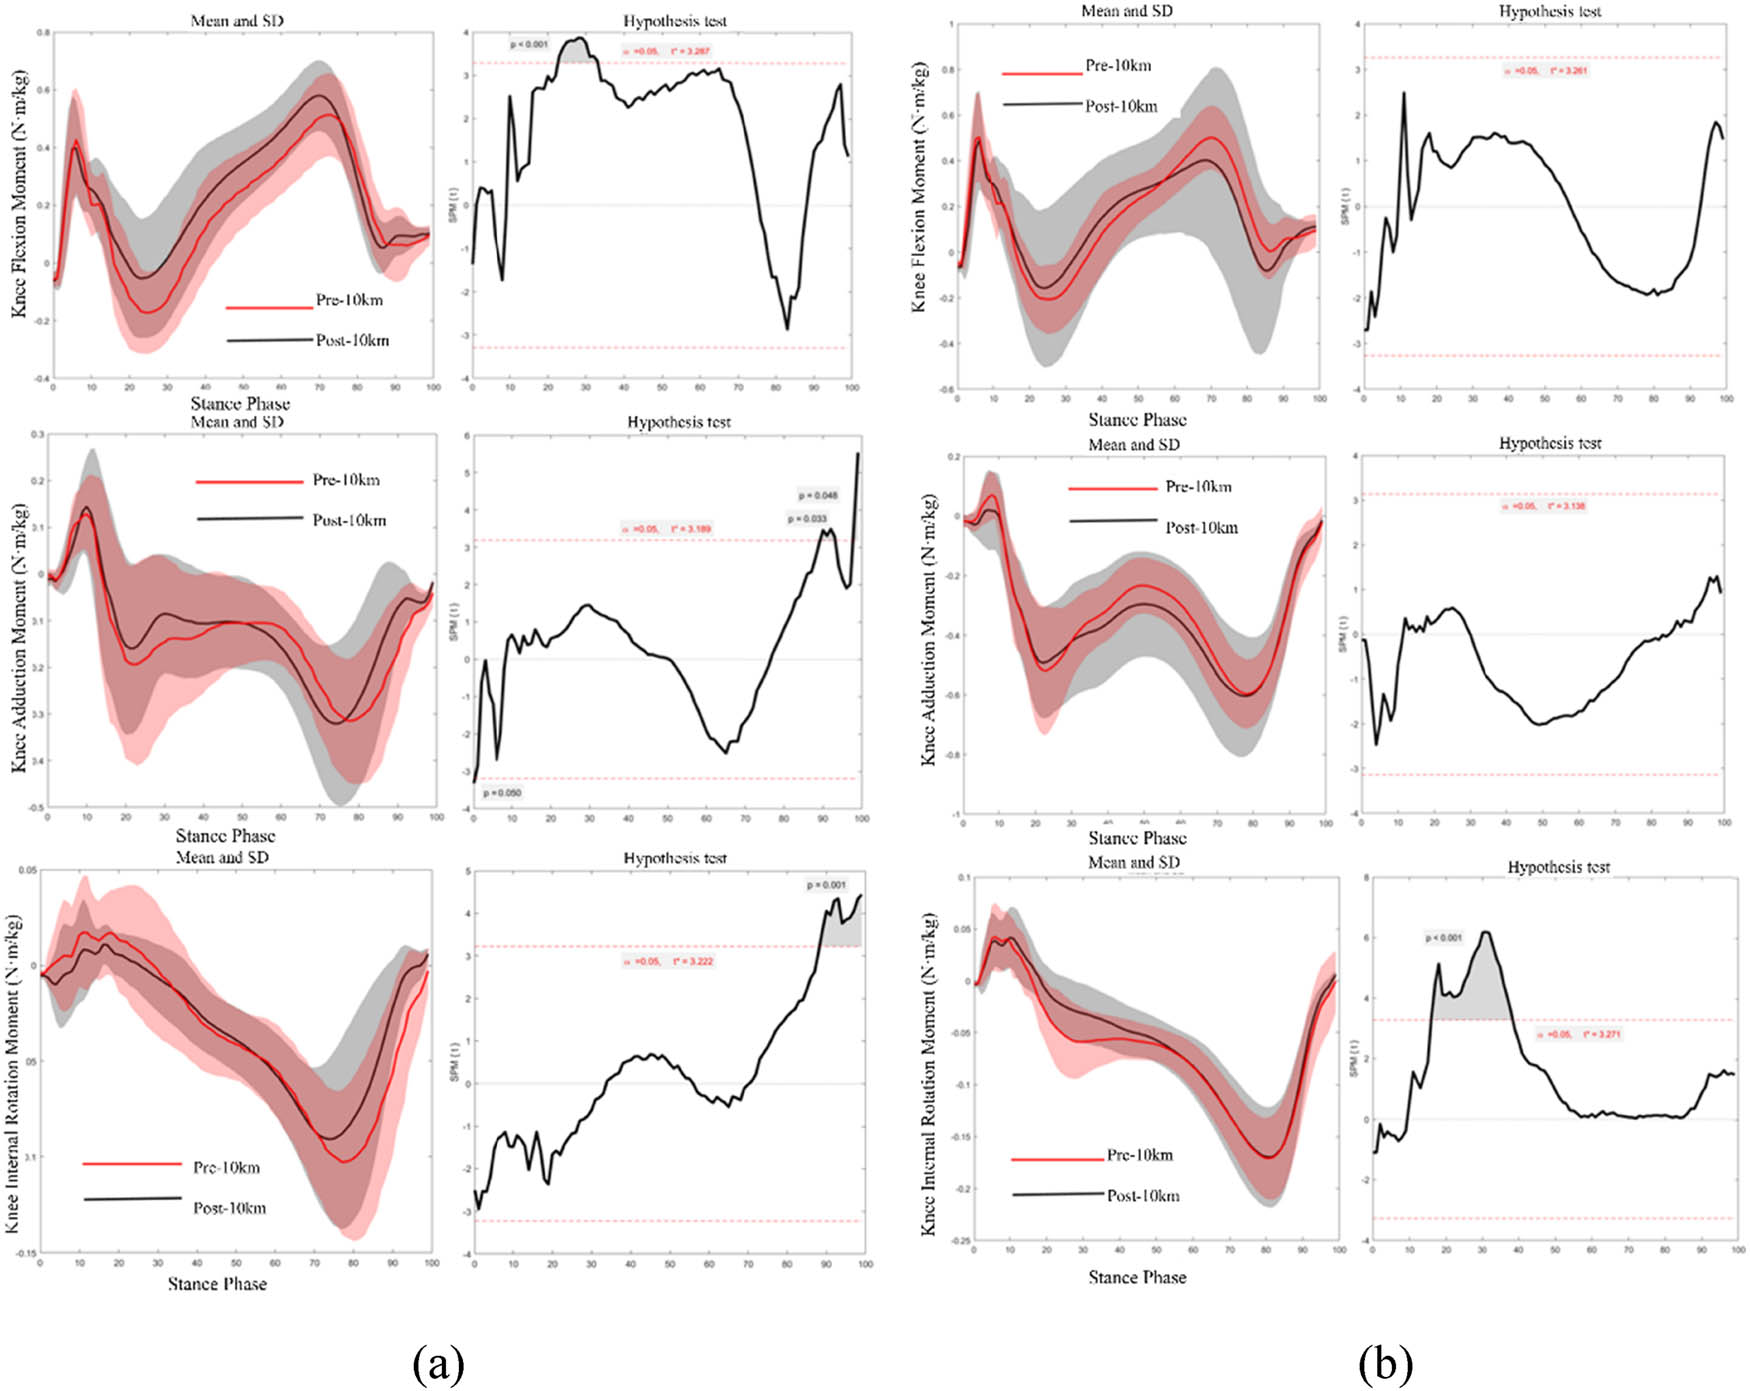
Figure 6
SPM1d statistics of the right (a) and left (b) knee moments pre-10k and post-10k run.
Statistical results of bilateral ankle joint moments during the pre-10k and post-10k run are shown in Table 4. During the post-10k run, the plantarflexion moment in the right ankle was greater than the pre-10k run (p < 0.001), while the dorsiflexion moment in the left ankle showed no significant difference during the stance.
Table 4
Comparison of ankle moments pre-10k and post-10k run in both limbs (Unit: Nm/kg)
| Joint moment | Pre-10k | Post-10k | Significance | |
|---|---|---|---|---|
| Right | Dorsiflexion (+)/plantarflexion (−) | −0.90 (0.55) | −0.95 (0.52) | <0.001** |
| Left | Dorsiflexion (+)/plantarflexion (−) | −0.86 (0.56) | −0.87 (0.53) | 0.060 |
Note: “*” indicates p < 0.05 and “**” indicates p < 0.01.
SPM1d results indicate (Figure 7) that during the post-10k run, the dorsiflexion moment of the right ankle during the 83–100% of the stance was significantly lower than the pre-10k run (p < 0.001). No significant differences were observed in the dorsiflexion moment of the left ankle throughout the stance.
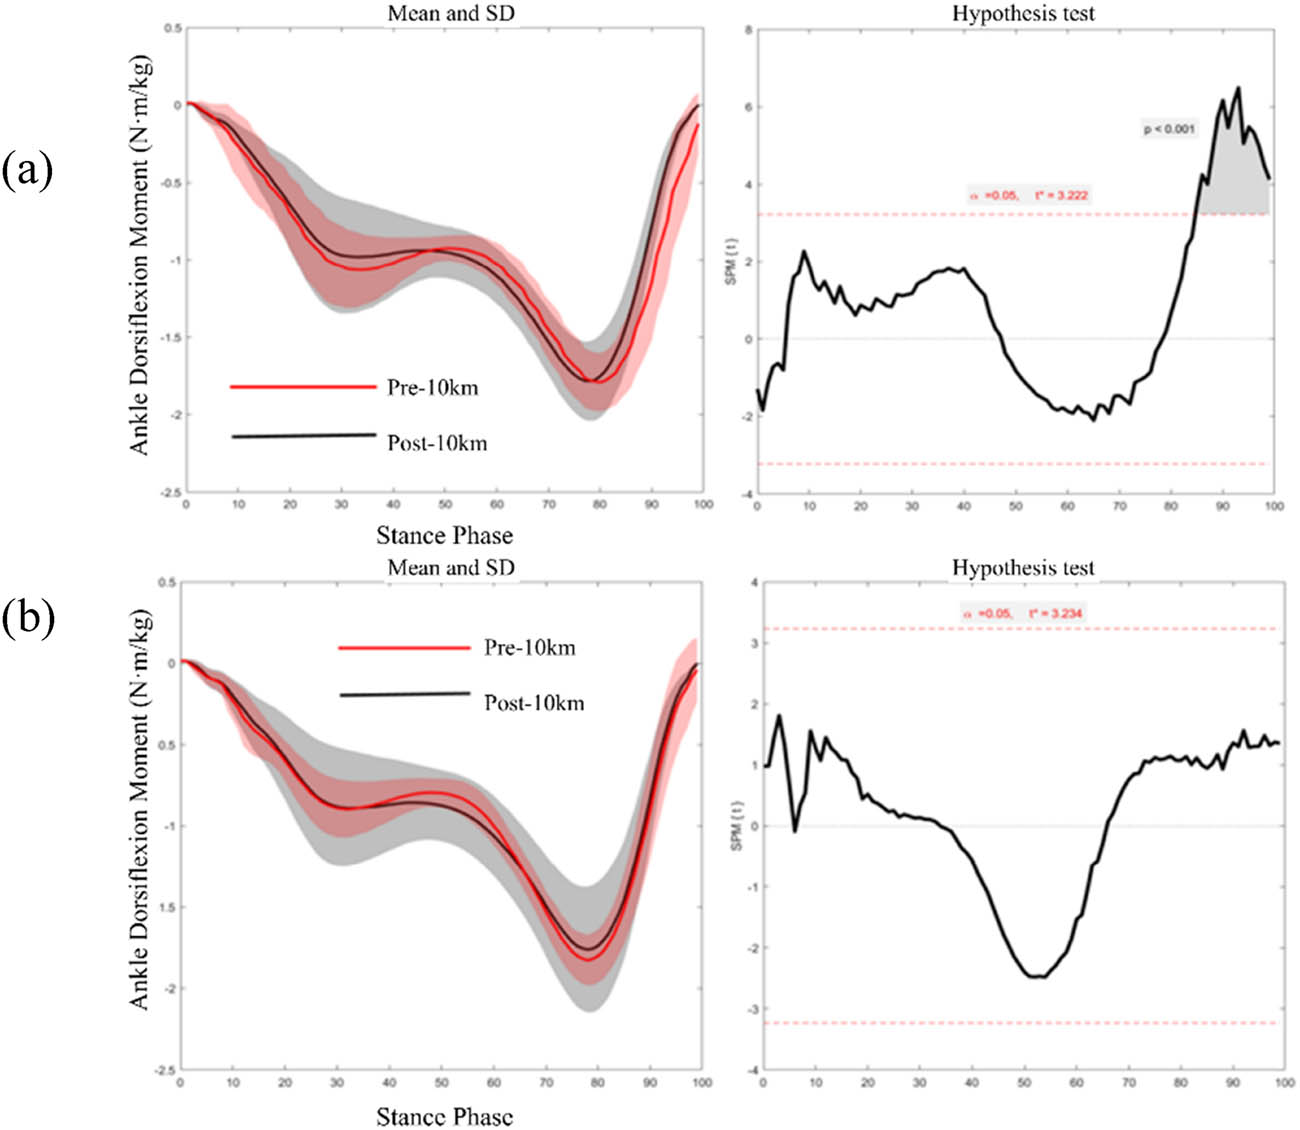
Figure 7
SPM1d statistics of the right (a) and left (b) ankle moment pre-10k and post-10k run.
3.3. Plantar pressure
During the post-10k run, significant changes in plantar pressure were observed in specific regions and stance phases. SPM1d results (Figure 8) indicate that total plantar pressure during the 0–3% of stance was significantly higher than the pre-10k run (p = 0.047). Further analysis (Figure 9) indicates that regional pressure changes exhibit the following alterations, the MH region showed higher plantar pressure during the 0–3% and 30–50% phases of the stance period compared to pre-10 km and post-10 km (p = 0.047; p = 0.002); The first metatarsal (M1) region exhibited lower plantar pressure during the 30–50% phase of the stance period compared to pre-10 km and post-10 km levels (p = 0.001); the OT region showed lower pressure during the 40% and 50–90% phases of the stance period compared to pre-10 km and post-10 km levels (p = 0.047; p < 0.001).
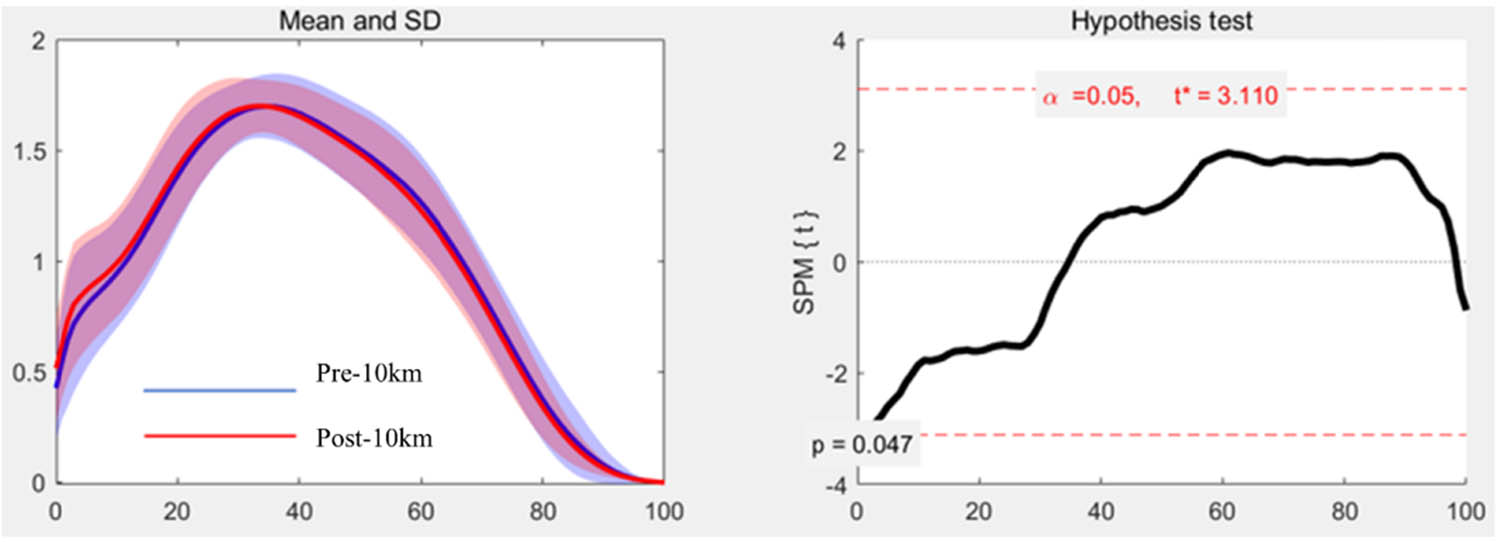
Figure 8
SPM1d statistics of the total plantar pressure pre-10k and post-10k run.
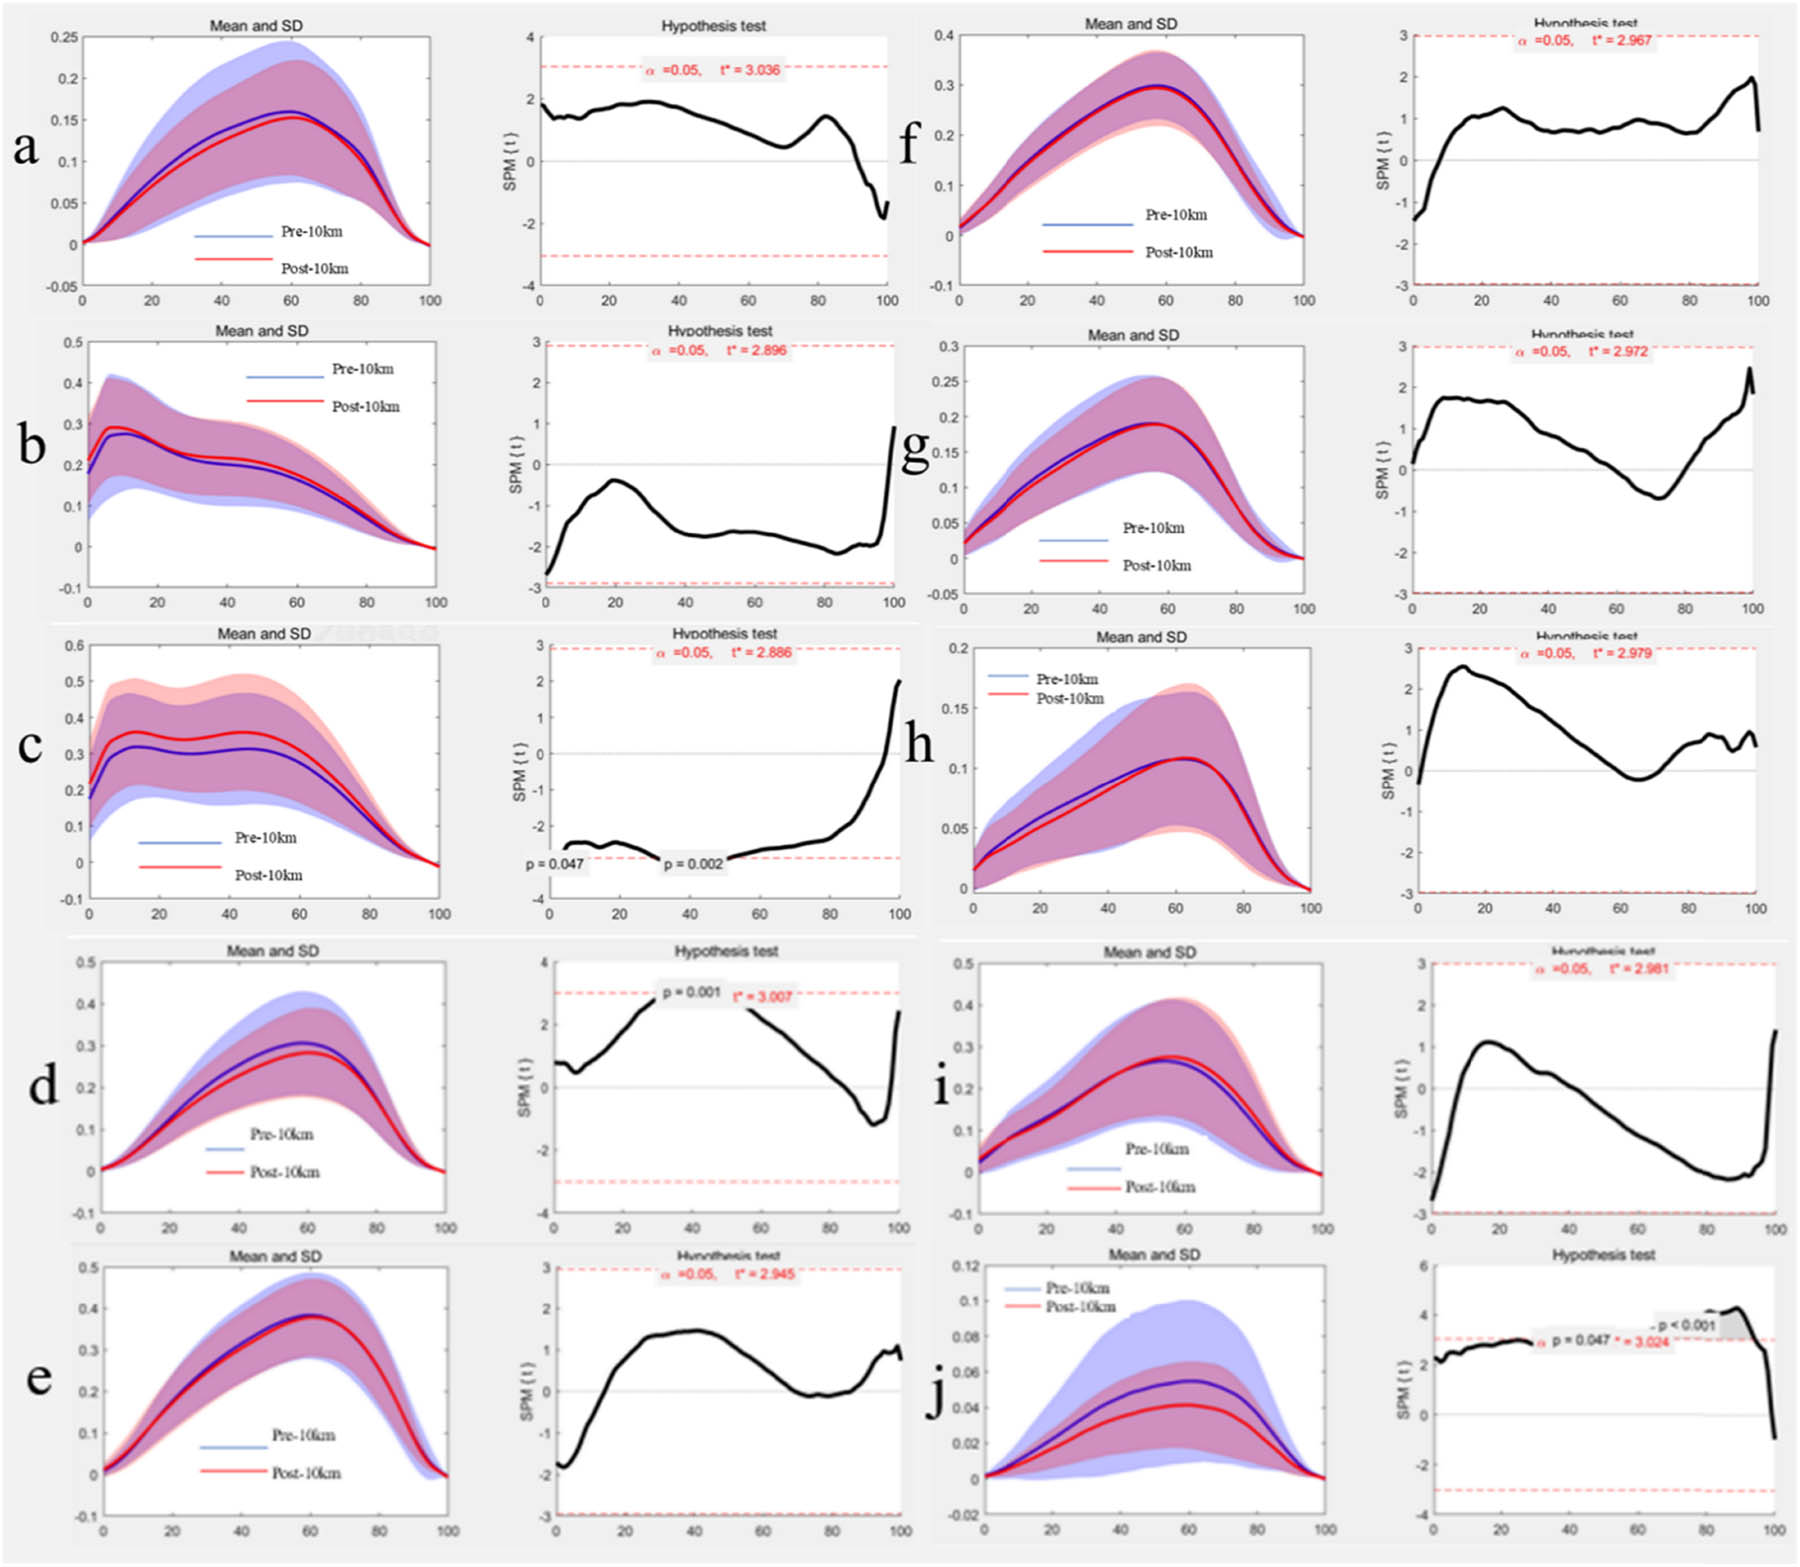
Figure 9
SPM1d statistics of plantar pressure in ten regions during the pre-10k and post-10k run. Note: (a) bunion region, (b) lateral heel region, (c) MH, (d) metatarsophalangeal joint I region, (e) metatarsophalangeal joint II region, (f) metatarsophalangeal joint III region, (g) metatarsophalangeal joint IV region, (h) metatarsophalangeal joint region, (i) MF region, and (j) OT region.
4. Discussion
The study primarily investigated the influence of a 10k run on the time-series lower limb joint kinematics and kinetics, as well as regional and total plantar pressure distribution in recreational male runners. Findings revealed significant differences in joint ROM and joint moments between the dominant (right) and non-dominant (left) lower limbs during the pre-10k and post-10k run. The total plantar pressure during stance was significantly higher in the post-10k run compared to the pre-10k run.
During the post-10k run, the significant changes of joint ROM were observed in bilateral limb. Specifically, it was found that the hip adduction-abduction ROM was significantly larger post-10k run than the pre-10k, consistent with previous studies concluding that the coronal ROM of hip joint increased following running fatigue [27,28]. Joint ROM is one of the most fundamental and important indicators to assess the function and condition of the musculoskeletal system, which was believed that significant changes in ROM in bilateral limb during post-10k run may be attributable to fatigue induced by the distance run. This fatigue may lead to alterations in trunk and pelvic positioning, which then altered the hip joint ROM [29,30].
Following the fatigue of the core, the hip joint mobility in the coronal plane (adduction-abduction ROM) increased, thus generating greater abduction moments. The changes may lead to compensatory pelvic abduction [31], elevating the joints injury risk of lower limb and relevant muscles [14]. Consequently, the incidence of running-related conditions, such as iliotibial band syndrome and patellar pain increases [14,32]. Additionally, a recent study found that due to the fatigue from post-10k run, the left hip joint exhibited a smaller internal-external rotation ROM, which may relate to the functional decline of hip external rotator muscles in the non-dominant leg due to exercise fatigue [33]. The primary function of hip external rotators is to limit excessive femoral internal rotation during cyclic weight-bearing movements [34]. As reported, the weak hip external rotators are one of the main contributing factors of patellofemoral pain syndrome [34]. These changes in hip joint mobility suggest that fatigue induced by a 10 km run not only alters the hip movements but also affects the overall injury risk in the biomechanical chain of the lower extremity.
During post-10k run, the adduction-abduction ROM of both knee joint increased significantly compared to the pre-10k run, consistent with previous research findings [35]. It was believed that running-induced fatigue may compromise neuromuscular control, leading to reduced trunk stability and consequently increased knee joint mobility, and the biomechanical alteration may disrupt normal loading transmission, significantly increasing ground reaction forces during foot contact [36], ultimately increasing the injury risk of the knee joint [31,37]. Previous studies indicated that fatigue in the quadriceps and hamstrings, functioning as the primary muscle groups to control knee flexion and extension, would lead to a reduction in knee flexion angle [38]. This alteration is likely associated with increased resistance during flexion and extension movements [38] and is considered as a biomechanical adaptive change during exercise at certain intensities [39]. Additionally, a recent study indicates that an increased knee adduction angle corresponds to an increased risk of lateral collateral ligament and medial meniscus injuries [40].
The current study found no significant difference in the ankle dorsiflexion-plantarflexion ROM between the pre-10k and post-10k run. However, changes in ankle joint mobility, particularly the dorsiflexion angle, remain significant as a key indicator in running biomechanics and injury research. Previous studies indicated that fatigue induced by prolonged or high-intensity exercise significantly increased the ankle dorsiflexion angle, as a close link to the diminished function in the calf muscle groups [41]. Running-induced weakening of calf muscle strength and diminished contraction control may compromise the ankle stability, thus leading to abnormally increased dorsiflexion angles [41]. Elevated dorsiflexion altered foot strike patterns, increasing ankle impact loads and inversion/eversion moments. Over time, this alteration may cause soft tissue injuries or even the stress fractures [42]. Simultaneously, the changes would disrupt the energy storage and release during stance, reducing running economy and exacerbating fatigue and injury risks. Therefore, runners may pay close attention to changes in ankle joint mobility, particularly the increase in dorsiflexion ROM, as this is crucial for prevention of running-related foot and ankle injuries [42,43].
Joint moment, as a key kinetic parameter, is influenced by multiple factors including muscle active moment and passive ligament constraints. Previous study found that fatigue induced by long-distance running not only altered joint ROM but also significantly affected lower limb joint moments. These changes may partly stem from fatigue-induced decreases in muscle strength and alterations in muscle coordination patterns, and may also be related to diminished neuromuscular control. Both factors would affect the generation and regulation of joint moment [15].
Following a 10k run, participants exhibited significantly increased hip extension and external rotation moment, consistent with findings from a previous study [44]. A recent study reported that decreased muscle strength in hip flexors, abductors, and external rotators would be closely associated with running related injuries [44]. The muscle weakness may disrupt the moment balance in the hip joint during running, thus leading to abnormally increased hip extension and external rotation moments post-long-distance running. Furthermore, the significant increase in hip abduction moment may relate to the primary reliance on muscle groups surrounding large joints (such as the hip) to absorb impact, and maintain stability from distance running [45]. Additionally, the differences in joint moment between novice and professional runners may be attributed to variations in muscle strength, muscle alignment, and joint coordination [33].
Following a 10k run, the right knee joint exhibited a significant reduction in extension moment during stance. This change might result from the fatigue of hip abductors, thus compromising joint stability and triggering compensatory adjustments in the knee to maintain balance [46]. Alternatively, the distance run may reduce the capacity of dynamic motor control, leading to a marked decrease in both knee extensor and plantar flexor strength [39]. Further, a decreased knee joint moment may suggest the reduced excitability of the central nervous system and diminished control in the lower limbs [39]. Previous study found that post-10k run, the increased adduction-abduction moment in both knees was observed, which may elevate the impact loads on the knee joint and increased the injury risk, such as anterior knee pain [47]. Although this study did not observe significant changes in internal rotation moments in bilateral knee, previous study indicated that a decreased internal rotation moment may represent a protective mechanism employed to reduce torsional stress on the tibia [32,45].
During the post-10k run, the right ankle joint exhibited a significantly increased plantarflexion moment, potentially related to calf muscle fatigue and reduced stability [48]. This change increased the impact loads during stance, compromising the lower limb performance and increasing injury risk [48]. Although this study did not examine changes in the ankle joint’s sagittal and coronal planes, a recent study [49] reported that post-running fatigue, the left ankle exhibited a significant adduction moment and higher joint stiffness, which may facilitate the transfer of plantar load outward to maintain running stability, thus laying the foundation for dominant leg propulsion. Further, the right ankle joint exhibited a greater abduction moment, potentially causing temporary drop of the medial arch and shifting the plantar pressure center forward to facilitate propulsion by the dominant leg [50]. However, over the long term, increased medial foot loading may induce arch collapse, subsequently triggering tibial internal rotation and elevated medial knee loading, thereby constituting a potential mechanism for running-related injuries [51].
The study observed a significant increase in the total plantar pressure post-10k run, consistent with findings by Hohmann et al. [52]. However, this contrasts with another report indicating the decreased plantar pressure or no significant change [53]. This discrepancy may result from differences in exercise-induced fatigue protocols, such as variations in exercise intensity, duration, and the baseline fitness levels. In contrast to the overall trend of plantar pressure changes, this study found that peak plantar pressure at the OT and M1 significantly decreased during the post-10k run, consistent with previous research findings [54,55]. This outcome may be attributed to reduced lower limb muscle strength during fatigue, specifically, the active control of distal segments (particularly the active gripping function in the toes) was reduced [56,57]. The reduction in plantar pressure at the M1 may be associated with fatigue-induced decreases in flexor digitorum and posterior tibialis muscle activity [56]. Weakness in the posterior tibialis muscle diminishes arch support, a key finding that may hold clinical significance for the development of stress reactions or stress fractures [56].
Before acknowledging findings of this study, several existing limitations should be considered. First, all participants were male recreational runners, and conclusions may not apply to females, middle-aged and elderly individuals, or participants of varying fitness levels. Second, the experiment employed a fixed running speed (12 km/h) and treadmill conditions, neglecting the impact of varying speeds and running environments (e.g., outdoor running) on biomechanical characteristics. Finally, this study focused on the running stance, without analysis of the swing phase, thus failing to incorporate symmetry parameters for assessing bilateral differences during gait cycle. Future research may expand to the entire gait cycle for the understanding of bilateral symmetry. Based on these findings, it is recommended to rationally control running volume and intensity during the training of distance run and incorporate multi-directional dynamic stretching and low-intensity resistance training to enhance joint flexibility. Simultaneously, the balanced development of bilateral lower limb muscle strength should be prioritized to optimize movement patterns, thus reducing the risk of running-related injuries.
5. Conclusion
This study examined the effect of 10k run on lower limbs biomechanics, revealing the key findings in the following aspects. 10k run would increase hip adduction-abduction and knee adduction-abduction motion while reducing dominant-side hip internal rotation and non-dominant internal-external rotation motion, suggesting reduced trunk-pelvic control. Joint moments showed side-specific adaptations, that the dominant limb demonstrated increased hip extension, abduction, and internal rotation moments with elevated ankle plantarflexion moment, suggesting the continued propulsive and load-bearing role despite reduced knee flexion. The non-dominant limb exhibited reduced hip abduction and internal rotation control. Plantar loading redistributed during post-10k run with increased MH pressure and decreased forefoot pressure during initial stance, reflecting altered foot-contact mechanics. A 10k run induced adaptations showed asymmetric movement control and reduced stability during stance phase, providing biomechanical markers for injury risk. Consequently, the development of training program should emphasize the balance of inter-limb muscular control, fatigue-state joint stability exercises, and running form optimization to improve performance and reduce injury risks.
Acknowledgments
The authors thank the valuable contribution of all the athletes who participated in this study. This study was supported by the Zhejiang Engineering Research Center for New Technologies and Applications of Helium-Free Magnetic Resonance Imaging (2024GCLX05).
Conflict of interest statement
No potential conflict of interest was reported by the author(s).