
Table 1
Demographic and anthropometric data of participants
| Variable | Mean value ± standard deviation (SD) |
|---|---|
| Age (years) | 19.8 ± 1.8 |
| Height (cm) | 179.3 ± 5.7 |
| Weight (kg) | 71.5 ± 8.9 |
| Body mass index (BMI) (kg/m²) | 22.2 ± 2.3 |
| Running experience (years) | 3.1 ± 2.0 |
| Weekly running distance (km/week) | 24.2 ± 12.7 |
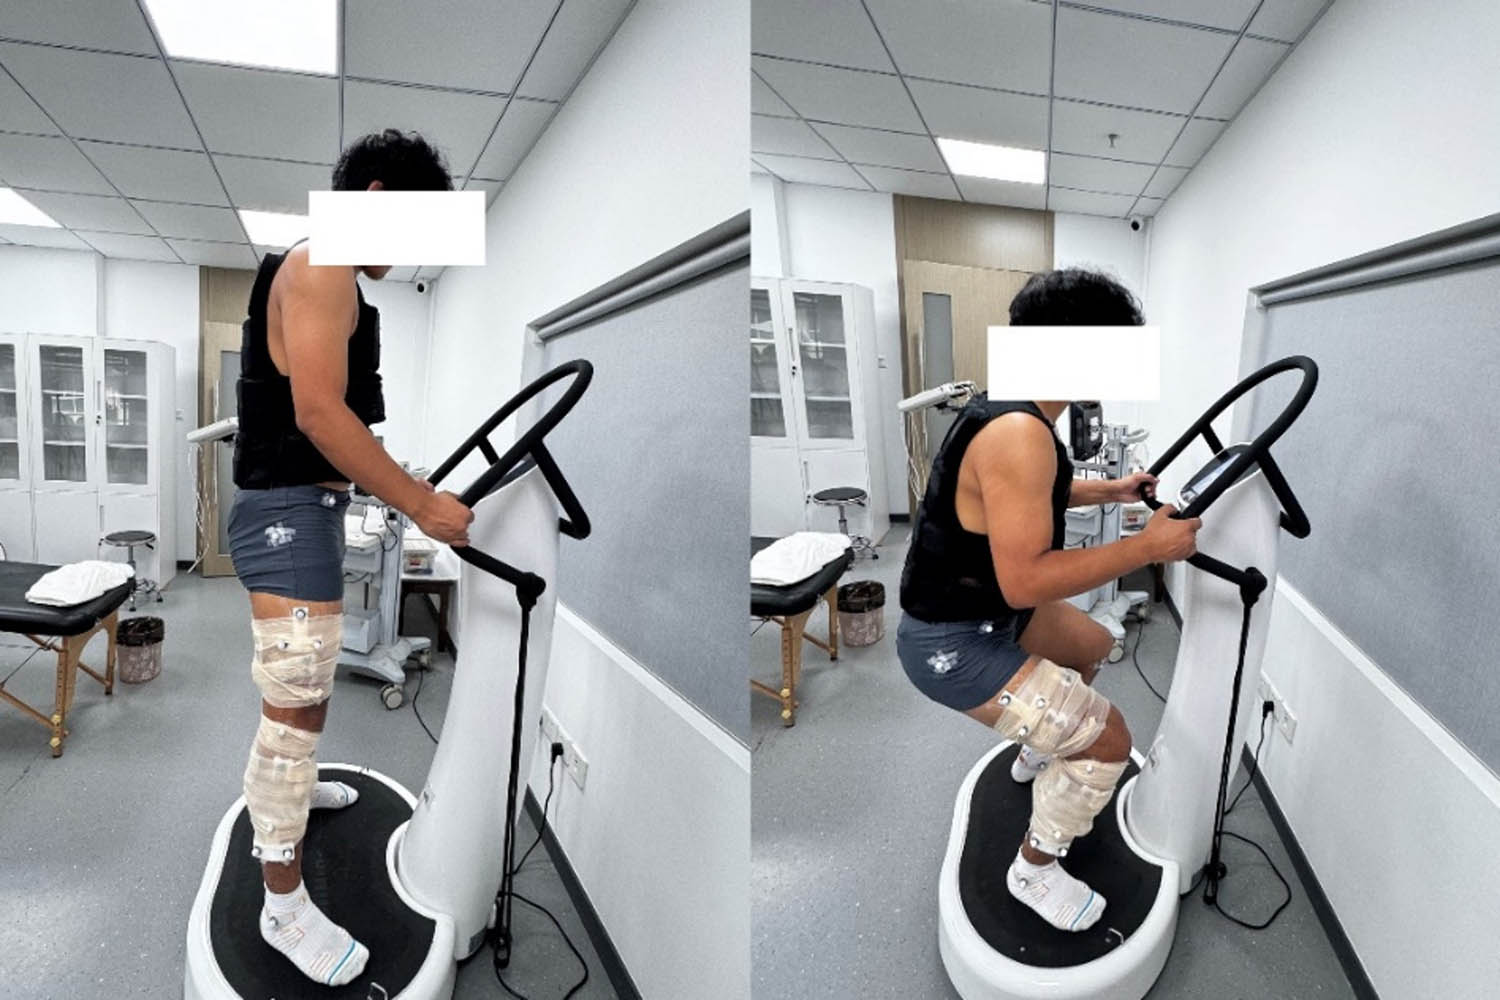
Figure 1
Loaded WBV training setup. Participant performing dynamic squats on a vertical vibration platform (20 Hz, 6 mm) while wearing a weighted vest (20% body mass).
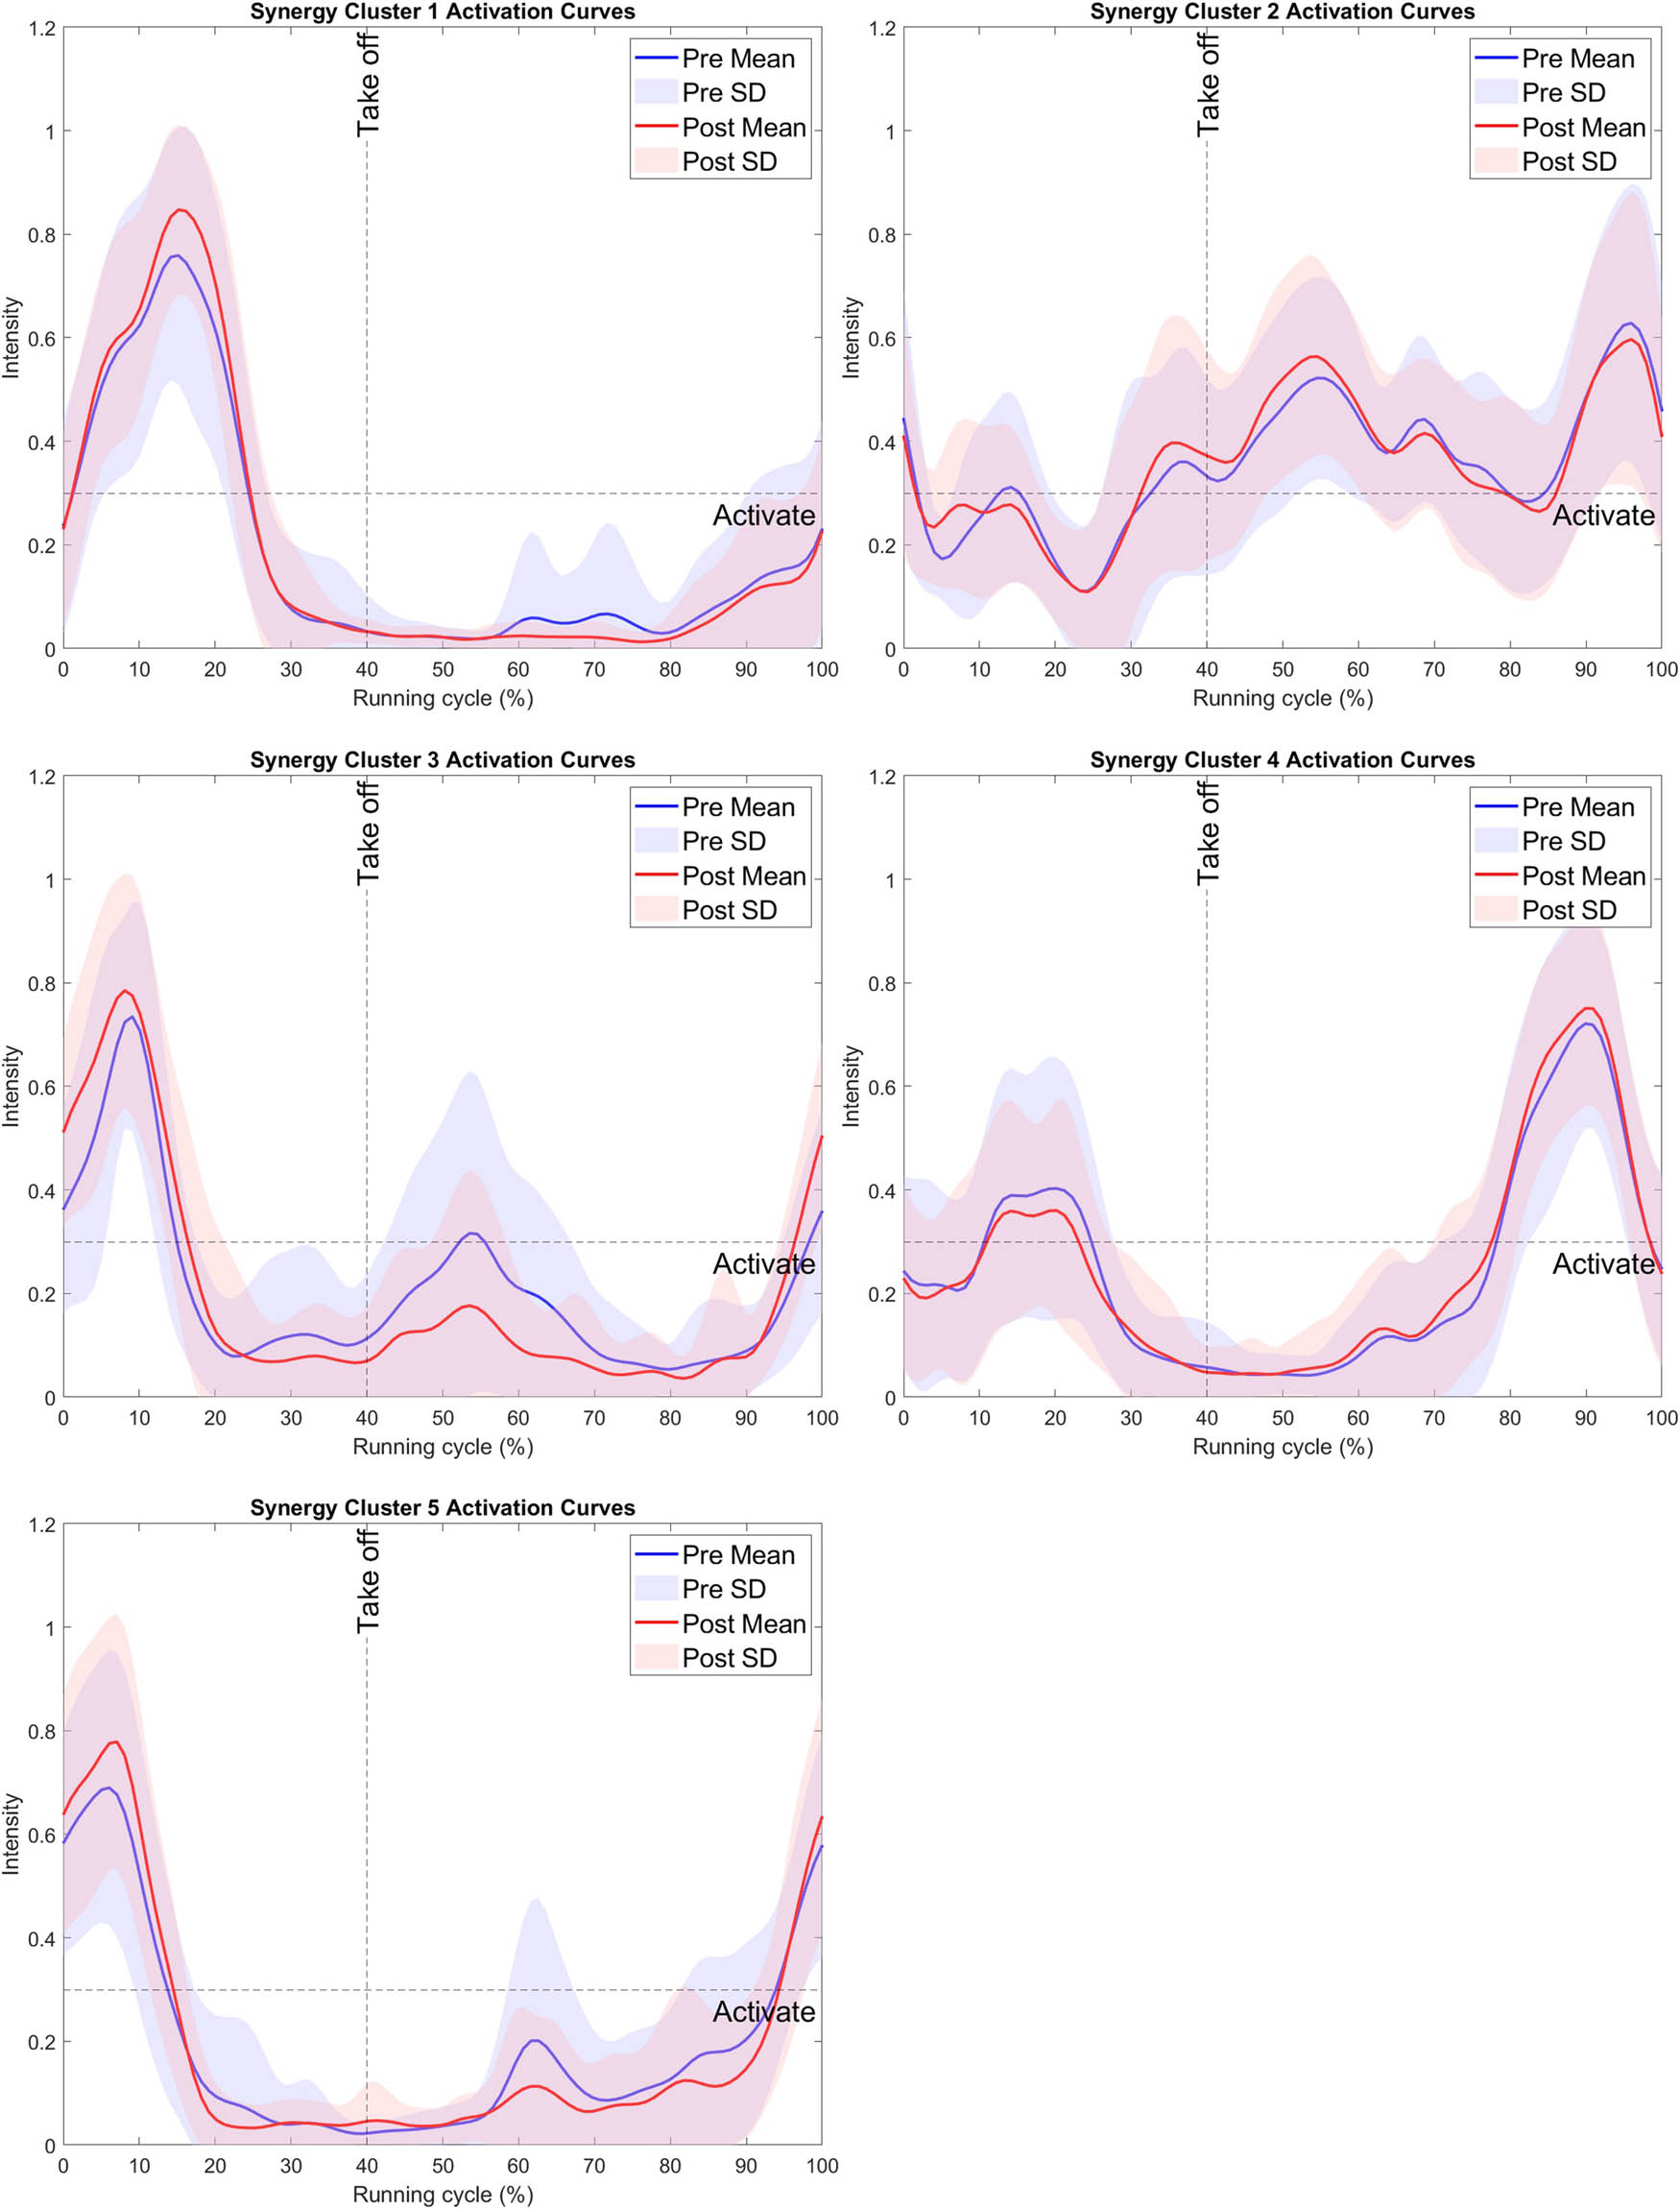
Figure 2
Time activation curves of muscle synergies (SYN1–SYN5). Blue line: pre-intervention mean; red line: post-intervention mean; shaded areas: SD; vertical dashed line: TO; horizontal dashed line: muscle synergy activation threshold (0.3).
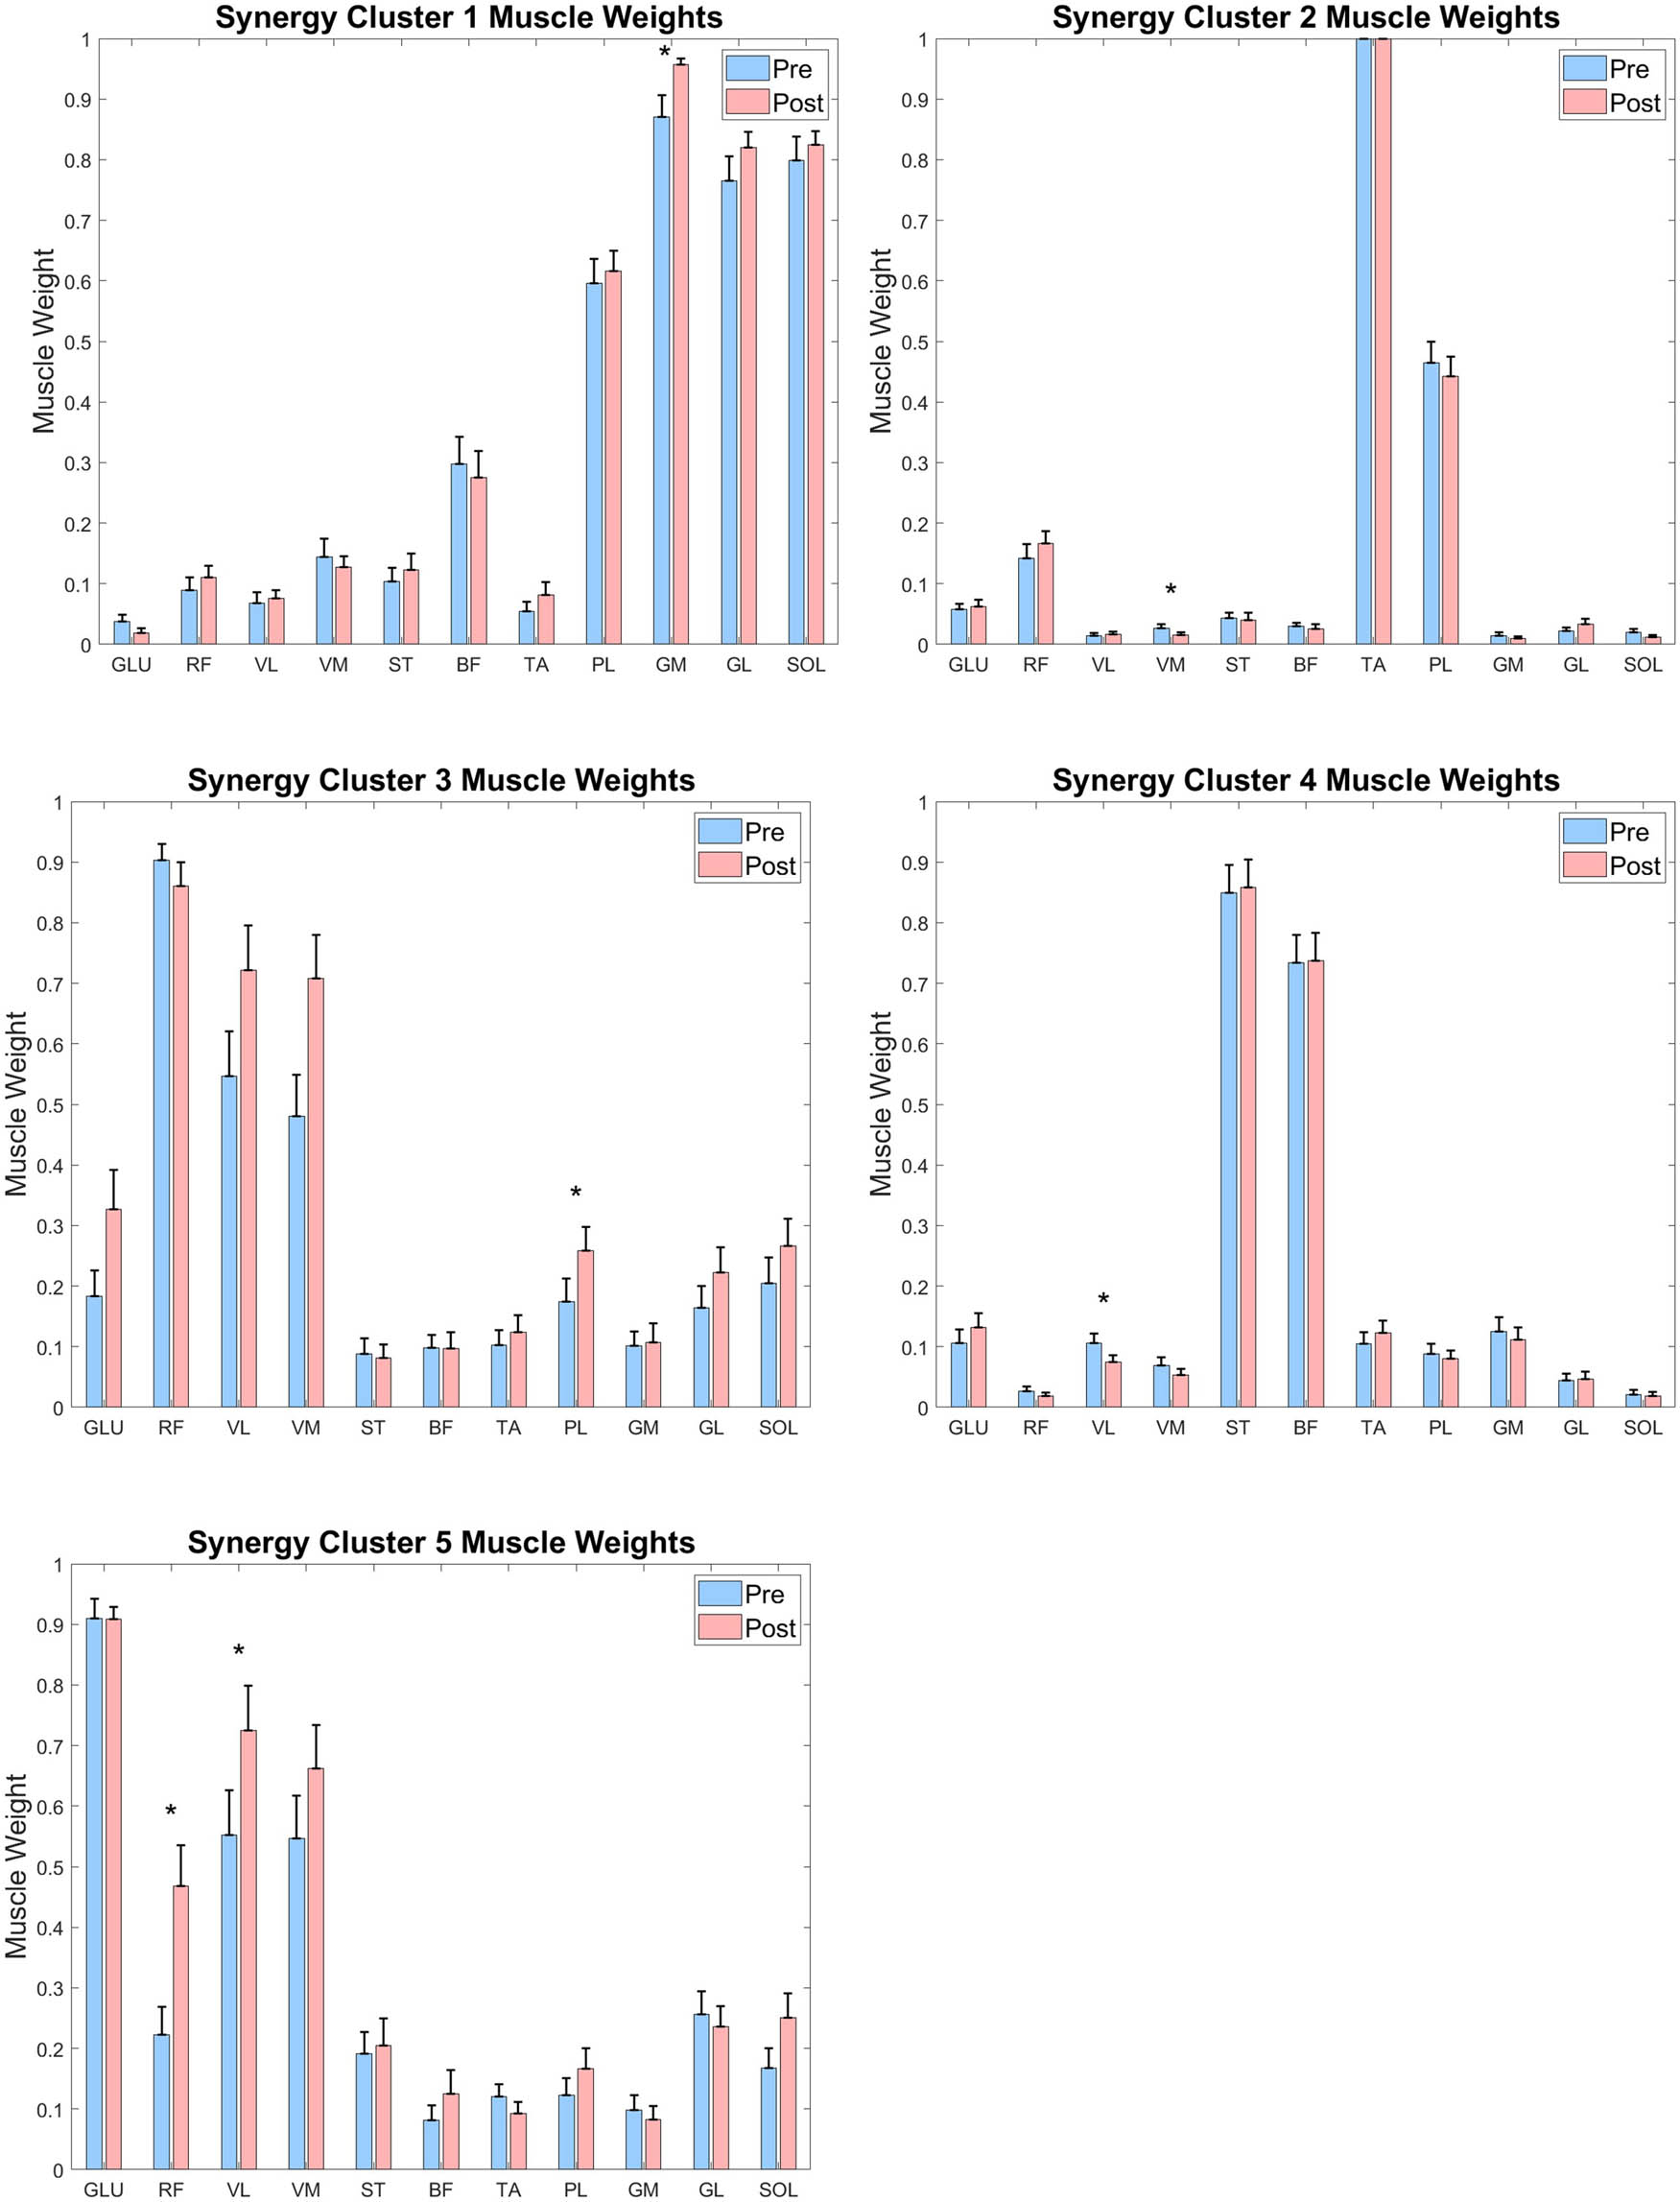
Figure 3
Distribution of muscle weightings across identified synergy patterns. *: p < 0.05; Muscle abbreviations: GLU, gluteus maximus; RF, rectus femoris; VM, vastus medialis; VL, vastus lateralis; ST, semitendinosus; BF, biceps femoris; TA, tibialis anterior; PL, peroneus longus; SOL, soleus; GM, gastrocnemius medialis; GL, gastrocnemius lateralis.
Table 2
Temporal parameters of activation curves for all synergy patterns
| Synergy | Parameter | Pre | Post | t-value/W-value | p-value | Effect size (d/r) |
|---|---|---|---|---|---|---|
| SYN1 | T | 20.07 ± 0.57 | 21.32 ± 0.40 | W = 158 | p = 0.028* | r = 0.35 |
| T start | 9.07 ± 3.21 | 4.66 ± 2.05 | W = 300.5 | p = 0.161 | r = 0.22 | |
| T stop | 29.14 ± 3.07 | 25.98 ± 1.99 | W = 380 | p = 0.666 | r = 0.07 | |
| T max | 20.64 ± 3.20 | 17.66 ± 2.03 | W = 370 | p = 0.994 | r = 0.01 | |
| SYN2 | T | 32.04 ± 2.21 | 35.46 ± 2.43 | t = −1.361 | p = 0.182 | d = 0.22 |
| T start | 47.27 ± 299 | 44.68 ± 3.24 | W = 393.5 | p = 0.525 | r = 0.10 | |
| T stop | 79.46 ± 2.55 | 80.13 ± 2.95 | W = 224 | p = 0.454 | r = 0.12 | |
| T max | 64.57 ± 3.47 | 63.22 ± 84 | W = 366 | p = 0.827 | r = 0.04 | |
| SYN3 | T | 16.86 ± 1.03 | 15.73 ± .93 | W = 171.5 | p = 0.307 | r = 0.20 |
| T start | 18.03 ± 4.13 | 8.59 ± 3.40 | W = 131 | p = 0.047* | r = 0.39 | |
| T stop | 34.89 ± 4.75 | 24.32 ± 3.53 | W = 192 | p = 0.033* | r = 0.42 | |
| T max | 26.11 ± 4.32 | 16.55 ± 3.46 | W = 221.5 | p = 0.041* | r = 0.40 | |
| SYN4 | T | 18.89 ± 0.48 | 19.79 ± 0.64 | W = 379.5 | p = 0.367 | r = 0.14 |
| T start | 67.29 ± 3.82 | 70.96 ± 2.96 | W = 519.5 | p = 0.775 | r = 0.04 | |
| T stop | 86.18 ± 3.86 | 90.75 ± 3.04 | W = 318 | p = 0.613 | r = 0.08 | |
| T max | 78.01 ± 3.89 | 82.09 ± 3.17 | W = 451.5 | p = 0.795 | r = 0.04 | |
| SYN5 | T | 14.07 ± 0.83 | 13.58 ± 0.64 | t = 0.546 | p = 0.590 | d = 0.10 |
| T start | 15.45 ± 5.54 | 11.26 ± 5.29 | W = 39 | p = 0.638 | r = 0.07 | |
| T stop | 29.52 ± 6.01 | 24.84 ± 5.33 | W = 169.5 | p = 0.850 | r = 0.04 | |
| T max | 21.81 ± 6.04 | 17.62 ± 5.62 | W = 167.5 | p = 0.893 | r = 0.03 |
Note: Values are presented as mean value ± SD (%). *: p < 0.05. Parameters: T, activation duration; T start, activation onset; T stop, activation offset; T max, time of peak activation.