
1. Introduction
Running is one of the most widely practiced forms of physical activity worldwide [1,2]. Despite its simplicity as a daily exercise, running is a complex locomotor task that requires precise multi-joint coordination, efficient shock absorption, and effective propulsion. These biomechanical demands place considerable challenges on the neuromuscular system, and deficiencies in motor control have been linked to impaired running economy and an increased risk of lower-limb injuries [3–5].
Considering the high neuromechanical demands of running and the associated injury risk, warm-up exercises are essential for optimized performance and injury prevention. Among various warm-up modalities, whole-body vibration (WBV) has gained increasing attention as a complementary strategy. Previous studies have reported that WBV can rapidly elevate muscle temperature [6], increase flexibility and muscular strength [7,8], and improve neuromuscular control [9]. Overall, these findings indicate that WBV may serve as an effective pre-running warm-up intervention for priming neuromuscular activation and enhancing movement efficiency.
Moreover, combining WBV with additional loading has been shown to further enhance its neuromuscular benefits [10]. External load application during WBV increases the mechanical demands placed on the musculoskeletal system, thereby optimizing neuromuscular activation. Compared with unloaded WBV or low-intensity resistance training, this combined strategy has been shown to elicit greater post-activation potentiation and promote the recruitment and synchronization of high-threshold motor units [11,12]. WBV combined with resistance loading has been reported to induce greater improvements in muscle strength, power, and coordination compared with WBV alone [13]. However, despite these documented benefits, the effects of loaded WBV on the coordinated organization of muscle activity, particularly muscle synergies during dynamic tasks such as running, remain unclear.
From a motor-control perspective, the activation of individual muscles alone cannot fully realize efficient running performance; rather, the coordinated recruitment of multiple muscle groups acting in synergy is crucial [14]. Aiming to account for this complexity, Bernstein introduced the concept of muscle synergies, proposing that the central nervous system (CNS) simplifies motor control through the coordination of muscle groups as functional units, thereby improving movement efficiency and stability [15]. Muscle synergy analysis offers a valuable framework for investigating neural control strategies underlying dynamic, multi-joint movements. The dimensional (number of synergies), spatial (muscle weighting patterns), and temporal (activation profiles) organization of these synergies are closely associated with movement efficiency and coordination; conversely, alterations in synergy composition or deviations in temporal activation patterns have been linked to impaired motor performance, neuromuscular dysfunction, and an increased risk of injury [16–19].
Based on the muscle synergy framework, we hypothesize that loaded WBV training will modify the spatial and temporal organization of muscle synergies during running, reflecting enhanced coordination and more efficient neuromuscular recruitment. Investigating these effects can provide valuable insights into the neural control of movement and the mechanisms by which the CNS modulates synergy activation in response to vibration-induced neuromechanical stimuli. Therefore, the aim of this study is to investigate the acute effects of loaded WBV training on muscle synergies during running.
2. Materials and methods
2.1. Participants
The required sample size was determined using G*Power 3.1.9.7 software [20]. Based on a statistical power analysis for a paired-sample t-test with an alpha level of 0.05, an effect size of 0.5, and a power of 0.8, a minimum of 34 participants was required. A total of 39 healthy male recreational runners were ultimately recruited to ensure sufficient statistical power and data reliability. Eligible participants were defined as recreational runners aged 18–30 years who had consistently run at least 15 km per week for a minimum of 6 months. The participants demonstrated a moderate training level, with a mean weekly running distance of 24.2 ± 12.7 km/week (Table 1). None of the participants had prior experience with regular WBV training. Participants with known contraindications to WBV training, such as cardiovascular disorders (e.g., coronary heart disease or uncontrolled hypertension), as well as neurological, musculoskeletal, or rheumatic conditions, were excluded. In addition, individuals with a history of lower-limb injury or surgery within the previous 6 months were not eligible to participate. All participants provided written informed consent prior to the experiment, and the study protocol was approved by the Ethics Committee of Shanghai University of Sport (Approval No. 102772024RT052).
2.2. Experimental procedure
This study employed a pre–post experimental design to examine the acute effects of loaded WBV training, performed while wearing a weighted vest, on muscle synergy patterns during running. Running biomechanical measurements were performed before and after the intervention. All participants were asked to wear standardized short compression tights and running shoes (ASICS SORTIEMAGIC RP 4, TMM467-0790, Japan) to maintain uniform testing conditions. Prior to the running trials, reflective markers and surface electromyography (sEMG) electrodes were attached to the participants following standardized placement protocols.
The treadmill speed was set at 3.3 m/s, a widely adopted velocity in previous biomechanical studies of running [21,22]. After gradually accelerating to the target speed, participants ran for 1 min at a steady state, during which kinematic, kinetic, and sEMG data were continuously collected. Each participant completed three valid running trials under pre- and post-intervention conditions. A valid trial was defined as the successful acquisition of complete and artifact-free biomechanical and sEMG data.
For the intervention, participants were asked to wear a weighted vest equivalent to 20% of their body mass and performed WBV training on a vertical sinusoidal vibration platform (FL-T80, Frosino, Guangdong, China). Based on previous findings using the same platform, the vibration parameters were set at 20 Hz and 6 mm, indicating that these settings effectively enhanced neuromuscular activation [23]. The training session comprised ten sets of dynamic squats, each lasting 60 s, with 60 s of passive rest between sets [24,25]. The squat tempo was standardized using a metronome set at 60 bpm/min, with 2 s allocated to the eccentric phase (descent) and 2 s to the concentric (ascent) phase. Participants were then instructed to adopt a standardized squat posture: avoid excessive forward knee displacement, maintain approximately 90° knee flexion, and lightly hold the side handles of the platform for balance without relying on upper-body support, while keeping their gaze directed forward. All training was performed without shoes to optimize vibration transmission and minimize the damping effects of shoe soles. Aiming to ensure correct and consistent performance, the intervention was continuously supervised by qualified researchers (Figure 1).
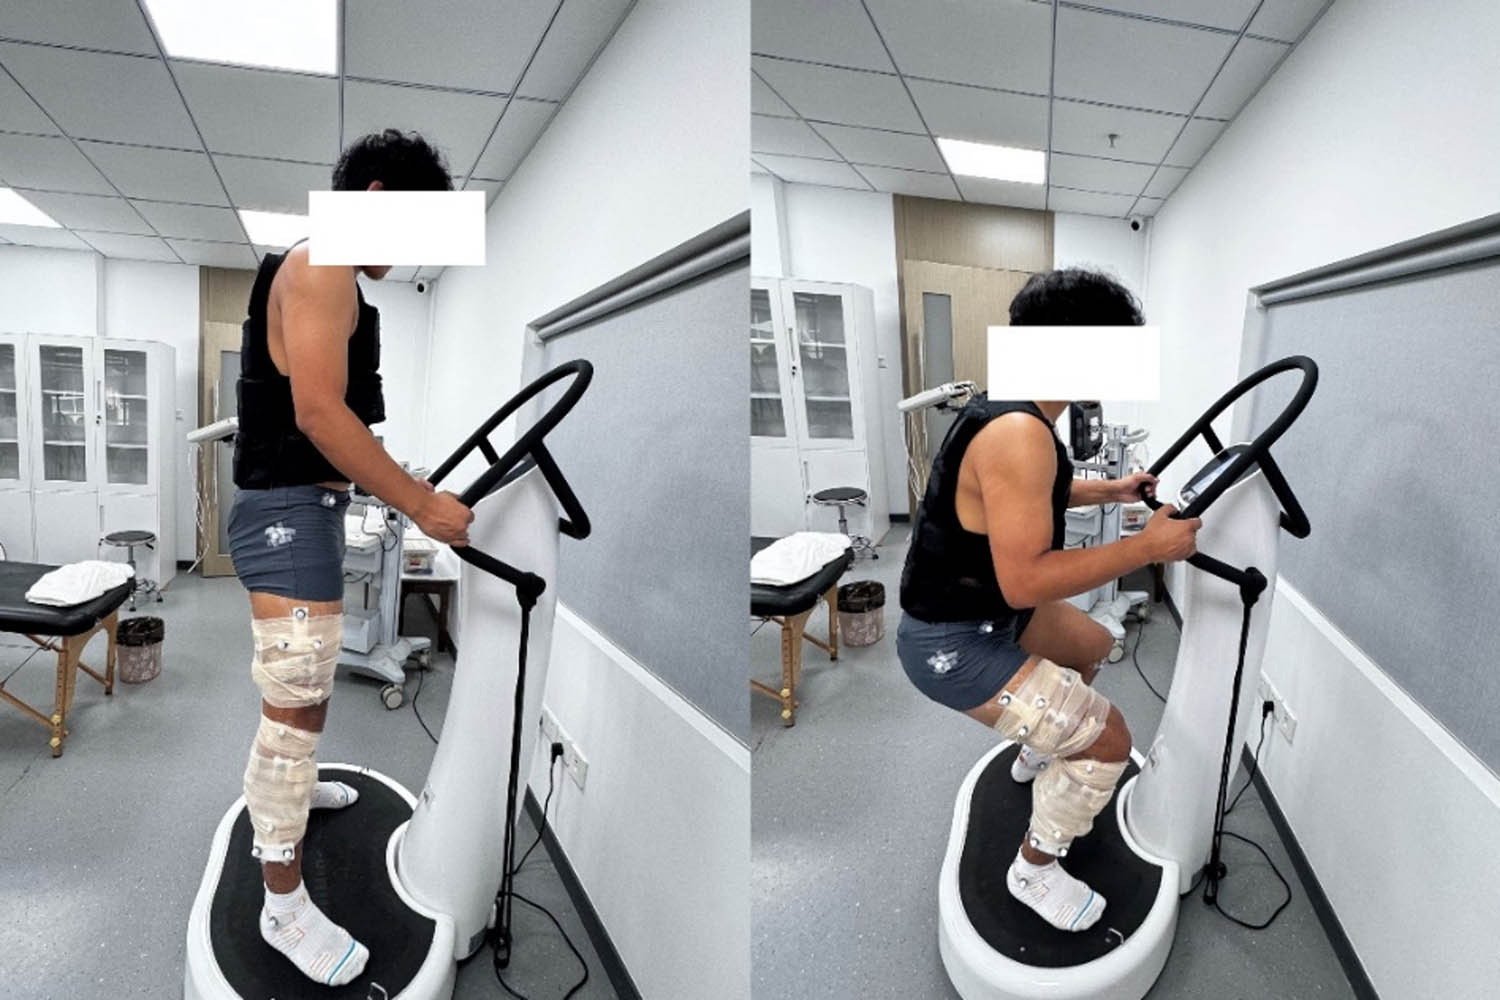
Figure 1
Loaded WBV training setup. Participant performing dynamic squats on a vertical vibration platform (20 Hz, 6 mm) while wearing a weighted vest (20% body mass).
After the intervention, participants rested in a seated position for 5 min to minimize potential fatigue. Subsequently, post-intervention running tests were conducted using the same procedures as in the pre-test.
2.3. Data acquisition
2.3.1. Kinematic and kinetic data acquisition
A 10-camera infrared motion capture system (Qualisys AB, Göteborg, Sweden; 200 Hz) synchronized with an instrumented treadmill equipped with dual force plates (Bertec Corporation, Columbus, OH, USA; 1,000 Hz) was used to collect kinematic and kinetic data. The recorded data were primarily utilized to identify initial contact (IC) and toe-off (TO) events, subsequently facilitating cycle segmentation and synchronization of the sEMG signals. A total of 36 reflective markers (14 mm in diameter) were attached based on the Plug-in Gait marker placement protocol, aiming to capture lower-limb segment motion. Markers were affixed to the following anatomical landmarks: the iliac crest, anterior and posterior superior iliac spines, greater trochanter, medial and lateral femoral epicondyles, medial and lateral malleoli, first and fifth metatarsal heads, toe, and heel. Additionally, 12 reflective markers (three on the thigh and three on the shank of each leg) were arranged in a T-shaped pattern, ensuring accurate tracking of lower-limb segment motion.
2.3.2. sEMG data acquisition
Using a wireless acquisition system (Ultium, Noraxon USA Inc., Scottsdale, AZ, USA), sEMG signals from the lower limbs were recorded during running. sEMG data were acquired from 11 muscles of the dominant leg (defined as the leg preferentially used for kicking) at 2,000 Hz. The recorded muscles included the following: gluteus maximus, rectus femoris, vastus medialis, vastus lateralis, semitendinosus, biceps femoris, tibialis anterior, peroneus longus, soleus, gastrocnemius medialis, and gastrocnemius lateralis. Before electrode placement, the skin was shaved, abraded, and cleaned with alcohol, thereby minimizing impedance. Bipolar Ag/AgCl surface electrodes were positioned over each muscle belly following the SENIAM guidelines [26].
2.4. Data processing and analysis
2.4.1. Running cycle detection
Vertical ground reaction force (vGRF) data were used to identify gait events during the running cycle, including IC and TO. A percentage-based method was adopted based on previous studies using relative thresholds [27,28]. Due to early-contact fluctuations and residual pre-take-off signals observed in our measurements, the thresholds were adjusted for our dataset. Final thresholds of 25% and 20% of peak vGRF were applied for IC and TO, respectively, and the thresholds were validated against raw data in Visual3D software to ensure accurate identification of IC and TO events for each participant. Each running cycle was defined as the interval between two consecutive ICs and was time-normalized to 101 data points, corresponding to 0–100% of the running cycle. For each participant, 10 consecutive running cycles from the middle of the trial were examined to ensure data stability, and the mean and standard deviation were then calculated. The final analysis of each condition included the averaged data from three valid trials.
2.4.2. sEMG signal processing
Artifacts and outliers in the raw sEMG signals were first detected using a z-score criterion, where values exceeding ±3 standard deviations from the mean were classified as outliers and replaced using linear interpolation. The signals were then processed using a fourth-order Butterworth bandpass filter (10–500 Hz) to reduce motion artifacts, followed by full-wave rectification. A low-pass Butterworth filter with a cutoff frequency of 6 Hz was subsequently applied to obtain smoothed linear envelopes. Finally, the processed signals from each muscle were normalized to their respective maximum activation levels recorded throughout the trial. This within-trial peak normalization was selected because running involves large, rapid changes in muscle activation across the running cycle, providing a representative reference for comparing relative muscle activity within and across participants.
2.4.3. Muscle synergy analysis
Aiming to further investigate the underlying neural mechanisms for efficient control during multi-joint locomotor tasks, the high-dimensional sEMG dataset was reduced to a low-dimensional representation based on muscle synergy analysis. Nonnegative matrix factorization (NMF) was employed to decompose the normalized data from 10 running cycles into an m × t data matrix (where m is the number of muscles and t is the number of time points), which was then factorized into two nonnegative matrices, W and C, according to the following equation [29]:
where EMG represents the normalized sEMG matrix, W (of dimension m × n) is the spatial structure of each synergy, indicating the relative weight of each muscle within a given synergy, while C. (of dimension n × t) denotes the temporal activation pattern of each synergy throughout the running cycle. Eleven muscles were included in the analysis; thus, the number of extracted synergies (n) was systematically varied from 1 to 11, covering all possible combinations. For each condition and each n value, NMF decomposition was repeated 25 times, and the most reproducible solution (i.e., the pair of W and C matrices) was retained for subsequent analysis.The reconstruction quality of the synergy model was evaluated using the variance accounted for (VAF) criterion. The optimal number of synergies was represented as the smallest number for which the cumulative VAF exceeded 90% [30,31]. The VAF was calculated as follows [32]:
where V denotes the original EMG matrix, and V′ pertains to the reconstructed matrix obtained from the synergy model.After synergy extraction, all synergy vectors obtained from individual participants were combined and subjected to k-means clustering to identify common synergy patterns. Aiming to ensure the stability of clustering outcomes, the k-means algorithm was configured using a maximum of 1,000 iterations and repeated 100 times, thereby reducing the influence of random initial centroids.
Following clustering, post-intervention synergy vectors were then reassigned to the pre-intervention cluster centroids according to their similarity, which were quantified using Pearson’s correlation coefficient (r). The distance metric 1 − r was used to measure dissimilarity, and each post-intervention vector was assigned to the cluster with the highest correlation. This procedure facilitated direct assessment of structural similarity in muscle synergies between pre- and post-intervention conditions.
The main synergy-related parameters included the number of synergies, muscle weights, and activation curves. The number of synergies pertains to the minimal set of control modules required by the CNS to coordinate complex motor tasks under each experimental condition. Muscle weights denote the relative contribution of each muscle within a given synergy, thereby reflecting the spatial organization of the synergy structure. Activation curves characterize the temporal evolution of each synergy throughout the normalized running cycle, providing insights into the sequential recruitment of control modules and the temporal dynamics of neural control strategies. The temporal characteristics of synergy activation were further quantified using the activation curves of each synergy cluster across the normalized running cycle. Specifically, the onset time (T start) was defined as the first time point at which the activation curve exceeded a threshold of 0.3, while the offset time (T stop) corresponded to the point at which the curve fell below 0.3 and remained below that level. The activation duration (T) corresponded to the temporal interval between T start and T stop, and the time to peak (T max) was the time point corresponding to the maximum activation amplitude within the cycle.
2.5. Statistical analysis
All statistical analyses were conducted using MATLAB (R2023b; MathWorks, Natick, MA, USA). Paired-sample t-tests and Wilcoxon signed-rank tests for normally and non-normally distributed data, respectively, were used in pre- and post-intervention comparisons of muscle weightings and temporal activation parameters (T start, T stop, T, and T max). Normality was assessed using the Lilliefors test. All statistical significance was set at α = 0.05.
3. Results
3.1. Muscle synergy patterns
Based on the entire running cycle, five distinct synergy clusters (SYN1–SYN5) were identified, each demonstrating unique temporal activation profiles corresponding to specific functional phases of running. SYN1 was primarily activated during the propulsion phase, contributing to forward and upward acceleration. SYN2 corresponded to the late stance and swing transition, facilitating ankle dorsiflexion and limb advancement. SYN3 was active during the weight acceptance phase, supporting shock absorption and lower-limb stabilization. SYN4 mainly occurred during the late swing phase, contributing to leg deceleration and preparation for ground contact. SYN5 also occurred during the weight acceptance phase, thereby enhancing hip and knee joint stability at IC (Figure 2).
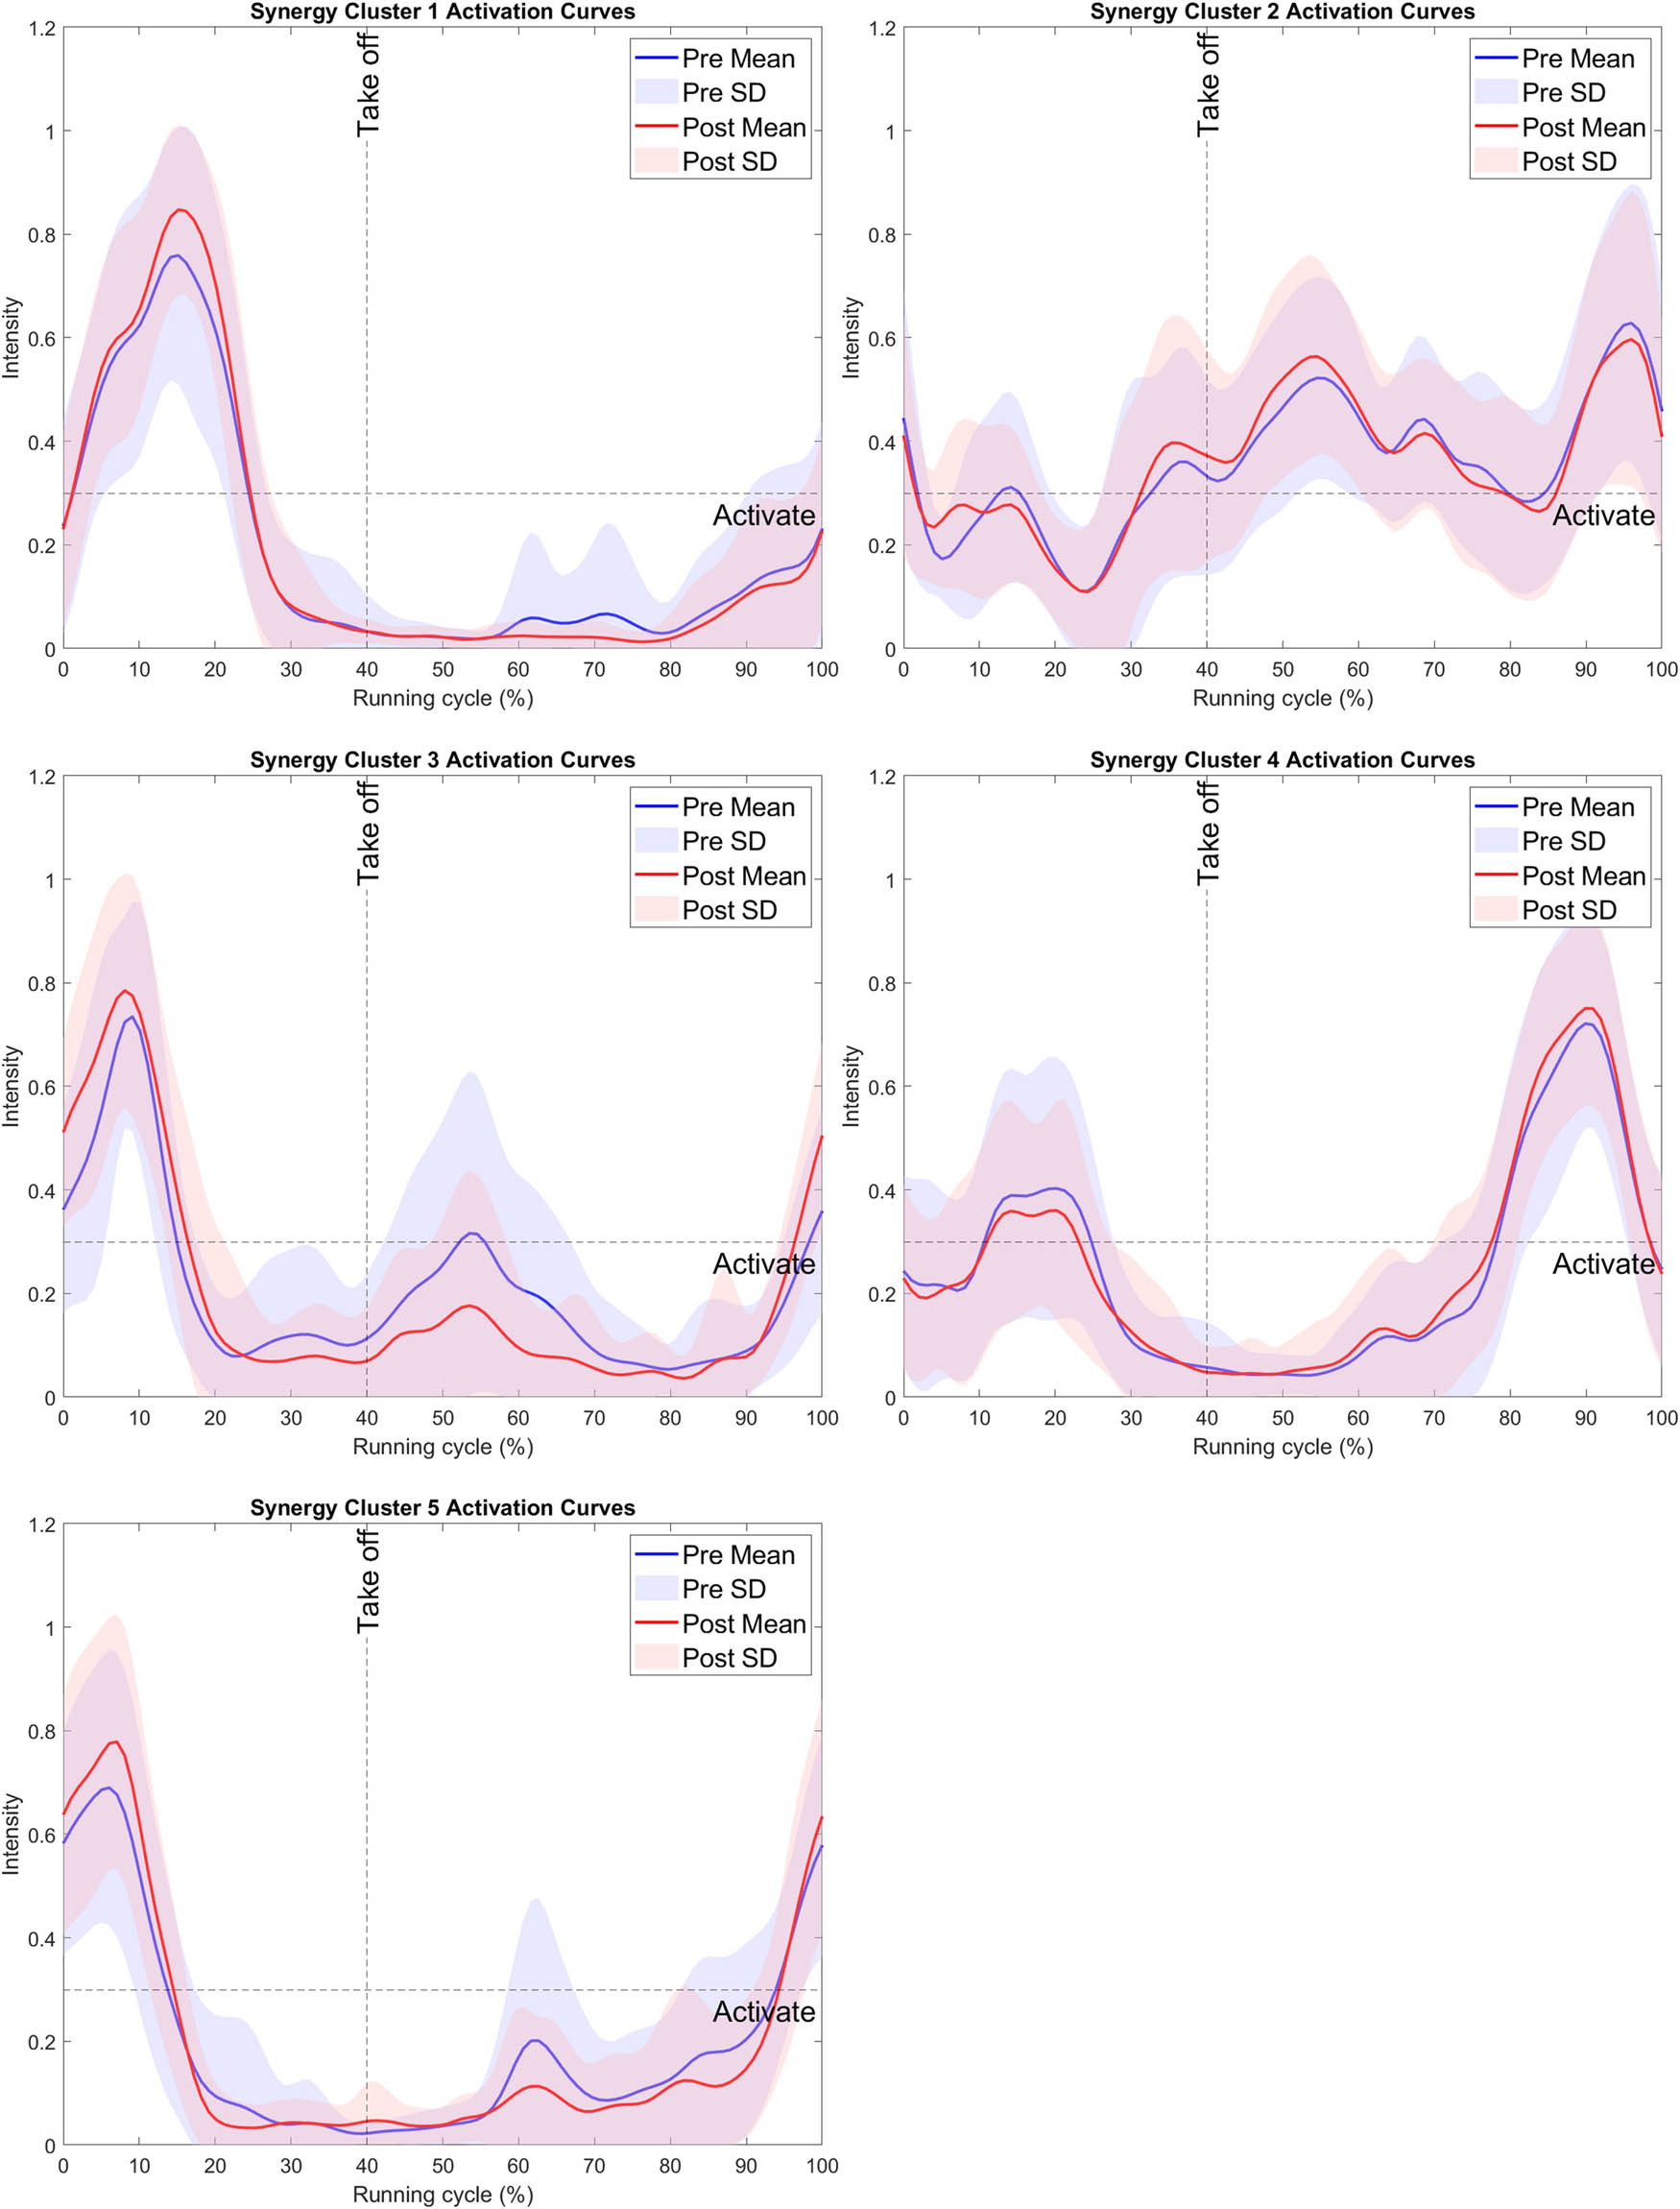
Figure 2
Time activation curves of muscle synergies (SYN1–SYN5). Blue line: pre-intervention mean; red line: post-intervention mean; shaded areas: SD; vertical dashed line: TO; horizontal dashed line: muscle synergy activation threshold (0.3).
3.2. Muscle weights
The gastrocnemius medialis, gastrocnemius lateralis, and soleus were the primary contributing muscles within SYN1. Among them, only the gastrocnemius medialis showed a statistically significant increase, from 87.08 ± 3.52% before the intervention to 95.68 ± 0.99% after the intervention (p = 0.036, r = 0.34). The gastrocnemius lateralis and soleus also showed increases (76.54 ± 3.98% → 82.01 ± 2.59% and 79.88 ± 3.90% → 82.46 ± 2.28%, respectively), but these changes did not reach statistical significance (Figure 3 and Supplementary Table S1).
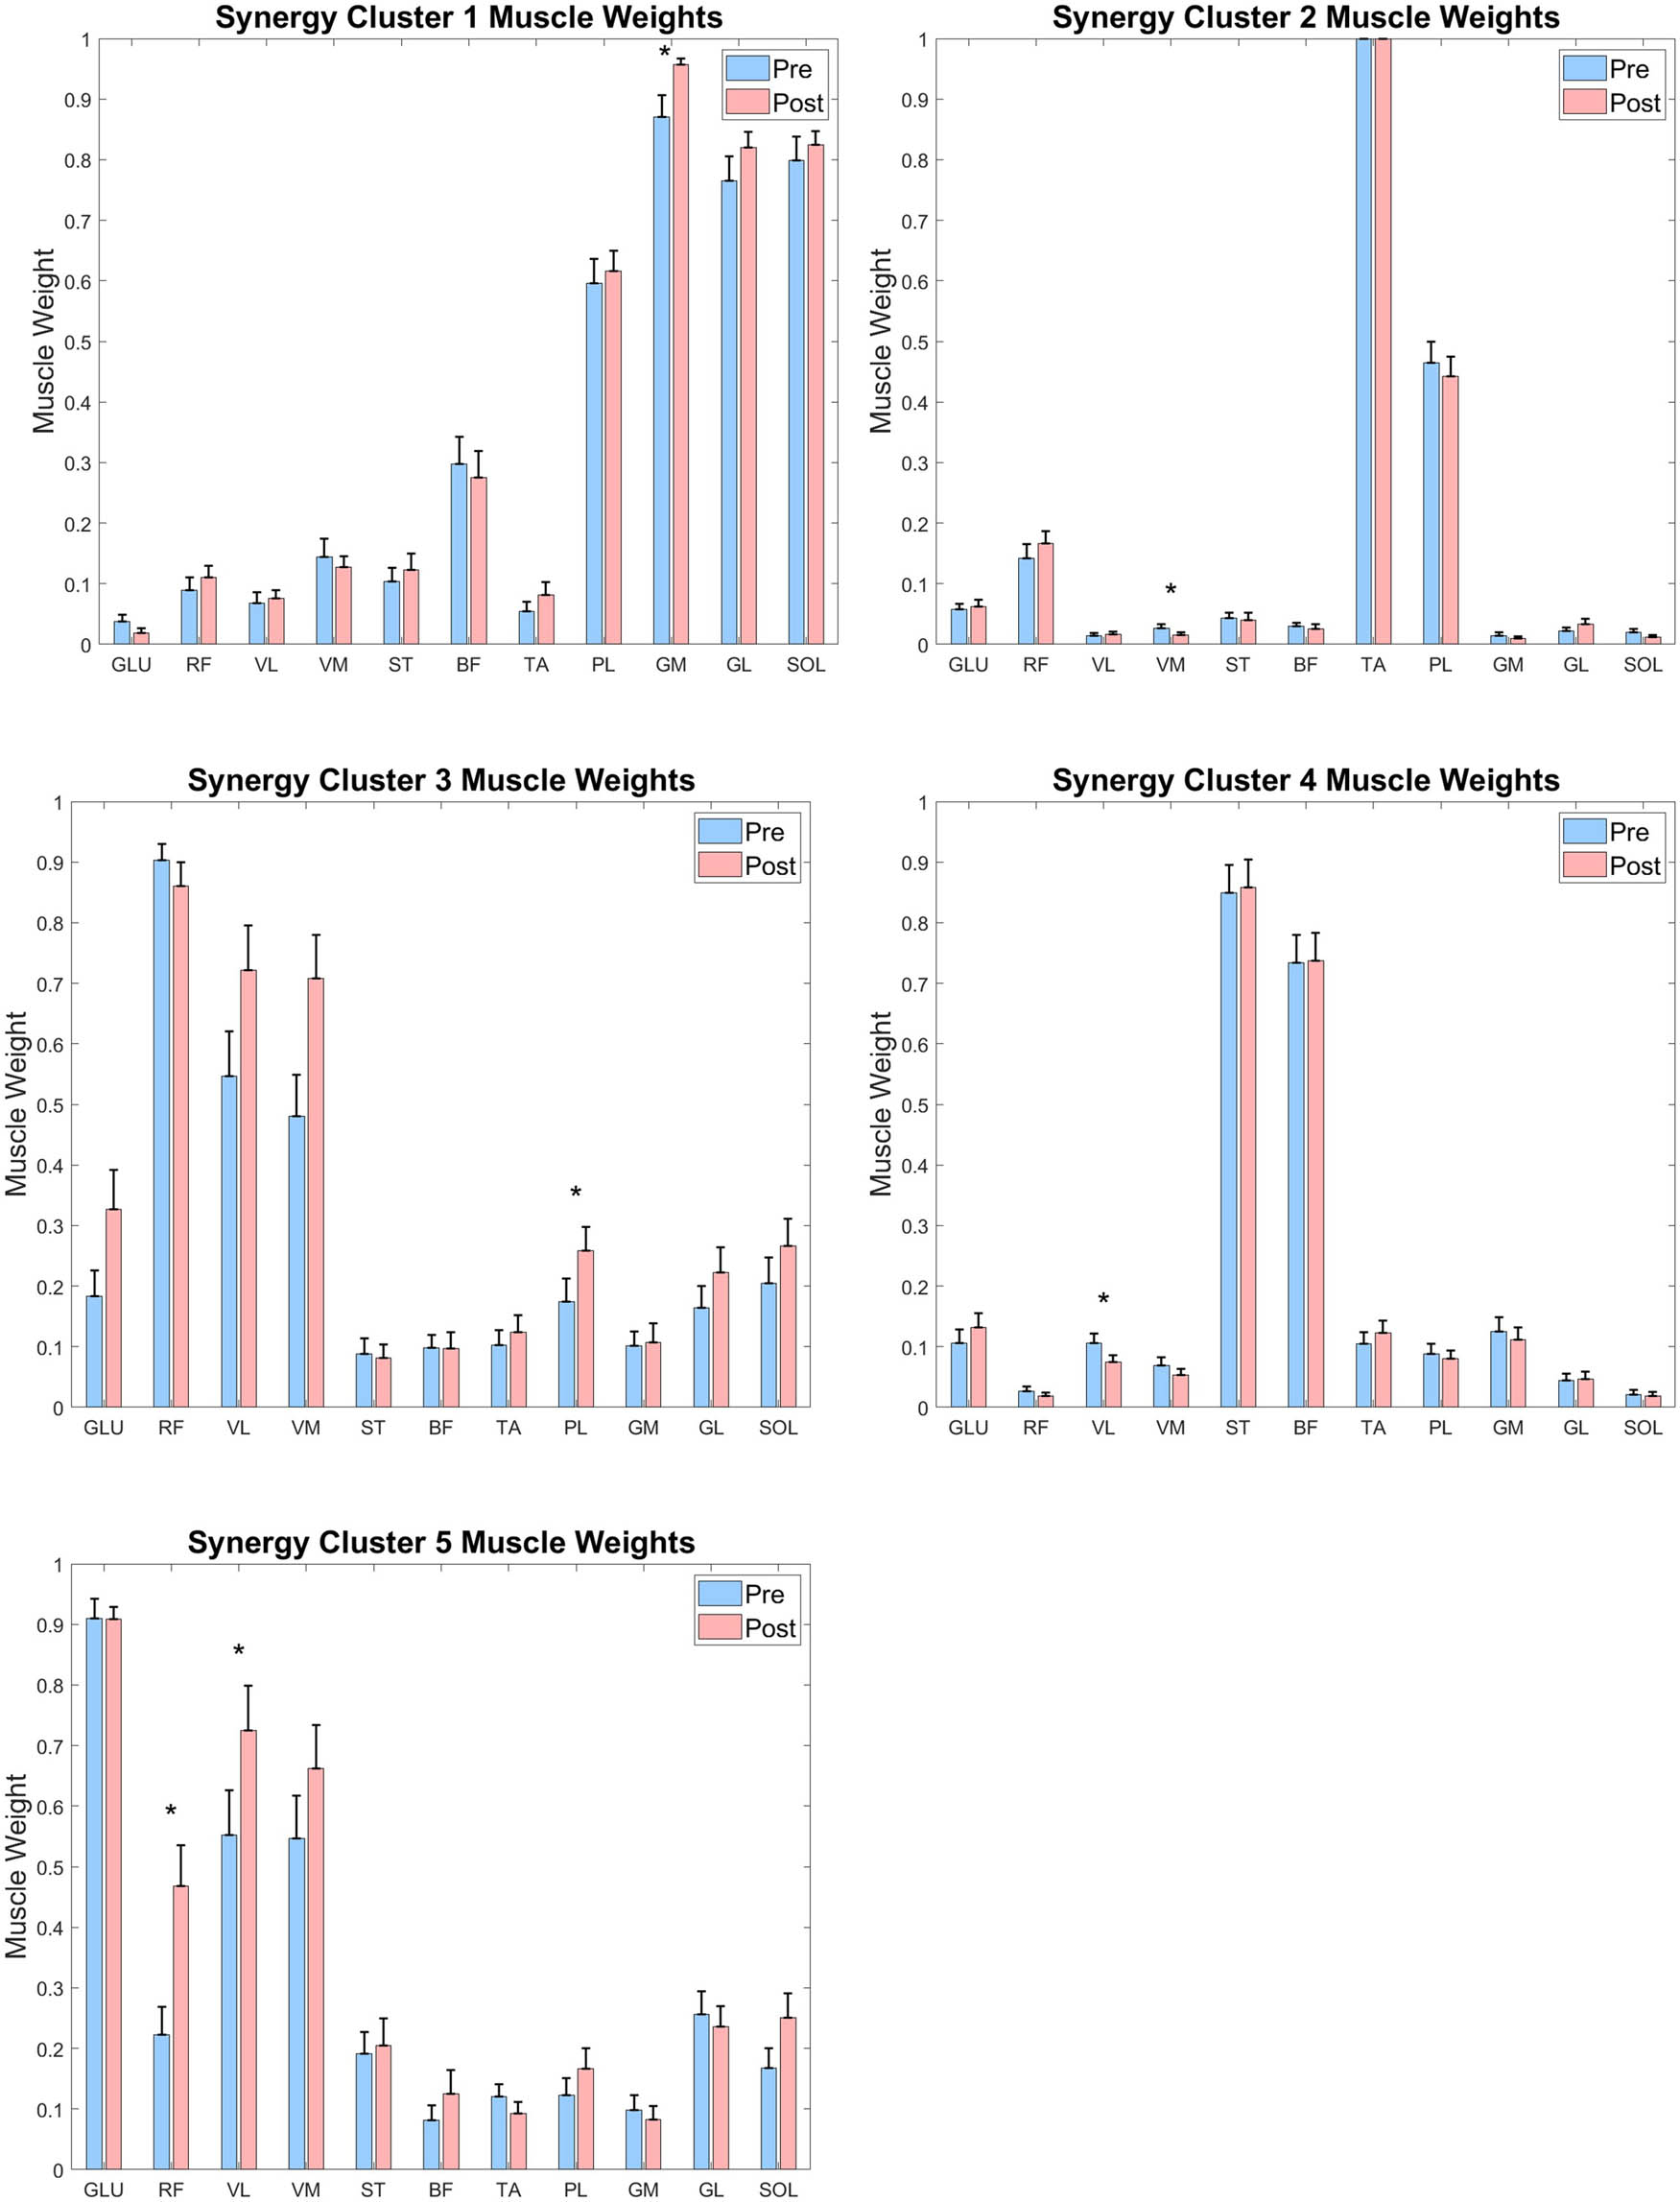
Figure 3
Distribution of muscle weightings across identified synergy patterns. *: p < 0.05; Muscle abbreviations: GLU, gluteus maximus; RF, rectus femoris; VM, vastus medialis; VL, vastus lateralis; ST, semitendinosus; BF, biceps femoris; TA, tibialis anterior; PL, peroneus longus; SOL, soleus; GM, gastrocnemius medialis; GL, gastrocnemius lateralis.
SYN2 was primarily characterized by strong contributions from the tibialis anterior and peroneus longus, both of which exhibited the highest synergy weightings in both conditions without significant pre-post differences. Conversely, the weighting of the vastus medialis showed a significant decrease after the intervention (from 2.69 ± 0.57% to 1.54 ± 0.46%, p = 0.013, r = 0.40) (Figure 3 and Supplementary Table S2).
SYN3 mainly comprised the rectus femoris, vastus lateralis, and vastus medialis, revealing moderate contributions from the gluteus maximus. None of these major muscles exhibited substantial differences between pre- and post-intervention conditions. However, the peroneus longus demonstrated a notable increase in muscle weighting, rising from 17.38 ± 3.89% to 25.87 ± 3.92% (p = 0.045, r = 0.39) (Figure 3 and Supplementary Table S3).
SYN4 was primarily dominated by the semitendinosus and biceps femoris, both revealing the absence of considerable changes after the intervention. In contrast, the weighting of the vastus lateralis significantly decreased from 10.58 ± 1.55% to 7.47 ± 1.11% (p = 0.031, r = 0.33) (Figure 3 and Supplementary Table S4).
SYN5 was characterized by dominant contributions from the gluteus maximus, rectus femoris, vastus lateralis, and vastus medialis. The weighting of the gluteus maximus remained stable (90.97 ± 3.24% pre-intervention vs 90.88 ± 2.03% post-intervention). The vastus medialis showed an increase from 54.69 ± 7.05% to 66.25 ± 7.10%; however, this change did not reach statistical significance. In contrast, the rectus femoris exhibited a significant increase from 22.27 ± 4.60% to 46.84 ± 6.66% (p = 0.007, r = 0.52), and the vastus lateralis also increased significantly from 55.20 ± 7.41% to 72.46 ± 7.47% (p = 0.049, r = 0.38) (Figure 3 and Supplementary Table S5).
3.3. Temporal parameters of activation curves
Following the intervention, SYN1 exhibited a significant increase in activation duration (p = 0.028, r = 0.35). The onset time, offset time, and peak time all shifted slightly earlier; however, none of these changes reached statistical significance.
SYN2 revealed no significant pre-post changes in any temporal parameter. Activation duration increased from 32.04 ± 2.21% to 35.46 ± 2.43%, onset time advanced from 47.27 ± 2.99% to 44.68 ± 3.24%, offset time was delayed from 79.46 ± 2.55% to 80.13 ± 2.95%, and peak activation shifted marginally earlier from 64.57 ± 3.47% to 63.22 ± 2.84%. These changes were all insignificant.
Conversely, SYN3 exhibited several notable changes in temporal parameters. Despite the slight reduction in activation duration from 16.86 ± 1.03% to 15.73 ± 0.93%, the difference remained insignificant. Onset time advanced significantly from 18.03 ± 4.13% to 8.59 ± 3.40% (p = 0.047, r = 0.39), offset time was significantly earlier (34.89 ± 4.75% → 24.32 ± 3.53%, p = 0.033, r = 0.42), and peak activation shifted significantly from 26.11 ± 4.32% to 16.55 ± 3.46% (p = 0.041, r = 0.40).
No significant changes were observed for SYN4. Activation duration slightly increased, onset and offset times were delayed, and peak activation was also delayed. However, all differences were insignificant.
Similarly, SYN5 showed no significant pre-post differences. Activation duration decreased slightly, onset time advanced, offset time shifted earlier, and peak activation occurred earlier; however, none of these changes reached statistical significance (Table 2).
Table 2
Temporal parameters of activation curves for all synergy patterns
| Synergy | Parameter | Pre | Post | t-value/W-value | p-value | Effect size (d/r) |
|---|---|---|---|---|---|---|
| SYN1 | T | 20.07 ± 0.57 | 21.32 ± 0.40 | W = 158 | p = 0.028* | r = 0.35 |
| T start | 9.07 ± 3.21 | 4.66 ± 2.05 | W = 300.5 | p = 0.161 | r = 0.22 | |
| T stop | 29.14 ± 3.07 | 25.98 ± 1.99 | W = 380 | p = 0.666 | r = 0.07 | |
| T max | 20.64 ± 3.20 | 17.66 ± 2.03 | W = 370 | p = 0.994 | r = 0.01 | |
| SYN2 | T | 32.04 ± 2.21 | 35.46 ± 2.43 | t = −1.361 | p = 0.182 | d = 0.22 |
| T start | 47.27 ± 299 | 44.68 ± 3.24 | W = 393.5 | p = 0.525 | r = 0.10 | |
| T stop | 79.46 ± 2.55 | 80.13 ± 2.95 | W = 224 | p = 0.454 | r = 0.12 | |
| T max | 64.57 ± 3.47 | 63.22 ± 84 | W = 366 | p = 0.827 | r = 0.04 | |
| SYN3 | T | 16.86 ± 1.03 | 15.73 ± .93 | W = 171.5 | p = 0.307 | r = 0.20 |
| T start | 18.03 ± 4.13 | 8.59 ± 3.40 | W = 131 | p = 0.047* | r = 0.39 | |
| T stop | 34.89 ± 4.75 | 24.32 ± 3.53 | W = 192 | p = 0.033* | r = 0.42 | |
| T max | 26.11 ± 4.32 | 16.55 ± 3.46 | W = 221.5 | p = 0.041* | r = 0.40 | |
| SYN4 | T | 18.89 ± 0.48 | 19.79 ± 0.64 | W = 379.5 | p = 0.367 | r = 0.14 |
| T start | 67.29 ± 3.82 | 70.96 ± 2.96 | W = 519.5 | p = 0.775 | r = 0.04 | |
| T stop | 86.18 ± 3.86 | 90.75 ± 3.04 | W = 318 | p = 0.613 | r = 0.08 | |
| T max | 78.01 ± 3.89 | 82.09 ± 3.17 | W = 451.5 | p = 0.795 | r = 0.04 | |
| SYN5 | T | 14.07 ± 0.83 | 13.58 ± 0.64 | t = 0.546 | p = 0.590 | d = 0.10 |
| T start | 15.45 ± 5.54 | 11.26 ± 5.29 | W = 39 | p = 0.638 | r = 0.07 | |
| T stop | 29.52 ± 6.01 | 24.84 ± 5.33 | W = 169.5 | p = 0.850 | r = 0.04 | |
| T max | 21.81 ± 6.04 | 17.62 ± 5.62 | W = 167.5 | p = 0.893 | r = 0.03 |
Note: Values are presented as mean value ± SD (%). *: p < 0.05. Parameters: T, activation duration; T start, activation onset; T stop, activation offset; T max, time of peak activation.
4. Discussion
To the best of the authors’ knowledge, this study is the first to examine the effects of loaded WBV training on muscle synergy organization during running, providing novel insights into the underlying neural mechanisms for vibration-induced neuromuscular modulation. The findings mainly demonstrated that a single session of loaded WBV training induced measurable reorganization in the spatial and temporal aspects of synergy structures. Notable increases in the muscle weightings of the gastrocnemius medialis, rectus femoris, and vastus lateralis, as well as prolonged activation duration and earlier onset, offset, and peak activation of specific synergy modules, indicated enhanced recruitment and coordination of key propulsive and stabilizing muscles.
Using the sEMG signals of 11 lower-limb muscles, 5 representative muscle synergy patterns were extracted before and after the intervention. The number of synergies identified in this study aligns well with previous studies. Lagos-Hausheer et al. [33] demonstrated that 5 synergies could account for the coordination of 14 lower-limb muscles during running. Similarly, Saito et al. [34] reported that four to five synergies could help explain the primary features of ten sEMG activation patterns under different running conditions. Cappellini et al. [35] analyzed 32 muscles, including upper and lower limbs. They found that five stable synergy modules consistently represented running patterns regardless of running speed. Similarly, Santuz et al. [36] showed that running could be explained by 5 muscle synergies derived from 24 muscles.
The present results revealed five fundamental synergy modules with comparable spatial structures before and after loaded WBV intervention, reflecting the functional motor control characteristics corresponding to the key phases of the running cycle. Across the running cycle, the five extracted synergies indicated distinct functional modules that corresponded to the major running phases. SYN1 primarily corresponded to the propulsion phase, characterized by high contributions from the peroneus longus, gastrocnemius medialis, gastrocnemius lateralis, and soleus, collectively generating powerful ankle plantarflexion to propel the body forward. SYN2, activated during the late stance to early swing transition, was dominated by the tibialis anterior and assisted by the peroneus longus, facilitating ankle dorsiflexion and supporting ankle stabilization. SYN3, driven by the quadriceps group (rectus femoris, vastus medialis, and vastus lateralis) to absorb impact forces and stabilize the lower limb, was mainly engaged during landing preparation and the initial loading response. SYN4, primarily involving the semitendinosus and biceps femoris, was activated during late swing and the terminal propulsion phase. This synergy regulated knee flexion and hip extension, thereby slowing down leg swing and preparing for the subsequent ground contact. Finally, SYN5, characterized by the coactivation of the gluteus maximus with the quadriceps group, was recruited during weight acceptance. Thus, this synergy enhances hip and knee joint stability and provides the initial vertical support necessary for stance initiation.
Overall, these findings support the modular organization of running presented in previous literature, functionally dividing muscle coordination into four primary phases: weight acceptance, propulsion, early swing, and late swing. Similar to Santuz et al. [36], the vastus medialis and vastus lateralis exhibited the highest activation during weight acceptance, while the gastrocnemius medialis, gastrocnemius lateralis, and soleus were dominant during the propulsion phase. In the early swing phase, the tibialis anterior and tensor fasciae latae were most active, whereas the semitendinosus and biceps femoris reached peak activation in late swing.
In muscle synergy analysis, muscle weighting represents the relative contribution of each muscle within a specific synergy, reflecting the extent to which the CNS prioritizes its recruitment to perform a particular motor function. Previous studies have indicated that modifications in muscle weighting can serve as a valuable indicator for evaluating changes in neuromuscular control, motor performance, and the effectiveness of rehabilitation or training strategies during task execution [37].
In the present study, several synergies exhibited remarkable modifications in muscle weighting following a single session of loaded WBV training. Specifically, SYN1 showed an increased contribution of the gastrocnemius medialis, and SYN5 exhibited substantial increments in the rectus femoris and vastus lateralis, highlighting statistically significant and functionally meaningful changes. Alterations in non-dominant muscles within SYN2, SYN3, and SYN4 were also observed, but these did not substantially influence the overall synergy structure and are therefore not discussed in detail here.
These alterations can be interpreted in the context of the previously proposed concepts of synergy reorganization and merging. Evidence indicates that adaptations in muscle synergy structure do not necessarily involve the identification of entirely new synergies but rather the reorganization of existing ones using differentiation or merging processes to optimize motor efficiency [38]. Carson [37] further revealed that pre-existing innate synergies can be modified or suppressed via training. Thus, the CNS can establish new control strategies tailored to specific motor tasks, thereby demonstrating neural plasticity. Using this framework, the increased muscle weightings observed in SYN1 and SYN5 in the present study may reflect a short-term reallocation of neural recruitment priority toward key task-specific muscles induced by loaded WBV training, leading to a temporary optimization of the running control strategy.
In more detail, the increased weighting of the gastrocnemius medialis in SYN1 may indicate that WBV training with additional loading influenced the neural recruitment strategy of the ankle plantar flexors. The gastrocnemius medialis plays a critical role in generating powerful ankle plantarflexion during the late stance phase of running and propelling the body upward and forward. Previous studies have shown that during the propulsion phase, the gastrocnemius and soleus are the main contributors to the forward acceleration of the center of mass and body weight support, collectively accounting for more than half of the peak magnitudes of these parameters [38]. Therefore, the increased weighting of the gastrocnemius medialis following loaded WBV may indicate that the CNS prioritized recruitment of this muscle, which is key for propulsion, as a rapid neuromuscular adaptation potentially contributing to the adjustment of ground reaction force generation. This acute adjustment potentially represents a short-term enhancement of the ankle plantar flexor’s contribution during the propulsion phase, induced by the WBV stimulus.
Similarly, rectus femoris and vastus lateralis weightings in SYN5 demonstrated notable increases. The weight acceptance phase during early stance is critical for stabilizing body weight and controlling forward momentum. The quadriceps group is known to be the primary contributor to braking acceleration and body weight support during this phase [38]. In the present study, the increased weighting of the rectus femoris and vastus lateralis following loaded WBV indicates that the intervention may have substantially improved the neural recruitment strategy of the knee extensors at foot strike, thereby enhancing ground reaction force regulation and impact absorption.
Overall, the present findings indicate that loaded WBV can acutely modulate neural recruitment strategies of major lower-limb muscles during specific running phases. Specifically, this intervention may contribute to enhanced propulsion efficiency by optimizing the contribution of the ankle plantar flexors (particularly the gastrocnemius medialis) and potentially improve landing stability through activation of the knee extensors (rectus femoris and vastus lateralis). These acute neuromuscular adaptations may contribute to short-term improvements in running control, with potential reductions in injury risk and enhancements in running economy.
According to the theory of muscle synergies, the temporal parameters of activation curves reflect how the CNS sequentially activates and inhibits multiple muscles to accomplish a motor task. The present findings reveal that a single session of loaded WBV training altered the temporal activation characteristics of certain muscle synergies during running. SYN1 exhibited a prolonged activation duration, indicating an extended recruitment period of the plantar flexor muscles during the propulsion phase. Compared with pre-intervention values, SYN3 demonstrated earlier activation onset, peak, and offset times by approximately 9.4, 9.6, and 10.6%, respectively. These results indicate that acute mechanical-sensory stimulation can elicit temporal reorganization in neuromuscular control strategies.
Park and Caldwell [39] investigated the changes in muscle synergies during the skill-learning process of a single-leg pedaling force-aiming task. In their study, skill learning was defined as a gradual enhancement of motor performance through voluntary and repetitive practice. Their results indicated that after the learning process, the temporal parameters of synergy activation stabilized, while changes were primarily observed in muscle weightings and muscle activation level. This finding reveals that motor adaptation through voluntary learning helps preserve the original temporal framework of neural control, relying instead on modulation of activation intensity or selective muscle grouping to achieve task goals. In contrast, the present study observed a rapid modification of activation timing following an acute loaded WBV intervention. Unlike voluntary skill learning, WBV provides external mechanical-sensory stimulation that may immediately influence proprioceptive input and α-motoneuron excitability, leading to transient reorganization of temporal activation patterns. This distinction highlights that interventions based on mechanical stimulation can exert pronounced neurophysiological effects acutely, differentiating them from the slower, experience-dependent adaptations characteristic of voluntary learning.
Furthermore, Matsunaga et al. [40] reported that after only 10 min of running, the activation timing of postural control-related synergies during the stance phase was delayed, accompanied by a reorganization of muscle groupings from the trunk to the pelvic muscles. This finding indicates that even in the absence of overt fatigue or training intervention, certain functional synergies can flexibly adjust their activation timing and weighting in response to changes in external conditions such as exercise duration. In the present study, SYN3, which primarily contributes to landing stability and impact absorption, also exhibited a pronounced advancement of activation timing following loaded WBV training. Consistent with the findings of Matsunaga et al. [40], the current study reveals a high degree of temporal plasticity in landing-related synergies. Importantly, the combined effects of strong vibratory stimulation and external loading in this study contributed to rapid and pronounced temporal adjustment, highlighting a robust intervention effect.
Overall, the present results indicate that a single session of loaded WBV training can acutely advance the temporal activation characteristics of specific muscle synergies. This finding is different from traditional motor adaptations achieved through repetitive learning, indicating that mechanical stimulation can rapidly reorganize the temporal structure of muscle synergy activation during running. Such acute reconfiguration provides new evidence for the neural and physiological adaptability underlying motor control reorganization.
The current study has several limitations that should be considered. First, the participant pool comprised exclusively of young male recreational runners. Therefore, the findings cannot be generalized to female runners, elite or highly trained athletes, or individuals with different training backgrounds. Future research should include both sexes, a broader age range, and participants with varying training levels to determine whether sex-, age-, or training-related differences affect neuromuscular adaptations to loaded WBV. Second, this study examined only the acute effects of a single session of loaded WBV training, which limits the generalizability of the findings to long-term adaptations. Although transient neural adjustments in muscle synergy organization were observed, the extent and persistence of these adaptations over time remain unclear. Future longitudinal studies are warranted to determine whether repeated WBV sessions can induce stable changes in muscle synergy. Third, all running trials were conducted at a fixed submaximal speed (3.3 m/s). Although consistent testing conditions were maintained, ecological validity may have been limited because muscle synergy patterns depend on running speed and intensity. Future studies should explore a broader range of speeds or use individualized intensities. Fourth, a pre–post design lacking a control group makes it difficult to isolate the independent effects of WBV and external loading. Future studies should include a parallel control group (e.g., no vibration or no external load) to clarify the independent and combined effects of these interventions.
5. Conclusion
Overall, this study is the first to provide evidence that a single session of loaded WBV training can acutely reorganize the spatial and temporal structures of muscle synergies during running. The observed enhancements in the recruitment of key propulsive and stabilizing muscles, along with the advancement of activation timing, indicate that vibration combined with external loading may influence neuromuscular coordination patterns. These findings highlight the potential of loaded WBV as a warm-up strategy and suggest that such neuromuscular adaptations could potentially impact running performance and stability, while offering a novel perspective for understanding the short-term neural adaptability of human motor control.
Funding information
The study was funded by The National Social Science Fund of China (24BTY042).
Author contributions
Conceptualization: Hyeri Nam. Formal Analysis: Hyeri Nam, Ruipeng Liu. Investigation: Hyeri Nam, Menghan Xu, Chaoyu Guo, Van Minh Le. Methodology: Hyeri Nam, Lin Wang. Supervision: Lin Wang. Writing - original draft preparation: Hyeri Nam. Writing - review & editing: Lin Wang, Ruipeng Liu, Menghan Xu, Chaoyu Guo, Van Minh Le.
Conflict of interest statement
Authors state no conflict of interest.