
Table 1
Comparison between TLEM 1.1 and TLEM 2.0 models implemented in the AnyBody Modeling System repository
| TLEM 1.1 | TLEM 2.0 | |||
|---|---|---|---|---|
| Information included in the literature [27–29] | ||||
| Cadaver | Men, 77 years, 1.74 m, body mass 105 kg | Men, 85 years, estimated mass of leg – 45 kg; leg length – 813 mm | ||
| Segments | Pelvis, right and left: femur, patella, tibia, talus, foot (consisting of hindfoot, midfoot, phalanges) | Pelvis, right and left: femur, patella, tibia (including fibula), talus, foot (consisting of hindfoot, midfoot, phalanges) | ||
| Joints and DOF | 21 DOF, 11 joints: L5S1, right and left: hip, knee, patellofemoral, talocrural, subtalar | |||
| Density parameters | x | Bone: 1,500 kg/m3; Muscle: 1,060 kg/m3; Fat: 900 kg/m3 | ||
| Inertial parameters | Segment mass and centre of mass were estimated using established anthropometric regression. Moments of inertia were calculated about the transversal and longitudinal axes of the segment | Segment mass, centre of mass, and also principal axes of inertia and moment of inertia were calculated for each segment, based on the segmented bone, muscle and fat volumes, using SolidWorks® 2013 | ||
| Muscle | 58 muscles divided into 163 branches per leg | 55 muscles divided into 166 branches per leg | ||
| Muscle parameters | The muscle–tendon architecture dataset (muscle fibre length, physiological cross-sectional area, the pennation angles and tendon length) was adapted from the original TLEM dataset [27] | |||
| Nominal fibre lengths and physiological cross-sectional area (PCSA) were adapted from the Klein-Horsman et al. [27] dataset | Fibre lengths were individually scaled, comparing the total length of the muscle-tendon elements in the TLEM 1.1 and in the TLEM 2.0 dataset | |||
| PCSA were calculated taking into account the scaled fibre lengths, the pennation angles and the measured muscle volumes | ||||
| Wrapping muscles | Illiacus, Psoas Major, Gastrocnemius | Illiacus, Psoas Major, Gluteus Maximus, Quadiceps Femoris, Hamstrings, Gastrocnemius | ||
| Parameters included in the AnyBody Modeling System for standard model | ||||
| Body parameters of standard model | Body mass = 75 kg | Body mass = 75 kg | ||
| Height = 1.80 m | Height = 1.75 m | |||
| Fat percent = (−0.09 + 0.0149 BMI − 0.00009 BMI2) × 100 | ||||
| Segment mass (kg) | Pelvis = 10.65 | Shank = 4.00 | Pelvis = 11.222 | Shank = 3.6287 |
| Patella = 0.00 | Talus = 0.26 | Thigh = 6.0191 | Talus = 0.2605 | |
| Thigh = 7.00 | Foot = 1.04 | Patella = 0.025 | Foot = 0.7226 | |
| Segments length, width (m) | PelvisWidth = 0.16 | KneeWidth = 0.0975 | PelvisWidth = 0.1686 | KneeWidth = 0.0975 |
| HeelHeight = 0.05 | AnkleWidth = 0.0753 | |||
Table 2
The completed list of the analysed muscle actuators available in the TLEM 1.1 and TLEM 2.0 models: number of muscle elements representing the muscle actuators, type of the path line
| Muscle | TLEM 1.1 | TLEM 2.0 | TLEM 1.1 | TLEM 2.0 | Muscle | TLEM 1.1 | TLEM 2.0 | TLEM 1.1 | TLEM 2.0 |
|---|---|---|---|---|---|---|---|---|---|
| S/WS/VP | #Elements | S/WS/VP | #Elements | ||||||
| Add. Brev. Distal | S | S | 2 | 2 | Obturator Ext. Sup. | VP | VP | 3 | 3 |
| Add. Brev. Mid | S | S | 2 | 2 | Obturator Int. | VP | VP | 3 | 6 |
| Add. Brev. Prox. | S | S | 2 | 2 | Pectineus | S | S | 4 | 4 |
| Add. Long. | S | S | 6 | 6 | Peroneus Brevis | VP | VP | 3 | 3 |
| Add. Mag. Distal | S | S | 3 | 3 | Peroneus Long. | VP | VP | 3 | 3 |
| Add. Mag. Mid | S | S | 6 | 6 | Peroneus tert. | VP | - | 3 | - |
| Add. Mag. Prox. | S | S | 4 | 4 | Piriformis | S | S | 1 | 1 |
| Biceps Fem. CB | S | WS | 3 | 3 | Plantaris | S | WS | 1 | 1 |
| Biceps Fem. CL | S | WS | 1 | 1 | Popliteus | VP | VP | 2 | 3 |
| Ext. Dig. Long. | VP | VP | 3 | 4 | Psoas Major | WS | WS | 1 | - |
| Ext. Hall. Long. | VP | VP | 3 | 3 | Psoas Minor | S | - | 3 | 5 |
| Flex. Dig. Long. | VP | VP | 3 | 4 | Quadratus Fem. | S | S | 4 | 4 |
| Flex. Hall. Long. | VP | VP | 3 | 3 | Rectus Fem. | S | WS | 2 | 2 |
| Gastrocn. Lat. | WS | WS | 1 | 1 | Sartorius | VP | VP | 2 | 1 |
| Gastrocn. Med. | WS | WS | 1 | 1 | Semimembr. | S | WS | 1 | 3 |
| Gemellus Inf. | S | S | 1 | 1 | Semitendin. | VP | WS | 1 | 1 |
| Gemellus Sup. | S | S | 1 | 1 | Soleus Lat. | S | S | 3 | 3 |
| Glut. Max. Sup. | S | WS | 6 | 6 | Soleus Med. | S | S | 3 | 3 |
| Glut. Max. Inf. | S | WS | 6 | 6 | Tensor Fasc. L. | S | S | 2 | 2 |
| Glut. Med. Ant. | S | S | 6 | 6 | Tib. Ant. | VP | VP | 3 | 3 |
| Glut. Med. Post. | S | S | 6 | 6 | Tib. Post. Lat. | VP | VP | 3 | 3 |
| Glut. Min. Ant. | S | S | 1 | 2 | Tib. Post. Med. | VP | VP | 3 | 3 |
| Glut. Min. Mid | S | S | 1 | 2 | Vastus Inter. | S | WS | 6 | 6 |
| Glut. Min. Post. | S | S | 1 | 2 | Vastus Lat. Inf. | S | WS | 6 | 6 |
| Gracilis | VP | S | 2 | 2 | Vastus Lat. Sup. | S | WS | 2 | 2 |
| Iliacus Lat. | WS | WS | 3 | 2 | Vastus Med. Inf. | S | WS | 2 | 2 |
| Iliacus Med. | WS | WS | 3 | 2 | Vastus Med. Mid | S | WS | 2 | 2 |
| Iliacus Mid | WS | WS | 3 | 2 | Vastus Med. Sup. | S | WS | 6 | 4 |
| Obturator Ext. Inf. | S | VP | 2 | 2 | |||||
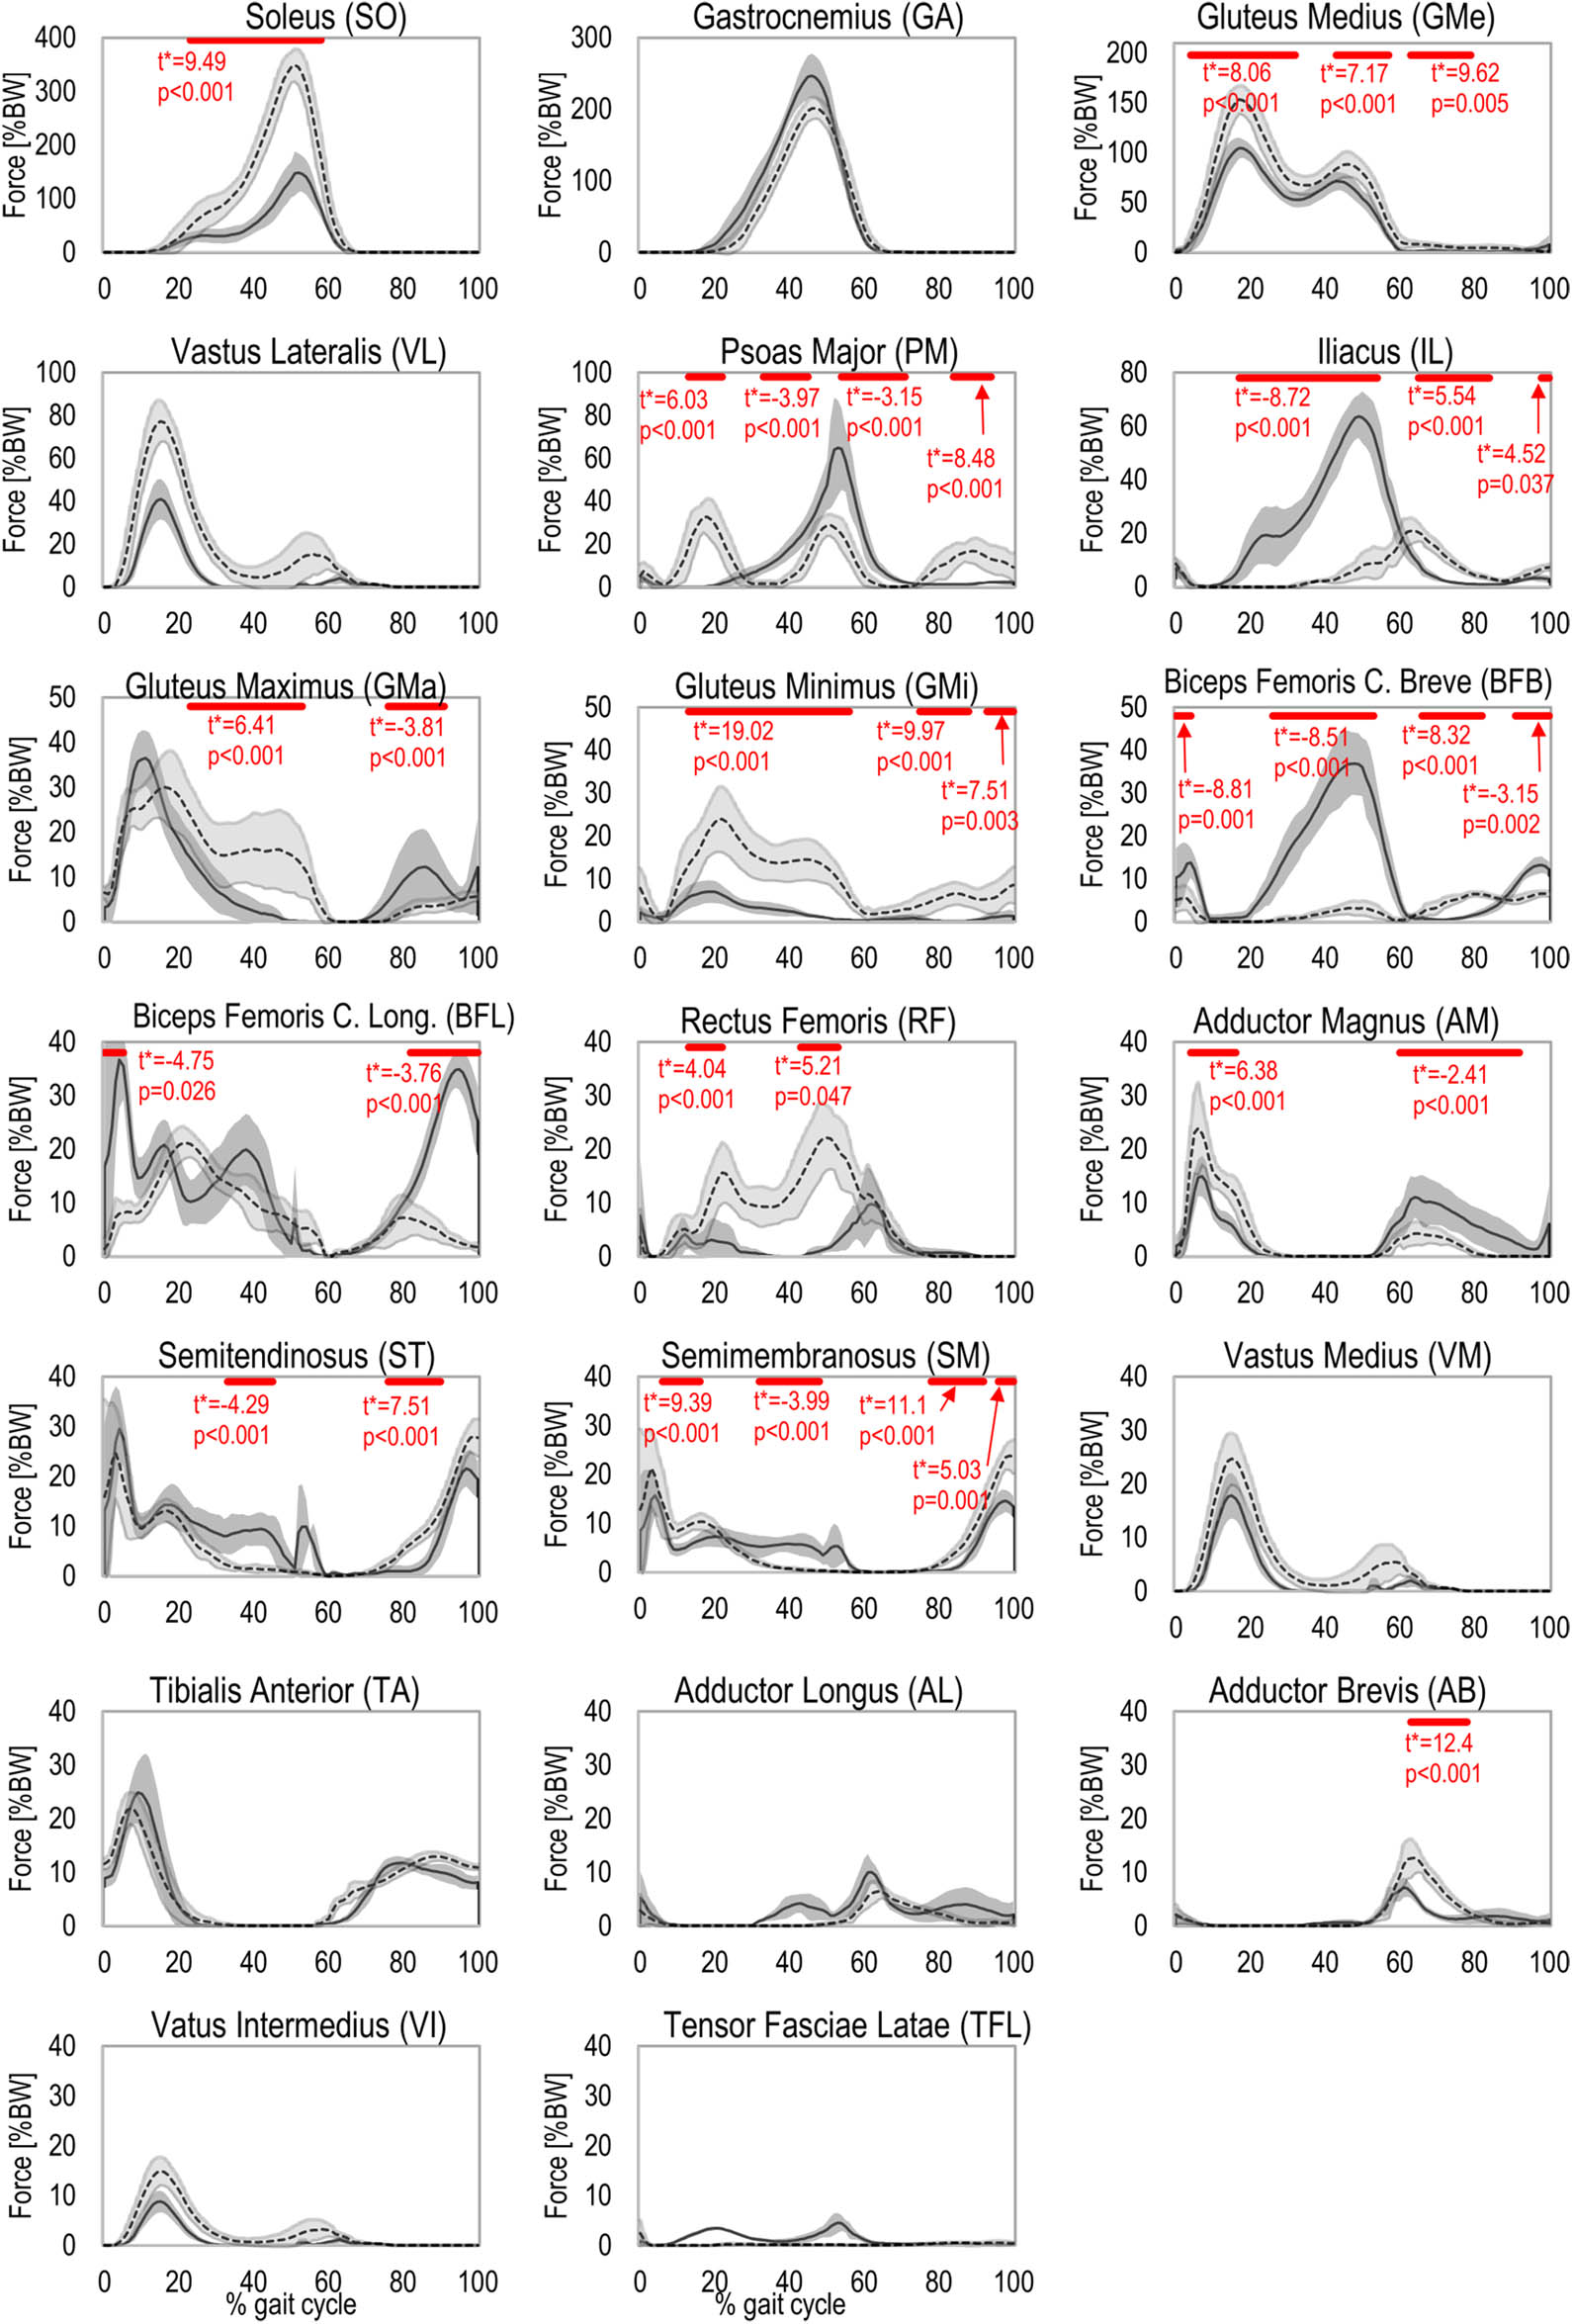
Figure 1
Time waveforms (mean and standard deviation) of the active muscle force for the 20 muscles of the lower limb, obtained using two standard models in the AnyBody Modeling System, i.e. TLEM 1.1 (dashed line) and TLEM 2.0 (solid line). Red bars denote significant differences (SPM{t}, p < 0.05), with peak t* (t max) values shown for each region.
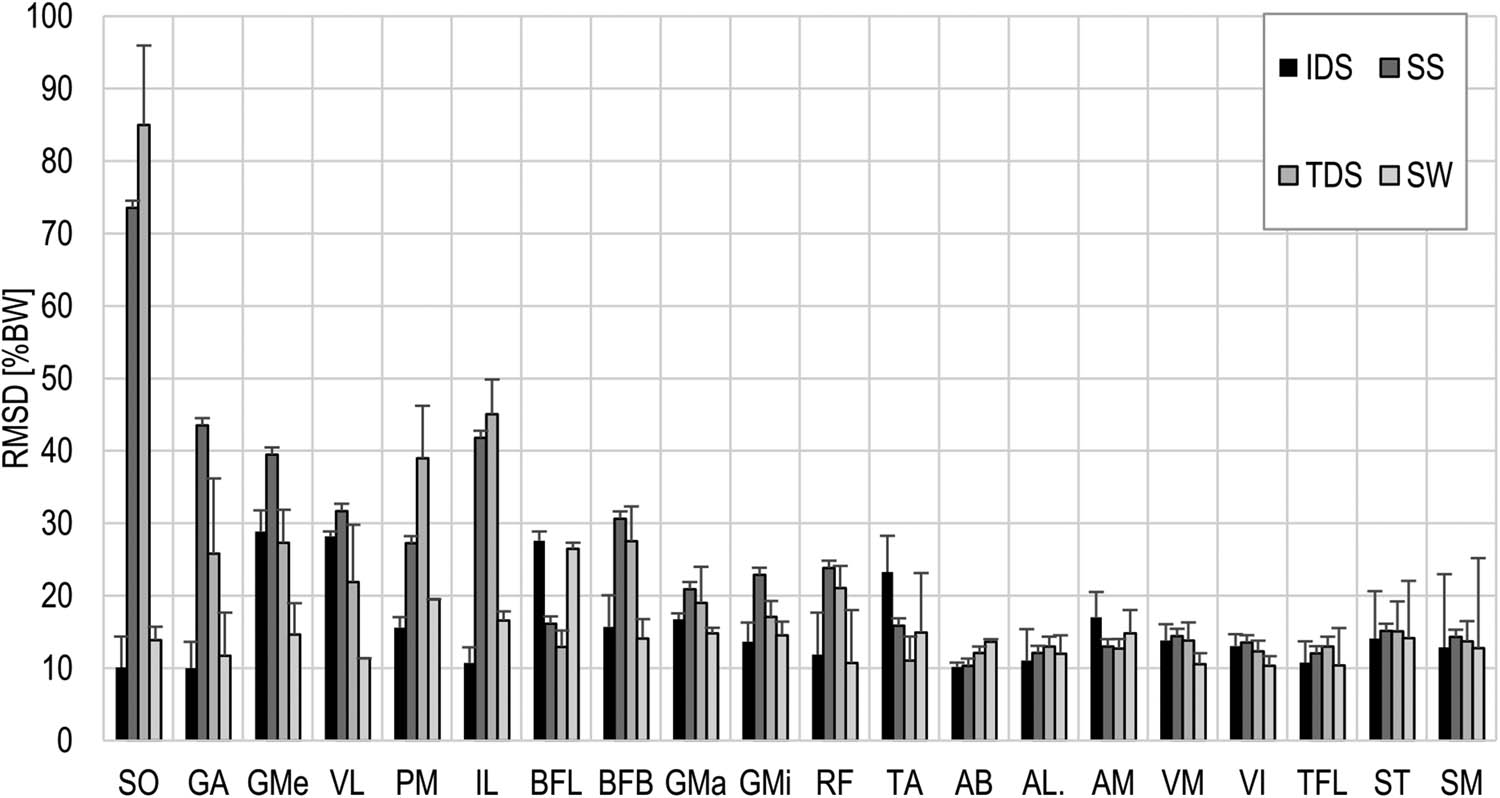
Figure 2
Mean RMSD for the comparison of muscle forces between the TLEM 1.1 and TLEM 2.0 models for four periods (IDS – initial double stance, SS – single stance, TDS – terminal double stance, SW – swing phase). Error bars represent one standard deviation. Abbreviations for muscle names are listed in Figure 1.
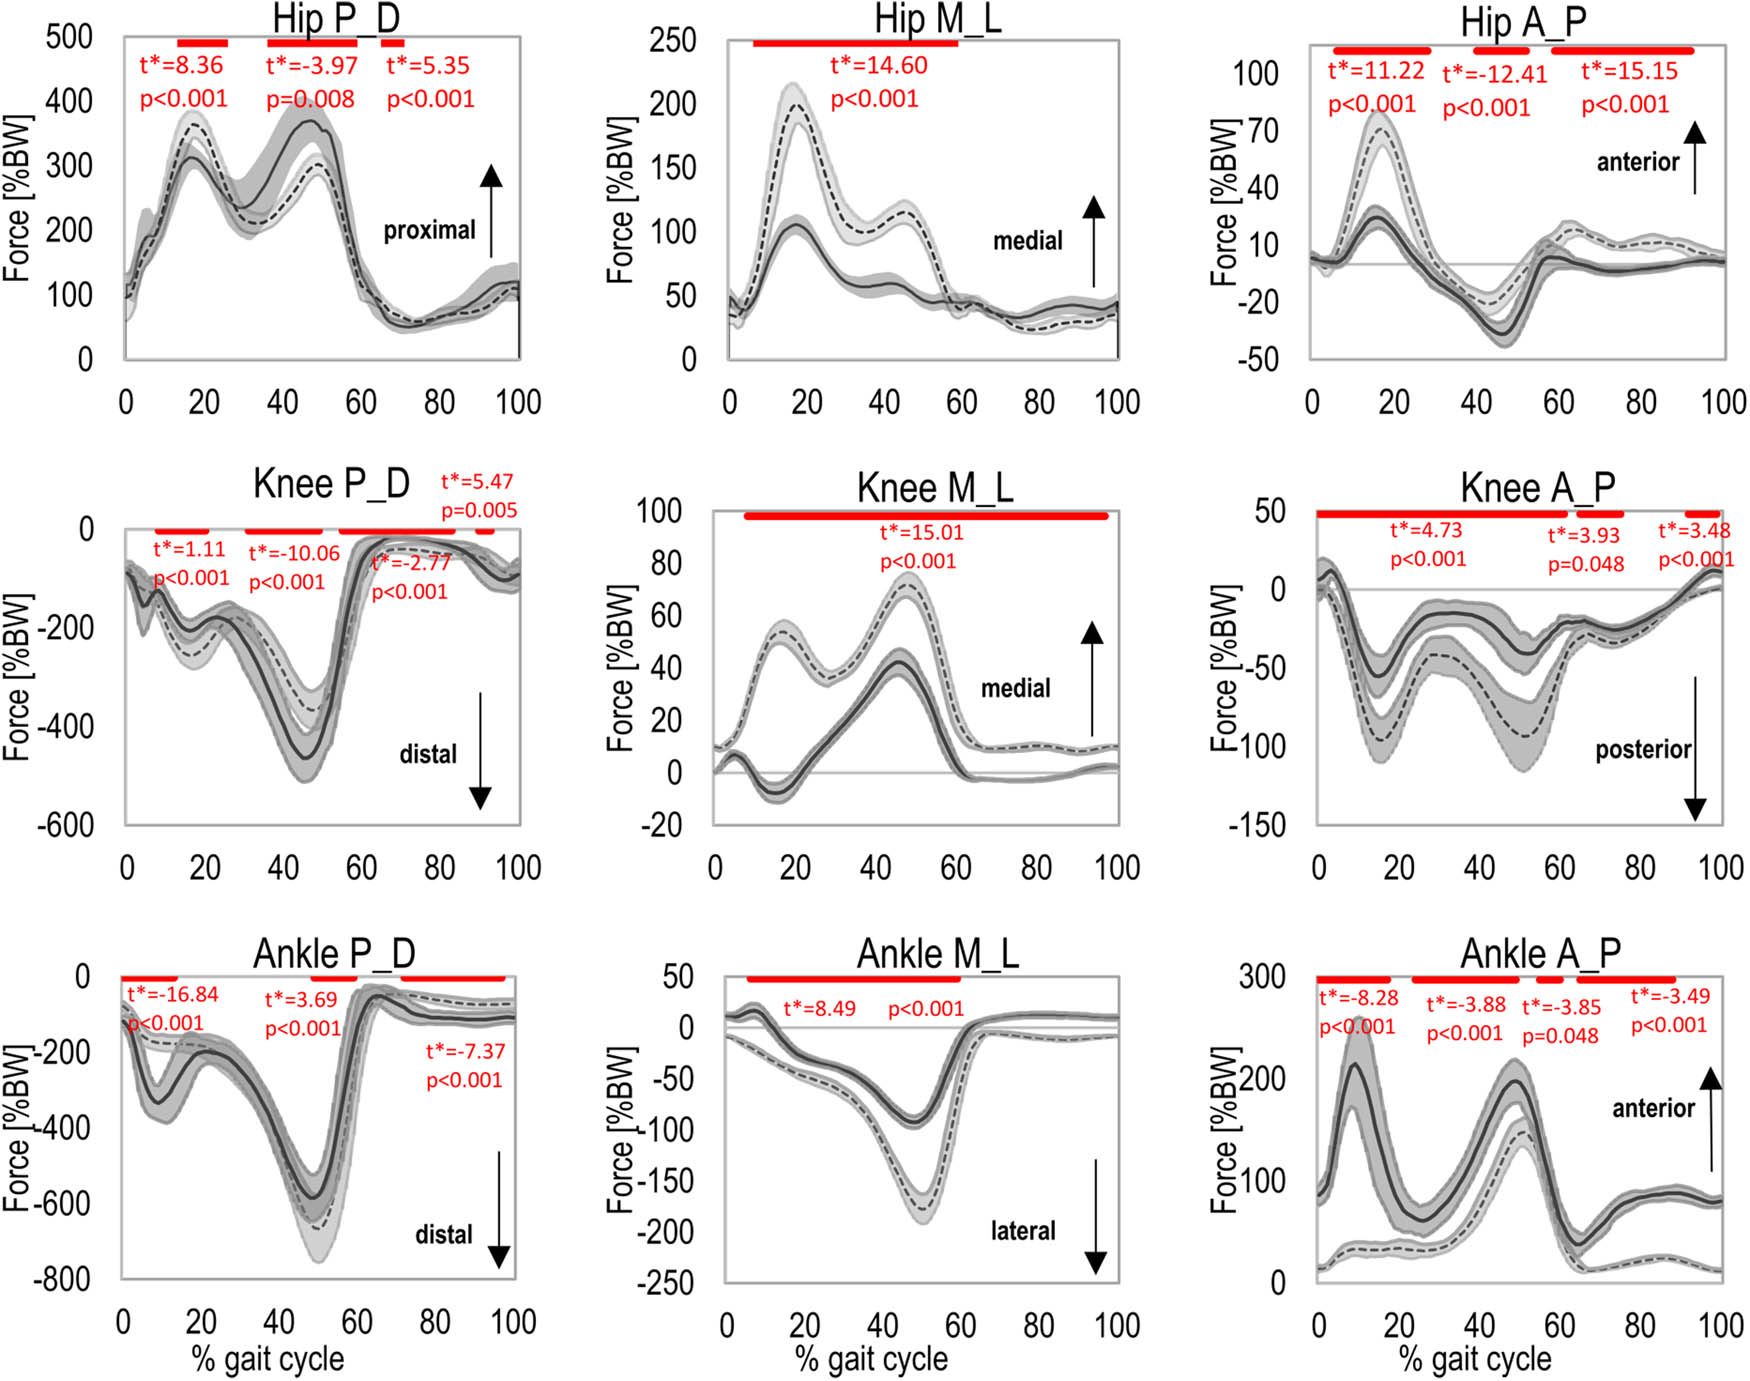
Figure 3
Time waveforms (mean and standard deviation) of the joint reaction force components for: (a) hip joint, (b) knee joint, (c) ankle joint (P_D – proximal [+] - distal [−]; M_L – medial [ +] - lateral [−]; A_P – anterior [ +] - posterior [−]). A comparison of the results obtained using the two standard models in the AnyBody Modeling System (TLEM 1.1 [dashed line] and TLEM 2.0 [solid line]) is shown. Red bars denote significant differences (SPM{t}, p < 0.05), with peak t* (t max) values shown for each region.
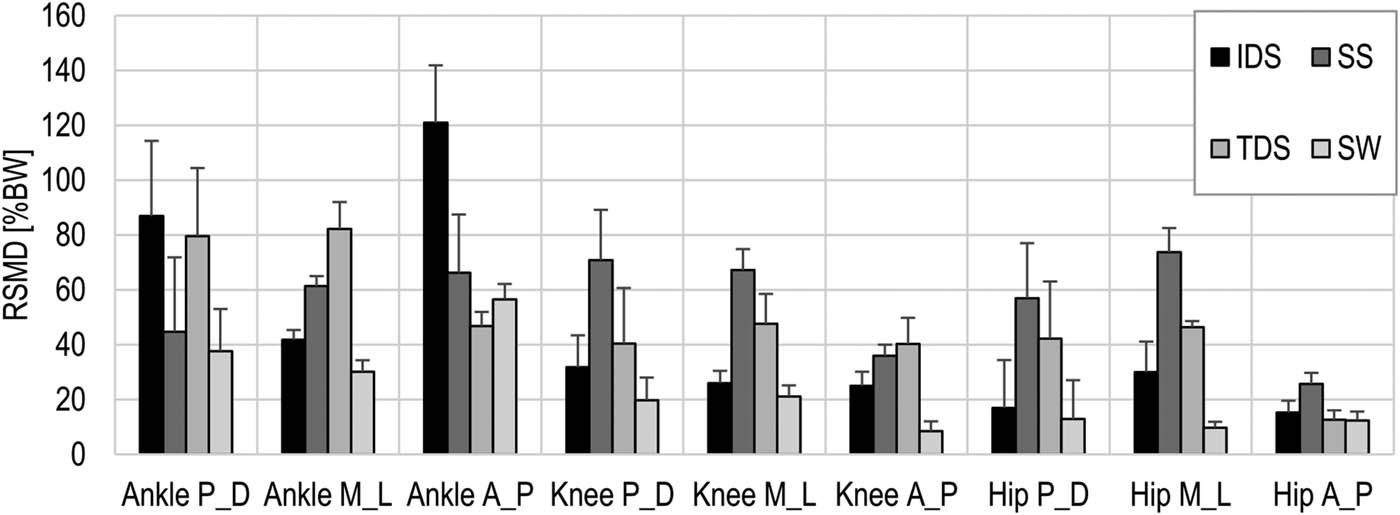
Figure 4
Mean RMSD for the comparison of joint reaction forces components (P_D – proximal [ +] - distal [−]; M_L – medial [ +] - lateral [−]; A_P – anterior [ +] - posterior [−]) between the TLEM 1.1 and TLEM 2.0 model for four periods (IDS – initial double stance, SS – single stance, TDS – terminal double stance, SW – swing phase). Error bars represent one standard deviation.