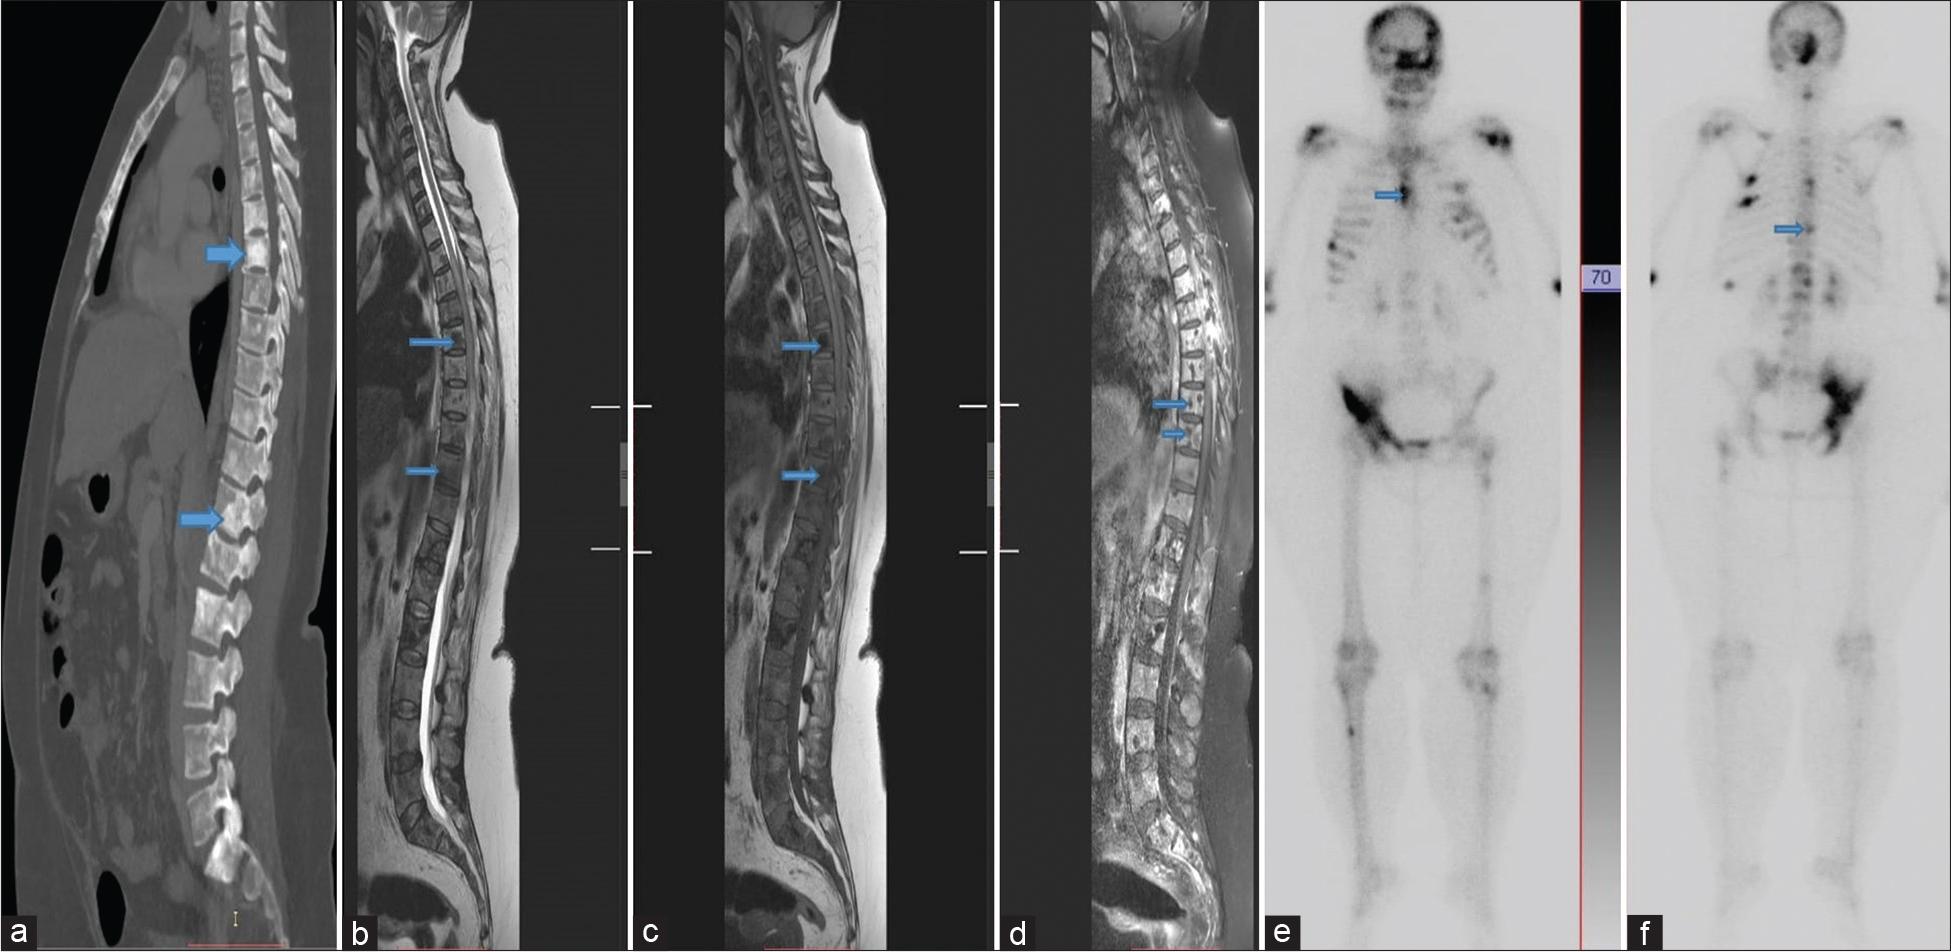
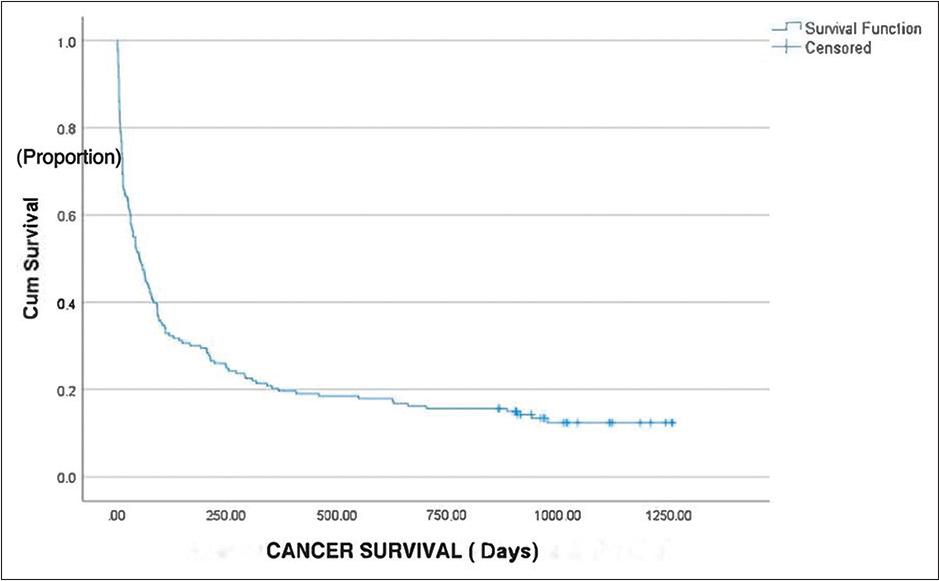
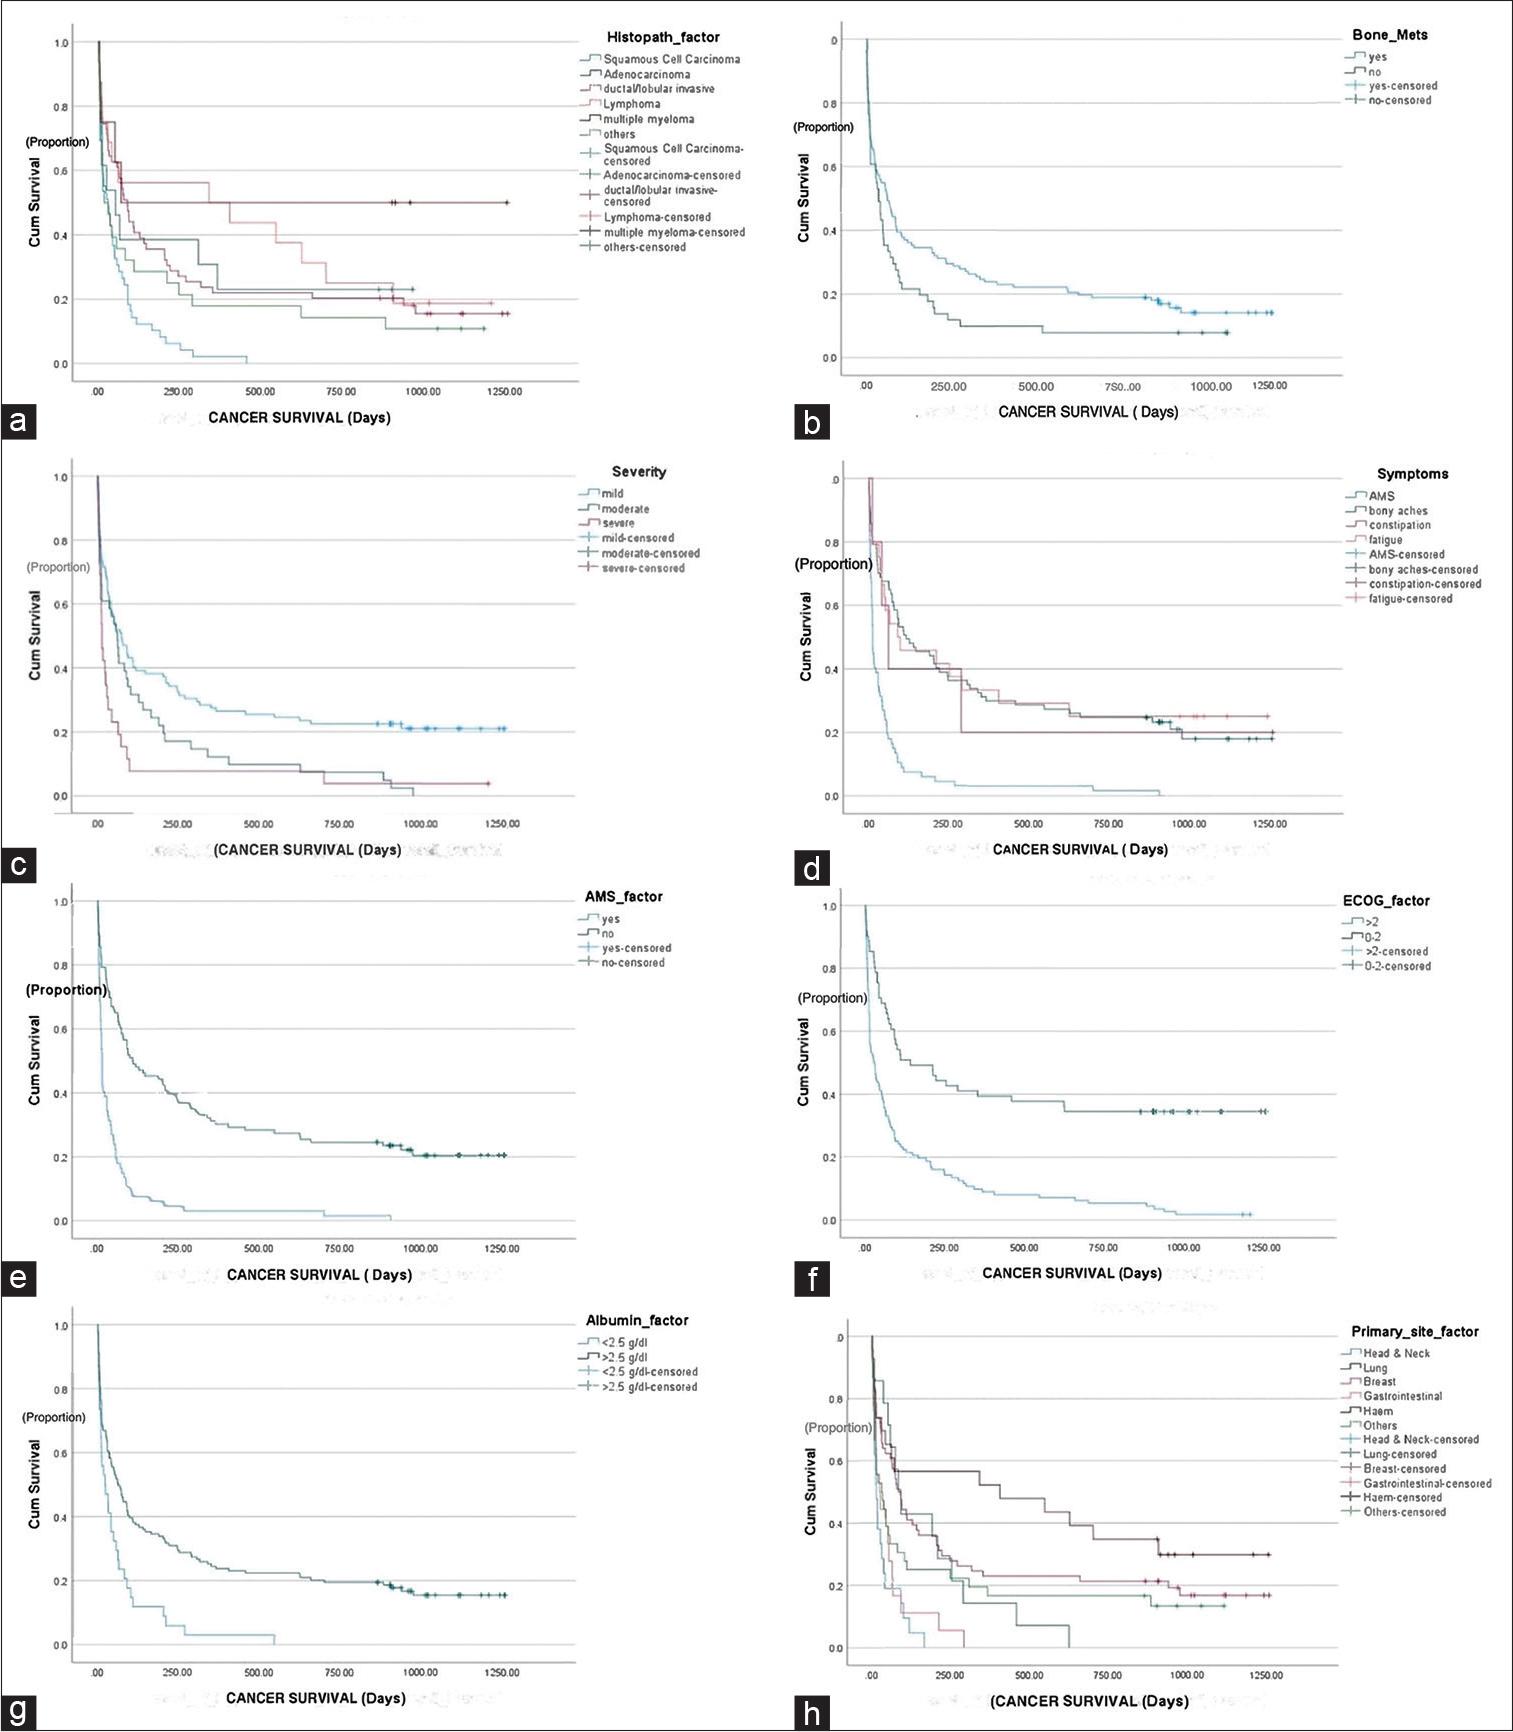
Have a personal or library account? Click to login
Survival Outcomes in Malignancy-related Hypercalcemia: A Tertiary Care Single-center Experience Cover

Survival Outcomes in Malignancy-related Hypercalcemia: A Tertiary Care Single-center Experience

Open Access
|Aug 2024

Figures & Tables

Figure 1:

Radiological representative images of bone metastasis: Images of a 50-year-old female patient of breast cancer with extensive axial skeleton osseous metastasis. Magnetic resonance imaging whole spine (a) T2 weighted, (b) T1 weighted, (c) contrast-enhanced mid-sagittal slices, (d) computed tomography scan mid-sagittal slice, bone window settings, and (e and f) Bone scan, anterior and posterior planer images. Blue arrows are sites of axial skeleton osseous metastasis.

Figure 2:

The median overall survival (OS) for the patients was found to be 51 days. X-axis: Cancer survival days. Y-axis: Cumulative survival proportion. The median OS curve represents the relationship between the onset of hypercalcemia and the proportion of patients who survive beyond that time. X-axis represents the time (number of days) from the onset of hypercalcemia till death. Y-axis represents the cumulative proportion of patients who survive beyond a certain time point. Curve starts at 1 (100 %) on Y-axis indicating that all patients are alive at the beginning of the study. As time progresses, the curve descends gradually, reflecting the decrease in the proportion of patients surviving as time goes on. Median OS represents the time at which 50 % of patients have survived beyond. Median OS was 51 days (95% confidence interval 31–70 days)

Figure 3:

Impact of various factors on overall survival (OS) was determined: (a) Delineated significant variance in OS across distinct histopathologies (P < 0.001). Squamous cell carcinoma exhibited better long-term survival compared to adenocarcinoma, ductal/lobular invasive, lymphoma, multiple myeloma, and others. In (b), the illustration depicted a notable survival discrepancy between groups based on the presence or absence of bone metastasis (P < 0.04). (c) Elucidated the gradation of hypercalcemia severity (mild, moderate, and severe) with superior OS observed in patients with mild hypercalcemia (P < 0.001). (d) Clarified OS differences among various reported symptoms (P < 0.001). (e) Illustrates the contrast in OS based on the presence or absence of altered mental state (AMS) (P < 0.001). In addition, (f) depicted a significant survival discrepancy across different Eastern Cooperative Oncology Group (ECOG) statuses (P < 0.001), with better survival rates observed in patients with ECOG statuses of 0–2 compared to those with statuses below 2. (g and h) demonstrated OS variation between albumin categories (<2.5 vs. >2.5) (P < 0.001) and primary cancer sites (P < 0.001), with marginal survival differences between albumin categories and no disparity observed among primary cancer sites

Flowchart of malignancy-related hypercalcemia patients admissions at SKMCH&RC (July 2019 to June 2020)

CategoryCount
Total patients presented with hypercalcemia from July 2019 to June 2020298
Excluded patients (other causes)81
  - Primary hyperparathyroidism
  - Multiple endocrine neoplasia syndrome
  - Chronic kidney disease with GFR < 30 ml/min/1.73 m2
Admitted with symptomatic malignancy-related hypercalcemia217
Lost to follow up among malignancy-related hypercalcemia44
Followed till 15th Dec 2022173
  - Died150
  - Alive till last follow up23

Relationship between various factors and survival outcomes was investigated

FactorMedian OS, days (range)P-value
ECOG <0.001
  >225 (8.5–41.4)
  ≤2140 (2.2–277.7)
Altered mental state <0.001
  Yes13 (10.3–15.6)
  No108 (24.7–191.24)
C-reactive protein 0.06
  >3030 (0.00–67.9)
  <30245 (193.8–296.1)
Albumin <0.001
  <2.523 (0.0–50.1)
  >2.564 (37.0–90.9)
BMI 0.75
  <1836 (33.0–38.9)
  >1852 (30.6–73.3)
Primary site of malignancy <0.001
  Head and neck13 (4.0–21.9)
  Lung82 (48.9–115.0)
  Breast89 (63.8–114.1)
  Gastrointestinal23 (0.1–45.8)
  Hematological405 (0–1151.5)
  Others30 (0–63.8)
Severity of hypercalcemia <0.001
  Mild73 (38.3–107.6)
  Moderate61 (32.1–89.8)
  Severe13 (6.7–19.2)
Type of malignancy 0.31
  Solid43 (19.1–66.8)
  Hematological405 (0–1151.5)
Histopathology <0.001
  Squamous cell carcinoma30 (5.3–54.6)
  Adenocarcinoma52 (0–116.5)
  Ductal/lobular invasive89 (64.2–113.7)
  Lymphoma334 (0–1013.2)
  Multiple myeloma69 (0–0)
  Others18 (0–47.8)
Bone metastasis 0.045
  Yes63 (33.6–92.3)
  No36 (23.7–48.2)
Types of bone metastasis 0.21
  Both76 (48.9–103)
  Vertebral26 (5.6–46.3)
  Non-vertebral51 (0–108.9)
  None36 (24.3–47.6)
Symptoms <0.001
  Altered mental state13 (9.0–16.9)
  Bony aches117 (23.3–210.6)
  Constipation62 (16.9–107)
  Fatigue91 (15.9–166)
Liver metastasis 0.102
  Yes41 (13.1–68.8)
  No61 (28.7–93.2)

Demographics and clinicopathological characteristics of the patients included in the study

DemographicsNumber (%)
Gender
  Male78 (45.1)
  Female95 (54.9)
Median Age, years (Range)54 (22–95)
Histology
  Squamous cell carcinoma49 (28.3)
  Adenocarcinoma13 (7.5)
  Lobular/ductal invasive59 (34.1)
  Lymphoma16 (9.2)
  Multiple myeloma8 (4.6)
  Others28 (16.2)
Primary site of malignancy
  Head and neck21 (12.1)
  Lung14 (8.1)
  Breast61 (35.3)
  Gastrointestinal18 (10.4)
  Hematology23 (13.3)
  Others36 (20.8)
ECOG PS
  111 (6.4)
  250 (28.9)
  363 (36.4)
  449 (28.3)
Bone metastasis
  Yes122 (70.5)
  No51 (29.5)
Type of bone metastasis
  Vertebral and non-vertebral metastasis77 (44.5)
  Vertebral25 (14.5)
  Non-vertebral20 (11.6)
  None51 (29.5)
Symptoms
  Altered mental State67 (38.7)
  Bony aches77 (44.5)
  Constipation5 (2.9)
  Fatigue24 (13.9)
Liver metastasis
  Yes66 (38.2)
  No107 (61.8)
Severity of hypercalcemia
  Mild106 (61.3)
  Moderate41 (23.7)
  Severe28 (15.0)
Type of malignancy
  Solid148 (85.5)
  Hematological23 (13.3)

Survival outcome of the patients included in this study

StatusNumber (Percentage)
Dead150 (86.7)
Alive23 (13.3)
Language: English
Page range: 1 - 12
Submitted on: Apr 4, 2024
Accepted on: May 7, 2024
Published on: Aug 16, 2024
Published by: Shakuat Khanum Memorial Cancer Hospital and Research Centre
In partnership with: Paradigm Publishing Services
Publication frequency: 2 issues per year

© 2024 Sara Ashfaq, Waqas Shafiq, Ahmed Imran Siddiqi, Umal Azmat, Hira Irfan, Sardar Ali Khan, Asim Munir Alvi, Muhammad Abu Bakar, Muhammad Hassan, Asim Farooq, Ali Zafar Sheikh, Kashif Siddique, Kashif Asghar, published by Shakuat Khanum Memorial Cancer Hospital and Research Centre
This work is licensed under the Creative Commons Attribution-NonCommercial-ShareAlike 4.0 License.