
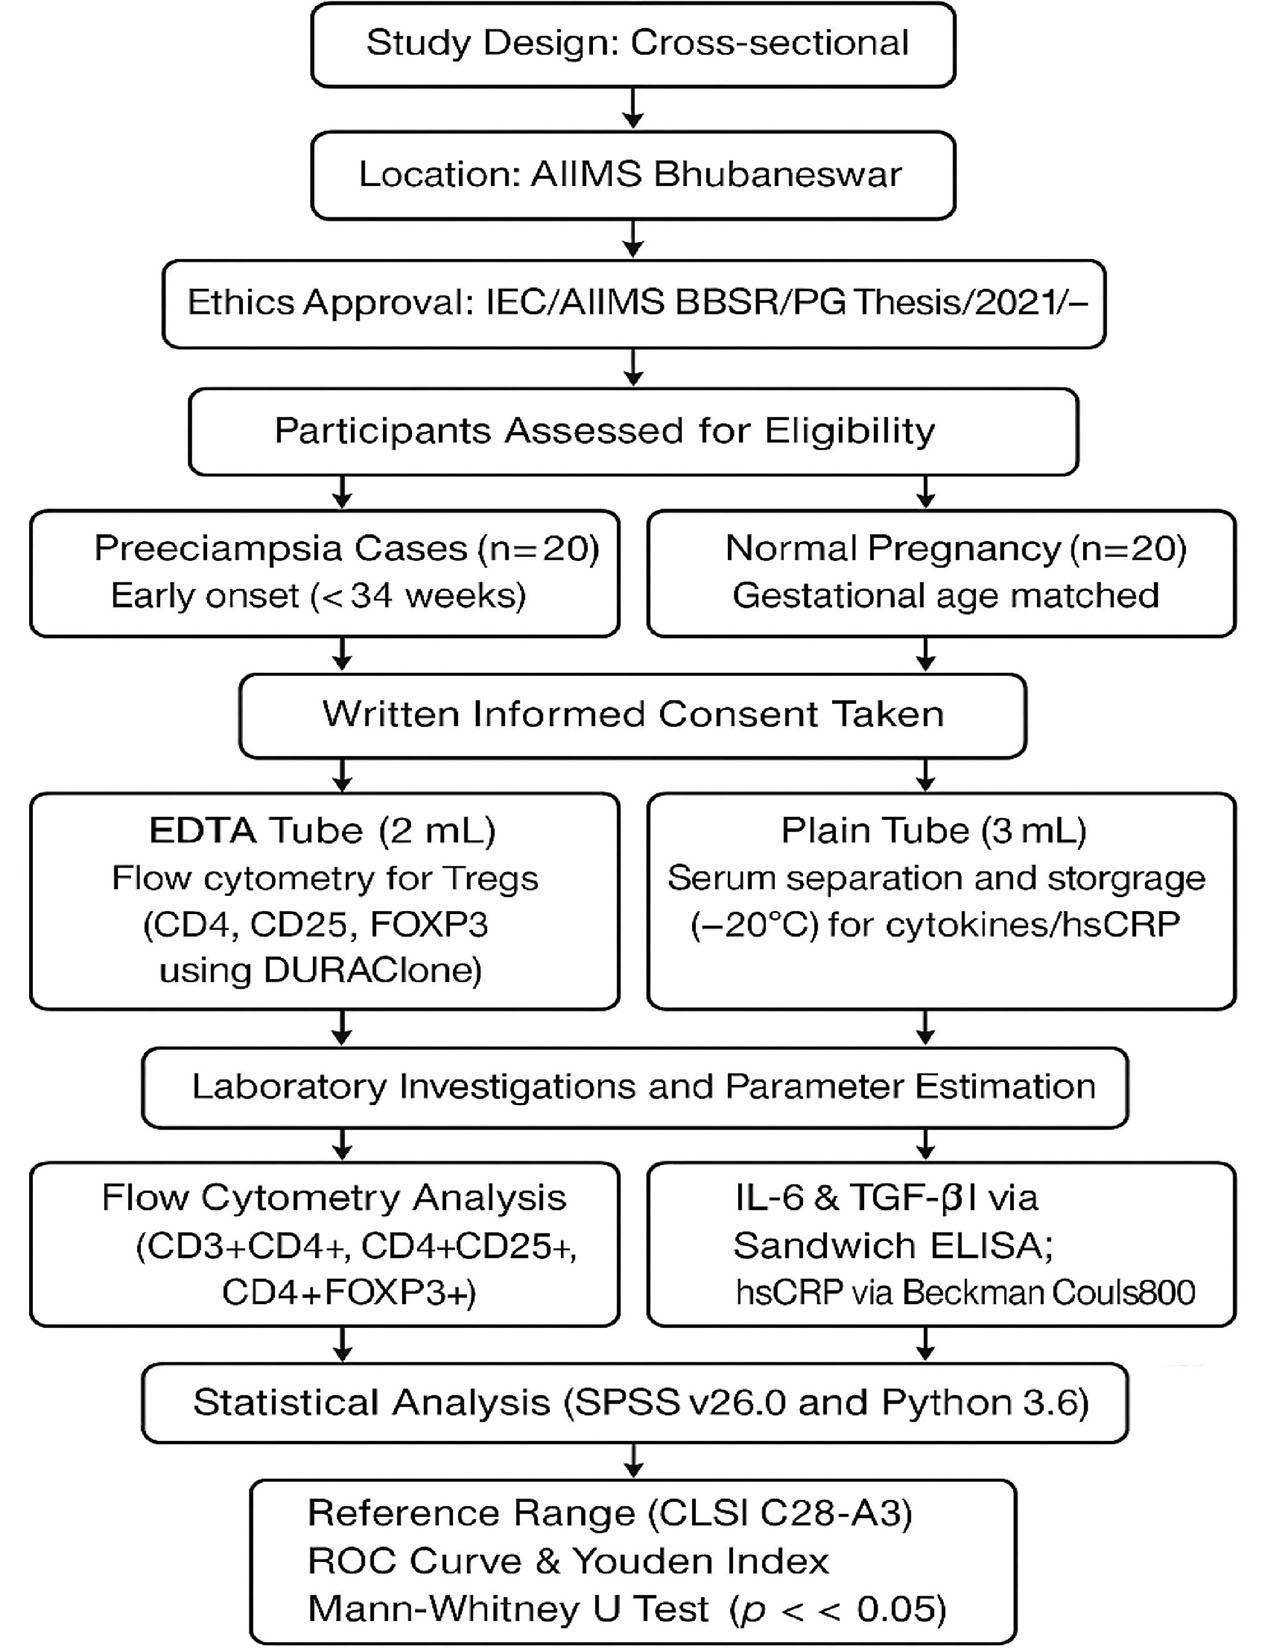
Figure 1.
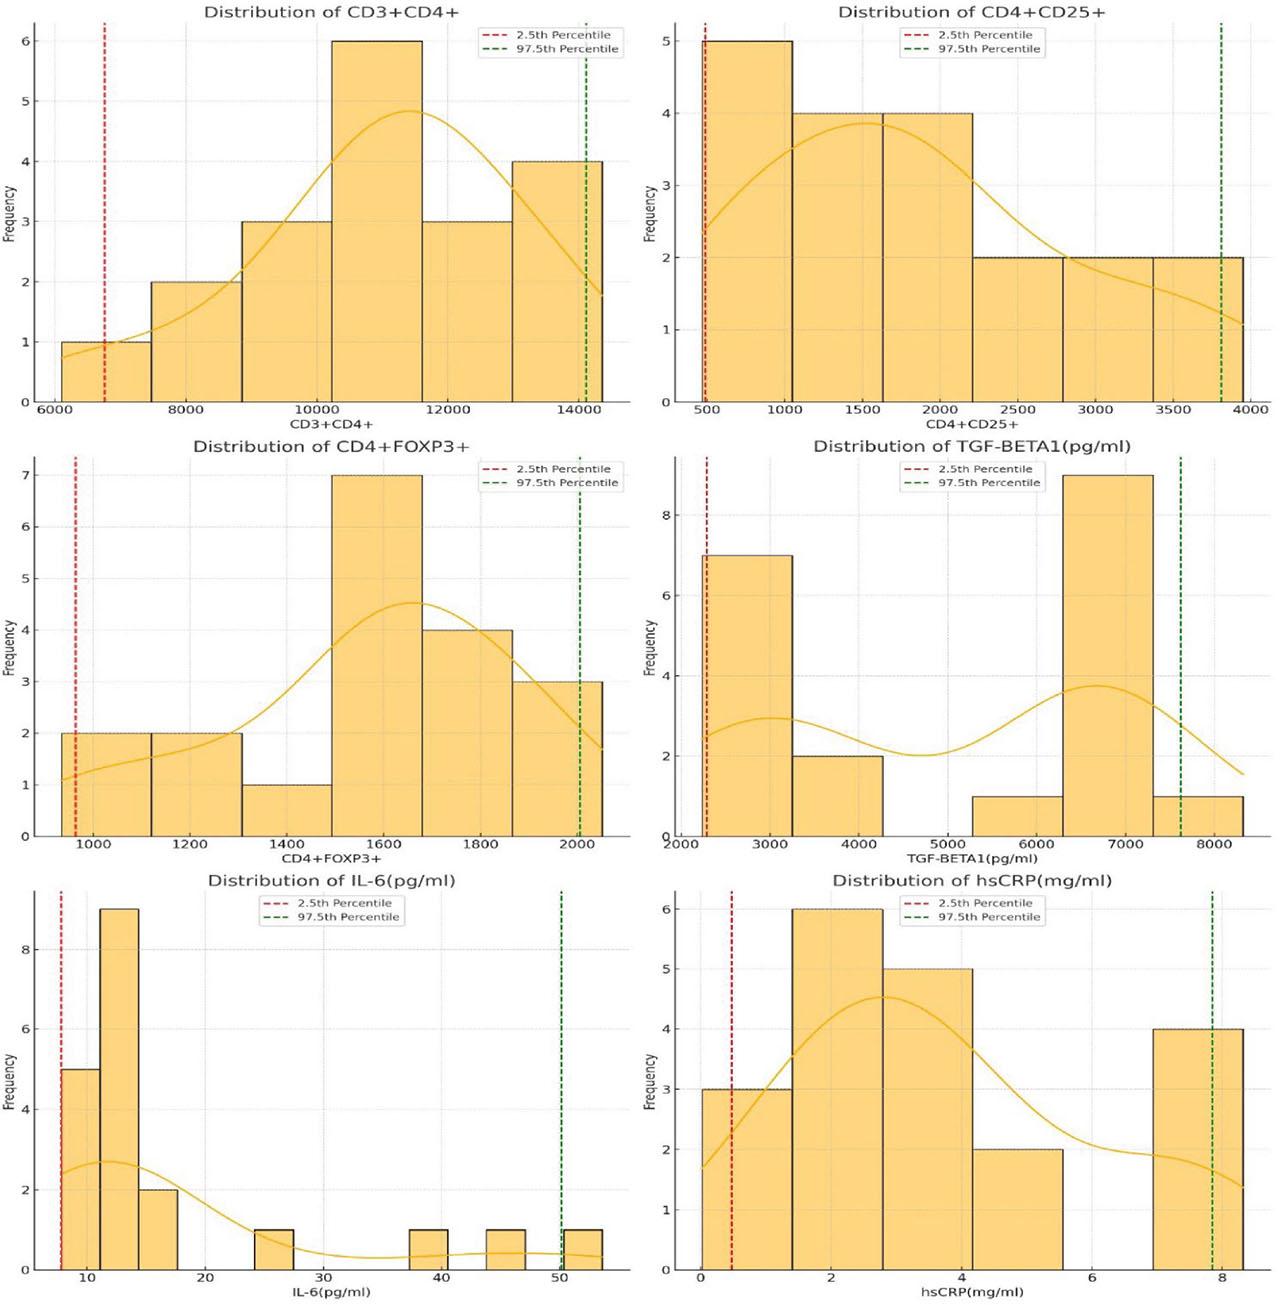
Figure 2.
Descriptive statistics of group-wise data and comparison by Mann-Whitney U test_
| Parameters | Normal Pregnant Women | Pregnant with Preeclampsia | p-value (Mann-Whitney U) |
|---|---|---|---|
| Age (in years) | 28 (25 – 30) | 28 (23 – 30) | 0.989 |
| Gestational Age (in weeks) | 36.3 (28.85 – 38.35) | 36.9 (33.8 – 38.15) | 0.698 |
| Weight (in kg) | 55.5 (51 – 62.5) | 54.5 (48 – 59.5) | 0.429 |
| Height (in cms) | 153.5 (149 – 158) | 152.5 (148 – 158) | 0.495 |
| BMI (in kg/m2) | 24.365 (22.87 – 25.175) | 24.12 (21.68 – 26.505) | 0.947 |
| Waist To Hip Ratio | 0.85 (0.82 – 0.865) | 0.845 (0.82 – 0.85) | 0.547 |
| Systolic BP (in mm of Hg) | 120 (110 – 120) | 147 (140 – 159.5) | <0.001 |
| Diastolic BP (in mm of Hg) | 79 (70 – 80) | 100 (97 – 110) | <0.001 |
| Lymphocyte % | 8.28 (6.14 – 11.72) | 10.695 (8.57 – 13.9) | 0.159 |
| Absolute Lymphocytes (in no. of cells) | 8280 (6140 – 11720) | 10695 (8570 – 13900) | 0.159 |
| CD3+CD4+ % | 33.93 (29.67 – 36.91) | 30.26 (27.12 – 39.6) | 0.374 |
| CD4+CD25+ % | 5.17 (2.64 – 7.16) | 3.495 (1.9 – 5.8) | 0.159 |
| CD4+FOXP3+ % | 4.82 (4.22 – 5.46) | 1.615 (1.17 – 1.94) | <0.001 |
| Absolute CD3+CD4+ (in no. of cells) | 11322 (9901 – 12317) | 10097.5 (9050 – 13215) | 0.374 |
| Absolute CD4+CD25+ (in no. of cells)) | 1725 (881 – 2389) | 1166.5 (634 – 1935) | 0.159 |
| Absolute CD4+FOXP3+ (in no. of cells) | 1608 (1408 – 1822) | 539 (390 – 647) | <0.001 |
| TGF-β1 (in pg/ml) | 6229.245 (3023.31 – 6762.24) | 6445.635 (5275.9 – 6666.03) | 0.718 |
| IL-6 (in pg/ml) | 12.405 (9.95 – 15.8) | 35.195 (22.37 – 49.92) | <0.001 |
| hsCRP (in mg/ml) | 3.245 (2.205 – 5.06) | 6.965 (3.355 – 28.675) | 0.011 |
Threshold value of the studied immunological parameters_
| Parameter | Cut-Off Value | Sensitivity | Specificity |
|---|---|---|---|
| Absolute CD3+CD4+ count | ≤10305 | 61.11 | 75.00 |
| Absolute CD4+CD25+ count | ≤1184 | 55.56 | 67.86 |
| Absolute CD4+FOXP3+ count | ≤1098 | 100.00 | 89.29 |
| TGF-β1 (pg/ml) | >4175.33 | 85.00 | 53.33 |
| IL-6 (pg/ml) | >18.66 | 85.00 | 76.67 |
| hsCRP (mg/ml) | >3.01 | 80.00 | 66.67 |
Lower and Upper Limit of Reference Range by Robust Method with 90%CI_
| Parameter | Lower Limit (90% CI) | Upper Limit (90% CI) | Overall Reference Range |
|---|---|---|---|
| CD3+CD4+ (no. of cells) | 6758.95 (6097 – 6097) | 14109.7 (13805 – 14359) | 6758.95 – 14109.7 |
| CD4+CD25+ (no. of cells) | 486.8 (467 – 467) | 3809.7 (3637 – 3951) | 486.8 – 3809.7 |
| CD4+FOXP3+ (no. of cells) | 964.15 (934 – 934) | 2005.65 (1949 – 2052) | 964.15 – 2005.65 |
| TGF-β1 (pg/ml) | 2290.35875 (2234.76 – 2234.76) | 7619.36325 (6843.45 – 8321.38) | 2290.35875 – 7619.36325 |
| IL-6 (pg/ml) | 7.82 (7.82 – 7.82) | 50.12775 (46.29 – 53.6) | 7.82 – 50.12775 |
| hsCRP (mg/ml) | 0.47125 (0.02 – 0.02) | 7.845 (7.32 – 8.32) | 0.47125 – 7.845 |
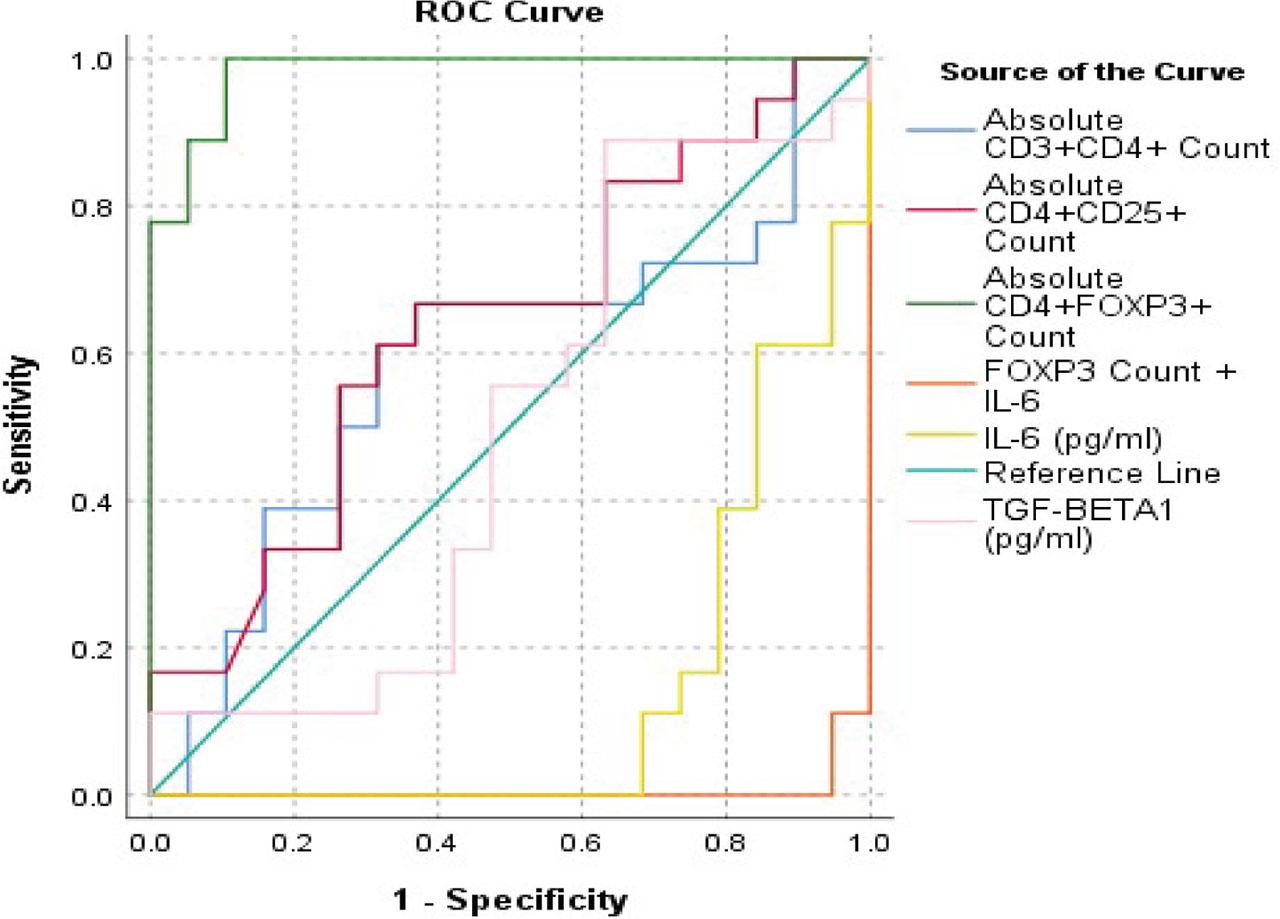
Area Under Curve analysis of the studied parameters_
| Test Result Variable(s) | AUC (95% CI) | p-value |
|---|---|---|
| Absolute CD3+CD4+ Count | 0.588 (0.434 – 0.792) | 0.378 |
| Absolute CD4+CD25+ Count | 0.637 (0.437 – 0.781) | 0.142 |
| Absolute CD4+FOXP3+ Count | 0.982 (0.950 – 1.0) | <0.001 |
| TGF-β1 (pg/ml) | 0.391 (0.211 – 0.220) | 0.931 |
| IL-6 (pg/ml) | 0.863 (0.743 – 0.982) | <0.001 |
| FOXP3 Count + IL-6 | 0.994 (0.982 – 1.008) | <0.001 |