
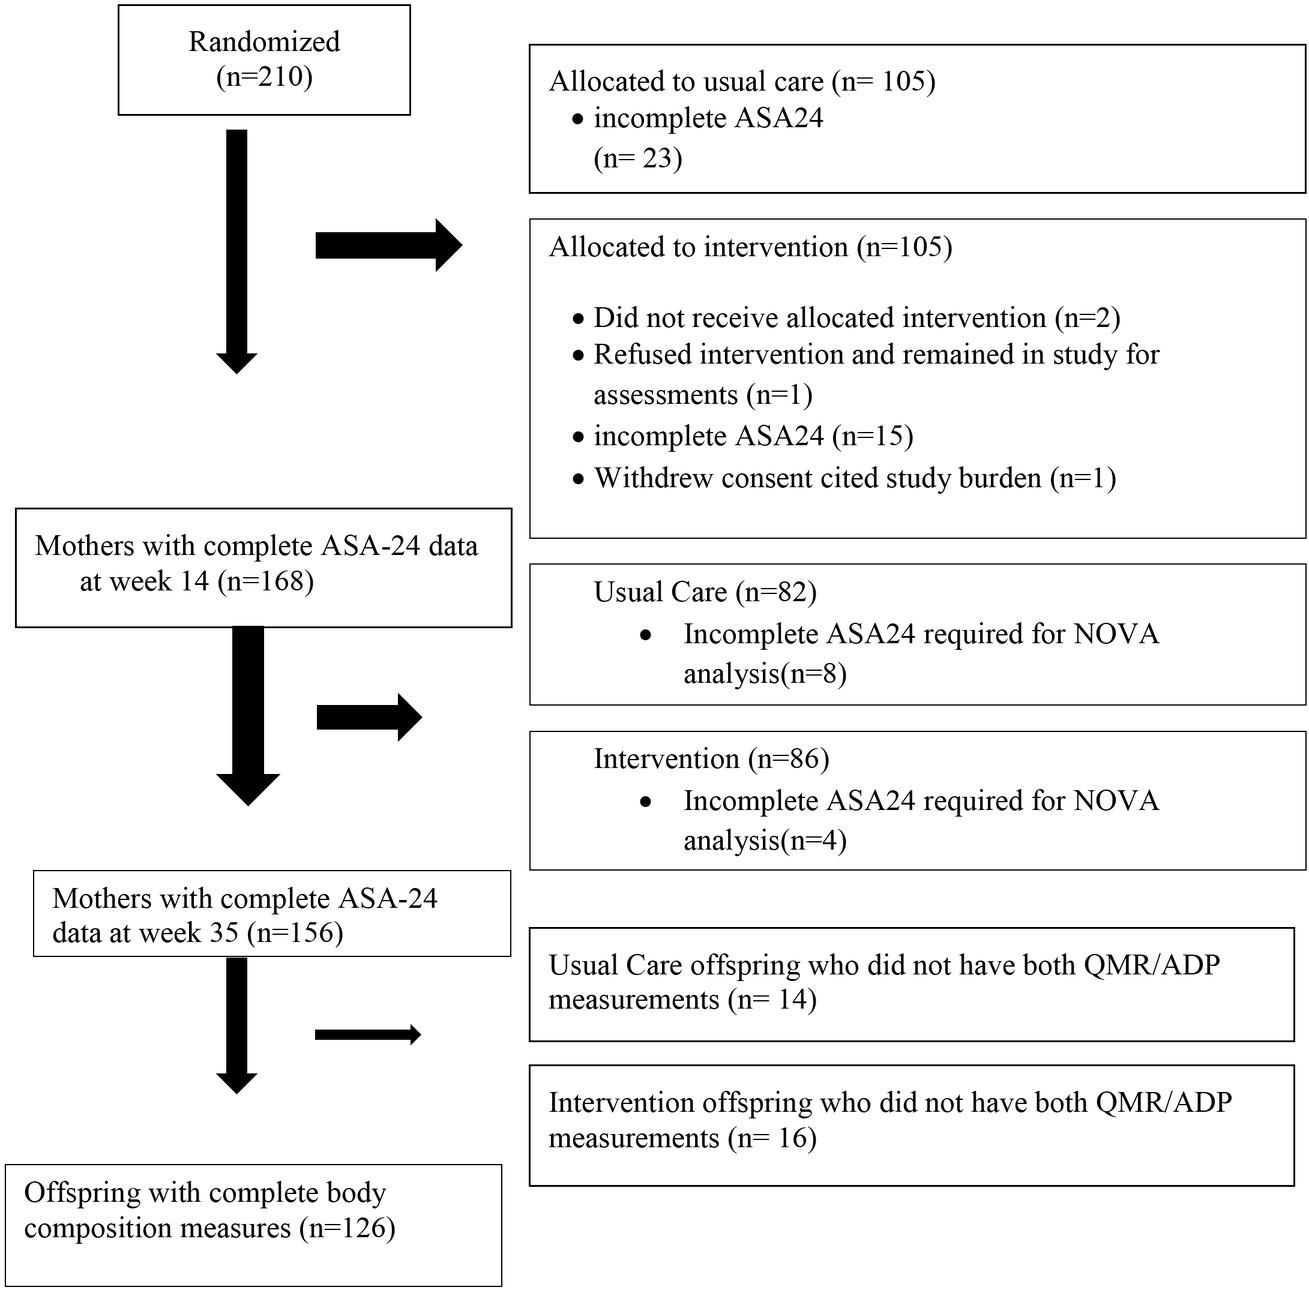
Figure 1
NOVA group energy contribution and diet quality differences between week 14 and 35 according to PEI-UPF quartilesa
| Q1 (0-36.09%) N=39 (Mean±SD) | Q2 (36.10-45.23%) N=39 (Mean±SD) | Q3 (45.24-54.73%) N=39 (Mean±SD) | Q4 (54.74-75.25%) N=39 (Mean±SD) | Total N=156 Mean±SD | ||||||
|---|---|---|---|---|---|---|---|---|---|---|
| Mean Week 14 | Mean Week 35 | Mean Week 14 | Mean Week 35 | Mean Week 14 | Mean Week 35 | Mean Week 14 | Mean Week 35 | Mean Week 14 | Mean Week 35 | |
| G1 % | 48.5±14.9 | 54.6±13.2 | 41.1±17.4 | 44.6±17.8 | 37.5±13.0 | 34.8±10.4 | 25.9±12.4 | 30.8±13.2 | 38.2 ±16.6 | 41.2±16.6 |
| G2 % | 5.6±6.2 | 7.5±7.2 | 7.3±9.9 | 4.1±4.4* | 5.1±6.4 | 4.6±4.4 | 2.6±3.2 | 4.6±5.8* | 5.1±7.0 | 5.2±5.7 |
| G3 % | 14.8±14.1 | 11.4±9.9 | 9.4±8.5 | 12.1±10.6 | 10.8±9.8 | 7.9±9.3 | 6.9±6.4 | 6.8±5.3 | 10.5±10.4 | 9.5±9.2 |
| G4 % | 31.1±14.2 | 26.6±15.3 | 42.2±14.2 | 39.2±13.7 | 46.5±12.9 | 52.7±13.1 | 64.6±15.6 | 57.7±16.8 | 46.1±18.6 | 44.0±19.0 |
| Total | 2004.7± | 1747.1± | 1881.4± | 1845.9± | 2042.1± | 1863.9± | 1856.2± | 1987.4± | 1946 ± | 1861 ±1 |
| Kcals | 927.2 | 918.9 | 975.9 | 1440.9 | 962.9 | 806.2 | 811.7 | 808.4 | 916 | 021 |
| HEI (0-100) | 62.1±13.4 | 63.2±17.1 | 58.3±18.4 | 60.2±18.6 | 55.9±10.9 | 56.3±12.7 | 49.3±15.0 | 56.4±14.7* | 56.4±15.3 | 59.0±16.0 |
Maternal and offspring descriptive analysis by quartiles of percentage of energy intake of ultra-processed foods (PEI-UPF)_
| Maternal+ | PEI-UPF Quartiles | p | |||
|---|---|---|---|---|---|
| Q1 (0-36.09%) N=39 Mean+SD | Q2 (36.10-45.23%) N=39 Mean+SD | Q3 (45.24-54.73%) N=39 Mean+SD | Q4 (54.74-75.25%) N=39 Mean+SD | ||
| %G1a | 51.5±14.0 | 42.8±17.5 | 36.2±11.8 | 28.4±13 | <0.01 |
| %G2a | 6.5±6.8 | 5.8±7.8 | 4.9±5.5 | 3.6±4.7 | 0.04 |
| %G3a | 13.1±12.2 | 10.7±9.7 | 9.4±9.6 | 6.9±5.8 | 0.03 |
| %G4a | 28.8±14.8 | 40.7±14.0 | 49.6±13.3 | 61.2±16.5 | <0.01 |
| Total kcalsa | 1875.9±926.2 | 1863.6±1222.7 | 1953±886.8 | 1921.8±807.5 | 0.78 |
| HEI 0-100a | 62.7±12 | 59.2±15.4 | 56.1±8.3 | 52.9±11.9 | <0.01 |
| Gestational Age (week)a | 14.5±0.72 | 14.6±0.59 | 14.4±0.80 | 14.2±0.84 | 0.17 |
| Maternal Age (years)a | 34.1±3.9 | 33.7±4.5 | 33.5±3.2 | 32.5±4.8 | 0.35 |
| Baseline BMI (kg/m2)a | 29.8±4.0 | 30.2±4.0 | 31.2±5.8 | 30.3±4.9 | 0.33 |
| Parity (%)b | 0.45 | ||||
| 1 | 25.6 | 43.6 | 30.8 | 33.3 | |
| 2 | 33.3 | 30.8 | 25.6 | 38.5 | |
| 3+ | 41.1 | 25.6 | 43.6 | 28.2 | |
| Race (%)b | 0.68 | ||||
| White | 38.5 | 51.3 | 40.0 | 46.2 | |
| Non-white | 61.5 | 48.7 | 60.0 | 53.8 | |
| Income (%)b | 0.96 | ||||
| ≤$75,000 | 33.3 | 33.3 | 35.9 | 38.5 | |
| >$75,000 | 66.7 | 66.7 | 64.1 | 61.4 | |
| College (%)b | 0.12 | ||||
| No | 23.1 | 12.8 | 25.6 | 7.7 | |
| Yes | 76.9 | 87.2 | 74.4 | 92.3 | |
| Group (%)b | 0.77 | ||||
| Usual Care | 40.0 | 51.3 | 46.2 | 51.3 | |
| Lifestyle Intervention | 60.0 | 48.7 | 53.8 | 48.7 | |
| Offspring++ | Q1 N=32 | Q2 N=31 | Q3 N=32 | Q4 N=31 | p |
| Length (cm) (mean±SD)a | 49.8±1.9 | 49.85±2.0 | 50.08±1.8 | 49.55±2.3 | 0.79 |
| Age (days) (mean±SD)a | 2.75±2.1 | 2.62±2.0 | 2.16±1.8 | 2.45±1.9 | 0.65 |
| Sex (%)b | 0.04 | ||||
| Female | 15 (46.9) | 21 (67.7) | 12 (37.5) | 11 (35.5) | |
| Male | 17 (53.1) | 10 (32.3) | 20 (62.5) | 20 (64.5) | |
| Race (%)b | 0.76 | ||||
| White | 59.4 | 51.6 | 62.5 | 51.6 | |
| Non-white | 40.6 | 49.4 | 37.5 | 49.4 | |
Maternal covariates and neonatal birth characteristics by gestational weight gain (above or below the mode)
| Maternal+ | GWG N=156 | Mean Difference ±SE | p | |
|---|---|---|---|---|
| <7.4kg (n=61) | >7.4kg (n=95) | |||
| Gestational Age (week) (mean)a | 14.5±0.70 | 14.35±0.80 | 0.194±.13 | 0.06 |
| Maternal (years) (mean)Age a | 33.6±4.5 | 33.3±4.0 | 0.257±.68 | 0.35 |
| HEI Avg (0-100) | 54.3.1±10.4 | 59.9±13.5 | 5.63+2.0 | <0.01* |
| Parity (%)b | 1.56 | 0.46 | ||
| 1 | 28 | 37 | ||
| 2 | 33 | 32 | ||
| 3+ | 39 | 31 | ||
| Race (%)b | 10.87 | 0.001* | ||
| White | 28 | 55 | ||
| Non-white | 78 | 45 | ||
| Income (%)b | 0.03 | 0.865 | ||
| ≤$75,000 | 36 | 35 | ||
| >$75,000 | 64 | 65 | ||
| College (%) | 3.71 | 0.05* | ||
| No | 25 | 13 | ||
| Yes | 75 | 87 | ||
| Group (%)b | 5.19 | 0.02* | ||
| UC | 36 | 55 | ||
| LI | 64 | 45 | ||
| NOVA PEI | ||||
| G1 | 39.7±15 | 42.3±.17 | 2.4±3.0 | 0.37 |
| G2 | 5.3±5.7 | 5.1±6.0 | 0.1±.0.09 | 0.43 |
| G3 | 8.0±8.0 | 10.0±10.0 | 2.4±1.0 | 0.06 |
| G4 | 46.9±17.6 | 42.2±19.8 | 4.7±3.1 | 0.07 |
| GWG | 4.87±1.9 | 11.44±3.1 | 6.57±0.44 | 0.001** |
| Obesity baseline) (at (%)b | 29.5 | 0.000* | ||
| BMI <29.9 kg/m2 | 34 | 78 | ||
| BMI >29.9 kg/m2 | 66 | 22 | ||
Maternal and offspring correlational analysis of gestational weight gain and neonatal body composition outcome variables with potential covariates_
| Maternal+ | Gestational Weight Gain | Lean Mass (QMR) | Fat Mass (QMR) | Total Body Water (QMR) | Fat Free Mass (ADP) | Fat Mass (ADP) |
|---|---|---|---|---|---|---|
| Total Kcals | 0.05 | -0.01 | 0.03 | 0.03 | 0.02 | 0.03 |
| HEI Average Score 0-100 a | 0.14 | -0.03 | -0.03 | -0.06 | -0.11 | 0.02 |
| Gestational Age (week)a | -0.004 | -0.10 | -0.03 | -0.07 | -0.07 | 0.02 |
| Maternal Age (years)a | -0.06 | -0.16 | -0.12 | -0.20 | -0.16 | -0.17 |
| Baseline BMI (kg/m2)a | -0.31 | 0.11 | 0.17 | 0.12 | 0.10 | 0.22 |
| Parityb | -0.15 | -0.06 | 0.12 | 0.03 | -0.05 | 0.14 |
| Racec | -0.24 | 0.12 | 0.02 | 0.07 | 0.17 | -0.14 |
| Incomec | 0.03 | 0.04 | -0.12 | -0.02 | 0.006 | -0.13 |
| Collegec | 0.17 | -0.08 | -0.20 | -0.14 | -0.07 | -0.24 |
| Groupc | -0.21 | 0.19 | 0.06 | -0.16 | -0.12 | -0.08 |
| Offspring++ | ||||||
| Lengtha (cm) | -- | 0.79 | 0.57 | 0.76 | 0.81 | 0.44 |
| Agea (years) | -- | -0.03 | -0.07 | -0.01 | 0.02 | -0.09 |
| Sexc | -- | -0.32 | -0.32 | -0.36 | -0.32 | 0.24 |
Maternal characteristics at baseline and GWG by intervention/control group
| Intervention (n=82) | Usual Care (n=74) | Test statistic | P | |
|---|---|---|---|---|
| Maternal Age (years) | 33.62± 3.96 | 33.21 ± 4.37 | -0.616a | 0.539 |
| Gestational Age at Randomisation (weeks) | 14.41 ± .753 | 14.43 ± .795 | 0.144a | 0.886 |
| Height (cm) | 164.58± 5.43 | 163.80 ± 6.78 | -0.973a | 0.431 |
| Weight (kg) | 80.88 ± 12.14 | 83.24 ± 15.86 | 1.049a | 0.296 |
| Mean BMI Categories (kg/m2) | 29.86 ± 3.88 | 31.0 ± 5.4 | 1.551a | 0.117 |
| >24.9 | 54 (65.1%) | 41 (55.4%) | 1.783c | 0.182 |
| >29.9 | 29 (34.9%) | 33 (44.6%) | ||
| Parity | 3.042c | 0.804 | ||
| 0 | 26 (31.7%) | 26 (35.1%) | ||
| 1 | 25 (30.5%) | 25 (33.8%) | ||
| >2 | 31 (37.8%) | 23 (31.1%) | ||
| Race/Ethnicity | 1.208c | 0.751 | ||
| Hispanic | 25 (30.5%) | 17 (23.0%) | ||
| Non-Hispanic African | 16 (19.5%) | 16 (21.6%) | ||
| American | 35 (42.7%) | 34 (45.9%) | ||
| Non-Hispanic White | 6 (7.3%) | 7 (9.5%) | ||
| More than one race | ||||
| Household Income | 1.967d | 0.579 | ||
| <$24,999 | 4 (4.9%) | 5 (6.8%) | ||
| $25,000-$74,9999 | 26 (31.7%) | 20 (27.0%) | ||
| >$75,000 | 52 (63.4%) | 49 (66.2%) | ||
| College Degree | 1.416c | 0.291 | ||
| No | 17 (20.7%) | 10 (13.5%) | ||
| Yes | 65 (79.3%) | 64 (86.5%) |
Gestational weight gain and maternal ASA-24 by intervention/control group
| Intervention (n=82) | Usual Care (n=74) | Test statistic | Mean Difference | P | |
|---|---|---|---|---|---|
| Mean±SD | Mean±SD | Mean±SE | |||
| Gestational Weight Gain (kg) | 8.04±3.85 | 9.8±4.4 | 2.658a | 1.76±0.66 | 0.009* |
| Gestational Weight Gain: adherence to Institute of Medicine guidelines | |||||
| Gained Adequately | 51 (62.2%) | 33 (44.6%) | --- | --- | |
| Gained Excessively | 31 (37.8%) | 41 (55.4%) | --- | --- | |
| Gestational Weight Gain:defined by median (7.4kg) | |||||
| Gained Adequately | 39(47.6%) | 22(29.7%) | --- | --- | |
| Gained Excessively | 43(52.4%) | 52(70.3%) | --- | --- | |
| Pre-Intervention: Automated Self-Administered 24 Food Recall Week 14 | N=82 | N=74 | |||
| Total Calories (Kcal) | 1817.16±737.4 | 2088.97 ± 1067.4 | 1.865a | 271.8±148.4 | 0.069 |
| Healthy Eating Index (HEI) 2010 Score (0-100) | 56.69 ±14.31 | 56.09 ±16.32 | -0.245a | -0.60±2.45 | 0.807 |
| Total Fruit (0-5)c | 3.47±1.88 | 3.39±1.98 | 2999b | -0.78±0.31 | 0.896 |
| Whole Fruit (0-5)c | 3.47±2.13 | 3.12±2.19 | 3289b | -0.35±0.35 | 0.318 |
| Solid Fats, Alcohol, Added Sugars (SOFAAS) (0-10)d | 14.06±5.07 | 13.51±6.01 | 2511b | -0.55±0.89 | 0.060 |
| Post-Intervention Automated Self-Administered 24 Food Recall Week 35 | N=82 | N=74 | |||
| Total calories | 1843.4±979.5 | 1880.7±1072 | 0.227a | 37.3±164.3 | 0.837 |
| HEI 2010 Score | 62±16 | 55.8±15.5 | -2.465a | -6.23±2.52 | 0.015* |
| Total Fruitc | 3.83±1.69 | 3.05±1.96 | 3735b | -0.83±0.29 | 0.009* |
| Whole Fruitc | 3.87±2 | 3.00±2.24 | 3764b | -0.79±0.34 | 0.004* |
| SOFAASd | 14.53±5.67 | 12.8±5.67 | 3624b | -1.87±0.90 | 0.036* |
| Pre-Intervention NOVA Scores: | |||||
| Group 1 | 40.0±16.3 | 36.3±16.7 | -1.374 a | -0.036±0.03 | 0.171 |
| Group 2 | 4.9±5.5 | 5.8±8.4 | 0.551 a | 0.006±0.01 | 0.582 |
| Group 3 | 10.6±8.9 | 10.4±11.9 | -0.121 a | -0.002±0.02 | 0.904 |
| Group 4 | 44.6±18.7 | 47.8±18.4 | 1.080 a | 0.03±0.03 | 0.282 |
| Post-Intervention NOVA Scores: | |||||
| Group 1 | 40.5±15.8 | 42.0±17.5 | 0.569 a | 0.151±0.03 | 0.570 |
| Group 2 | 5.2±5.9 | 5.1±5.3 | -0.025 a | -0.003±0.01 | 0.980 |
| Group 3 | 9.4±8.4 | 9.7±10.0 | 0.156 a | 0.002±0.01 | 0.876 |
| Group 4 | 44.9±18.2 | 43.1±20.1 | -0.562 a | -0.017±0.03 | 0.575 |
Marginal means from ordinary least squares regressions of gestational weight gain (n=156) and neonatal body composition variables (n=126) according to quartiles of percentage of energy intake of ultra-processed foods (PEI-UPF)
| PEI-UPF1 Q1 | PEI-UPF1 Q2 | PEI-UPF1 Q3 | PEI-UPF1 Q4 | Ptrend | |||||||||
|---|---|---|---|---|---|---|---|---|---|---|---|---|---|
| Marginal Means | 95% CI | Marginal Means | 95% CI | Marginal Means | 95% CI | Marginal Means | 95% CI | ||||||
| Maternal | |||||||||||||
| GWG (kg) | |||||||||||||
| Unadjusted | 8.84 | 7.5 | 10.2 | 10.05 | 8.7 | 11.4 | 8.26 | 6.9 | 9.6 | 8.34 | 7.0 | 9.7 | 0.213 |
| Adjusteda2 | 8.82 | 7.2 | 10.4 | 10.09 | 8.5 | 11.7 | 8.33 | 6.7 | 9.9 | 8.26 | 6.7 | 9.8 | 0.215 |
| Neonatal | |||||||||||||
| Lean Mass (g) | |||||||||||||
| Unadjusted | 2.30 | 2.2 | 2.4 | 2.28 | 2.2 | 2.4 | 2.38 | 2.3 | 2.5 | 2.29 | 2.2 | 2.4 | 0.414 |
| Adjusteda3 | 2.30 | 2.2 | 2.4 | 2.30 | 2.2 | 2.4 | 2.34 | 2.3 | 2.4 | 2.32 | 2.3 | 2.4 | 0.423 |
| Fat Mass(g) | |||||||||||||
| Unadjusted | .558 | .50 | .62 | .559 | .50 | .62 | .568 | .51 | .62 | .503 | .44 | .56 | 0.224 |
| Adjusteda4 | .554 | .48 | .63 | .544 | .47 | .62 | .569 | .50 | .64 | .521 | .45 | .60 | 0.816 |
| TBW(g) | |||||||||||||
| Unadjusted | 2.42 | 2.3 | 2.5 | 2.39 | 2.3 | 2.5 | 2.52 | 2.4 | 2.6 | 2.41 | 2.3 | 2.5 | 0.457 |
| Adjusteda5 | 2.42 | 2.3 | 2.5 | 2.41 | 2.3 | 2.5 | 2.49 | 2.4 | 2.6 | 2.43 | 2.3 | 2.5 | 0.573 |
| FFM(g) | |||||||||||||
| Unadjusted | 2.89 | 2.8 | 3.0 | 2.81 | 2.7 | 2.9 | 2.96 | 2.8 | 3.1 | 2.85 | 2.7 | 3.0 | 0.568 |
| Adjusteda6 | 2.90 | 2.8 | 3.0 | 2.82 | 2.7 | 2.9 | 2.92 | 2.8 | 3.0 | 2.88 | 2.8 | 3.0 | 0.835 |
| Fat Mass (g) | |||||||||||||
| Unadjusted | .353 | .30 | .41 | .366 | .31 | .42 | .357 | .30 | .41 | .294 | .24 | .35 | 0.119 |
| Adjusteda7 | .350 | .29 | .41 | .340 | .28 | .40 | .351 | .29 | .41 | .327 | .26 | .39 | 0.482 |
Neonatal birth characteristics and body composition by intervention/control group
| Intervention (n = 68) | Usual Care (n = 61) | T-Test Statistic | p | |
|---|---|---|---|---|
| Birth weight (g) | 3280±421 | 3160 ±468 | -1.465 | 0.146 |
| Birth length (cm) | 49.84±1.983 | 49.8±2.034 | -0.325 | 0.746 |
| Age at measurement | 2.54 ±2.1 | 2.34±1.8 | -0.589 | 0.557 |
| (days) | ||||
| Weight for length z score | -0.22±0.7 | -0.43±0.8 | -1.57 | 0.119 |
| PEAPOD | ||||
| FM (g) | 352.5 ±172 | 329 ±155 | -0.806 | 0.422 |
| FFM (g) | 2920±335 | 2830 ±383 | -1.433 | 0.151 |
| QMR | ||||
| FM (g) | 555±171 | 535± 164 | -0.676 | 0.500 |
| LM (g) | 2360± 262 | 2260±293 | -2.149 | 0.034* |
| TBW (g) | 2480 ± 282 | 2390 ± 308 | -1.827 | 0.070 |