Fig. 1.
Removal rate constant of H2 in soil as a function of temperature, eq. (15) (after Ehhalt and Rohrer, 2011). The decreasing branch of the profile, dashed line, is less well defined and may depend on the actual soil type and region.
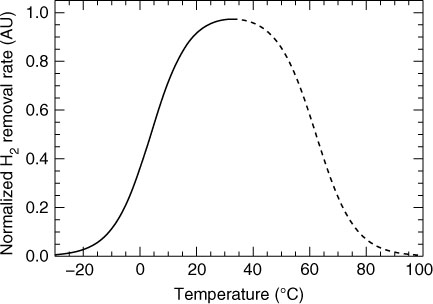
Fig. 2.
Removal rate constant of H2 in soil, ksΘa, as a function of soil water saturation, Θw/Θp. Squares represent eolian sand and triangles represent loess loam, eqs. (16) and (17) (after Ehhalt and Rohrer, 2011).
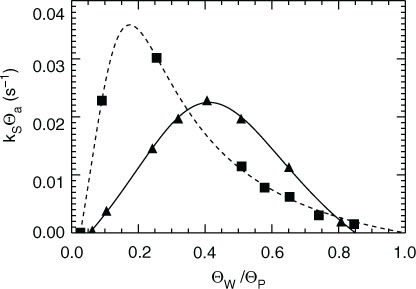
Fig. 3.
Vertical profiles of the volumetric soil water content, Θw, for (a) sandy loam and (c) loam calculated using HYDRUS. The corresponding vertical profiles of the hydrogen removal rate in soil, ksΘa, calculated from these moisture profiles using eq. (16) or (17) for ksΘa(ΘW) are shown in the right panels (b, d). The profiles were calculated for a dry spell lasting about 2 weeks at 0, 1.5, 3, 6, and 12 days after the last rainfall.
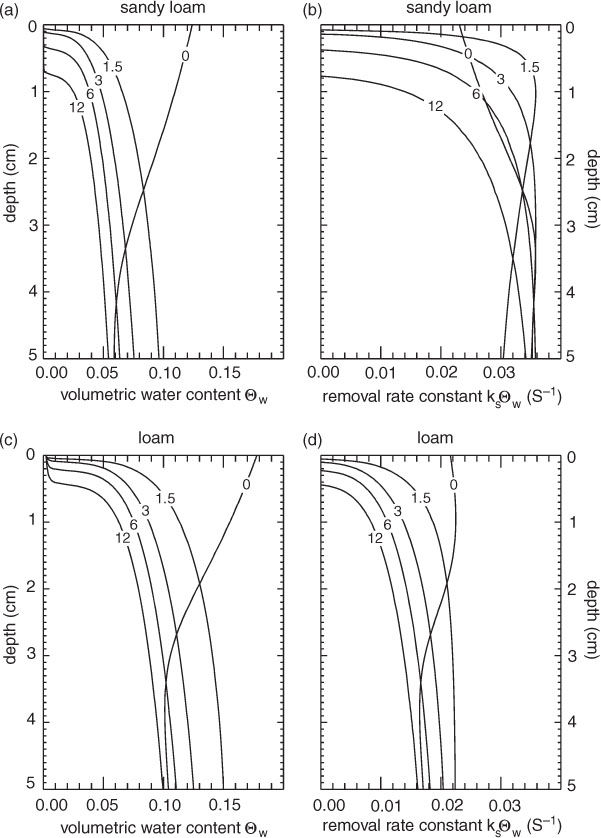
Fig. 4.
The dependence of δ on the average volumetric soil water content, , calculated for various soils (blue diamonds: sandy loam; red crosses: loam). The full curves represent fits to the data for sandy loam, and for loam, respectively.
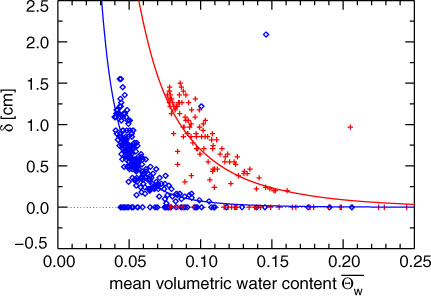
Fig. 5.
Deposition velocity, vd, as a function of the average volumetric soil water content, (heavy full line: loess loam two-layer model; thin full line: loess loam single-layer model; heavy dashed line: sandy soil two-layer model; thin dashed line: sandy soil single-layer model).
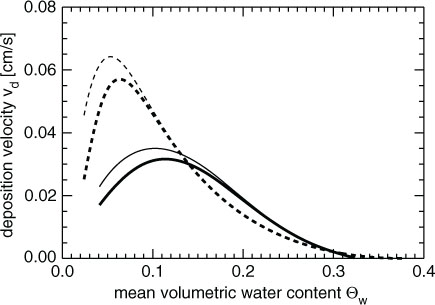
Fig. 6.
Dependence of vd on for (a) sandy loam and (b) loam. The full squares represent the numerically calculated values of vd for individual profiles of Θw and ksΘa; the full lines represents the average vd() based on eq. (13) for vd and eqs. (18) and (19) for δ. The thin lines indicate the average vd() from the corresponding one-layer model.
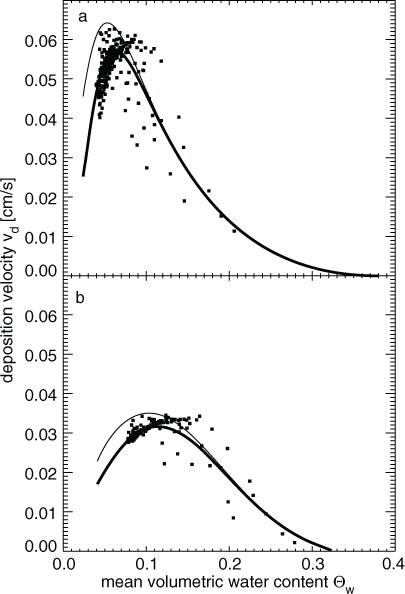
Fig. 7.
Deposition velocity, vd, as a function of the average volumetric water content, , for loess loam. The triangles mark the vd measured by Schmitt et al. (2009) – the open triangles referring to site 1. For clarity, only one pair of the experimental errors is given. The error in is the same for all data points. The error in vd varies, but is in most cases the size of the symbols. The heavy full line represents vd calculated from eq. (13) for T=15°C using eq. (19) for δ and eq. (17) for ksΘa with a scaling factor A=2. The upper and lower bound of the dark shaded area indicate the corresponding vd calculated for 30°C and 0°C, respectively. The uncertainty introduced by the use of eq. (19) for δ is indicated by the superimposed light shaded area. The thin curve represents a vd calculated from eq. (13) with A=8 and T=30°C.
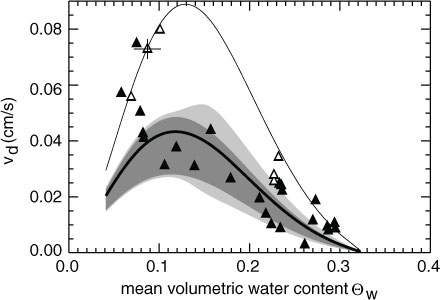
Fig. 8.
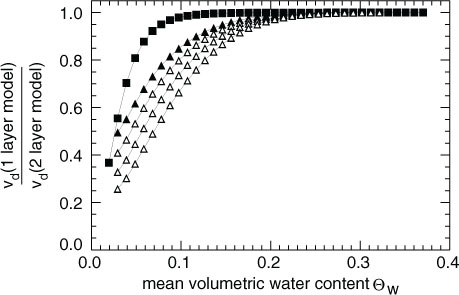
Ratio of vd from the two layer to that of the one-layer model as a function of . Full squares represent sandy soil for A=1. Full triangles represent loam for A=1; open triangles are for loam with A=2, 4, and 8.