
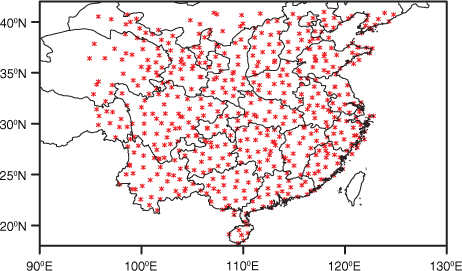
Fig. 1
The 565 observational stations used in this study.
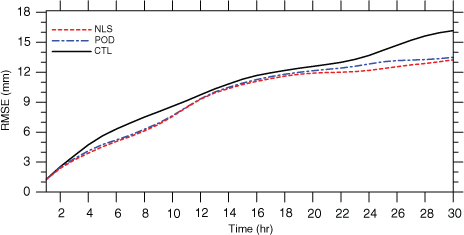
Fig. 2
RMSEs of 30-hour forecast of accumulated rainfall (from 1~30 hours) with the ICs from ‘CTL’ (solid line), ‘POD’ (long-dashed line) and ‘NLS’ (short-dashed line).

Fig. 3
Accumulated rainfall difference (mm) between (a) ‘NLS’, (b) ‘POD’, (c) ‘CTL’ and the ‘truth’ at 18 hours after the analysis time.
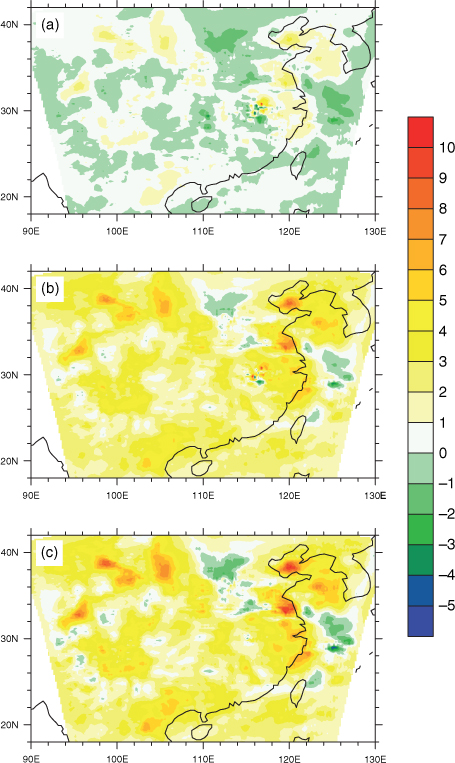
Fig. 4
Temperature difference (K) on the σ=0.512 level between (a) ‘NLS’, (b) ‘POD’, and (c) ‘CTL’ and the ‘true’ state at the analysis time.
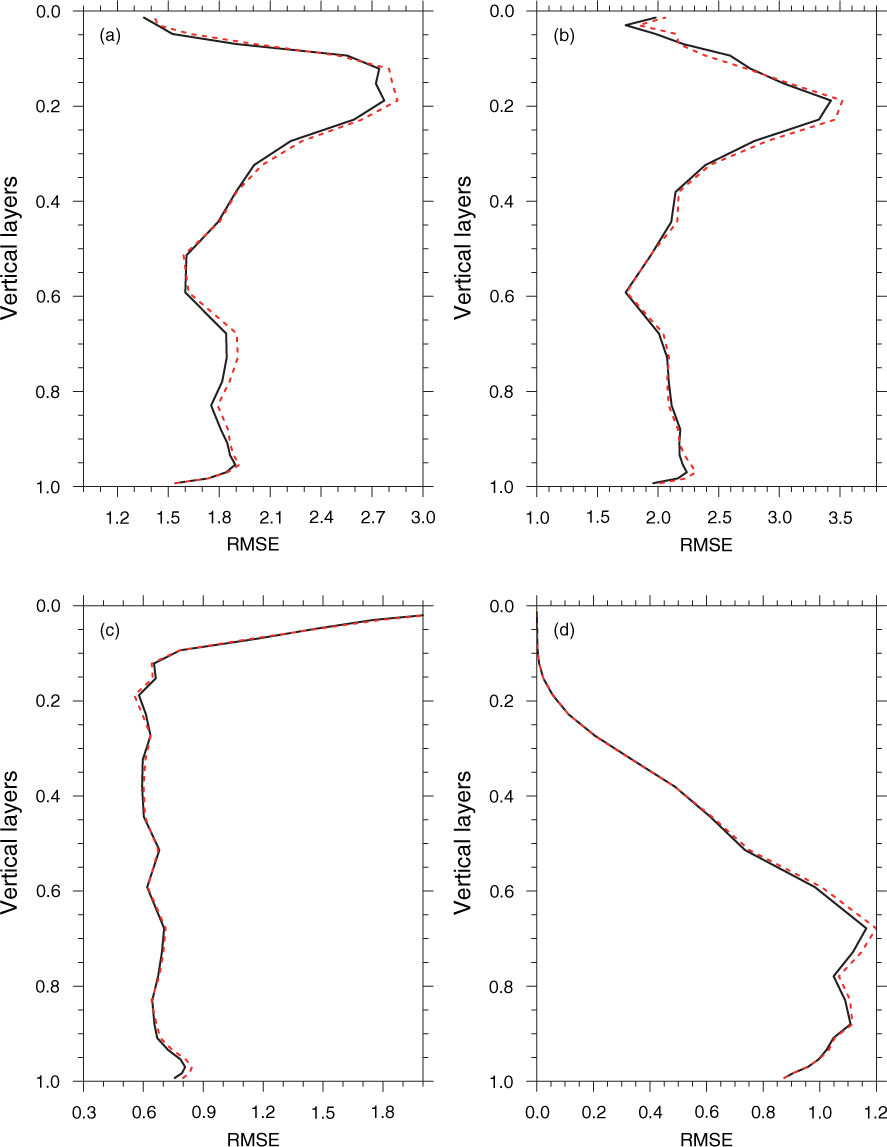
Fig. 5
Vertical profiles of RMSEs of (a) zonal wind (m s−1), (b) meridional wind (m s−1), (c) temperature (°C), and (d) water vapour mixing ratio (g kg−1) of ‘NLS’ (solid curve) and ‘POD’ (dashed line) at the start of the assimilation window.

Fig. 6
Same as Fig. 5, but for at the end of the assimilation window.